Market Wizard
69 posts

@tightvcptrader Yes, shake out mil jaye. I have a feeling ARSSBL bhi chal jayega saath mein.
English


@AnkurPatel59 I will pick stock B as it is in momentum right now and have multiple pocket pivot volumes in it.
English

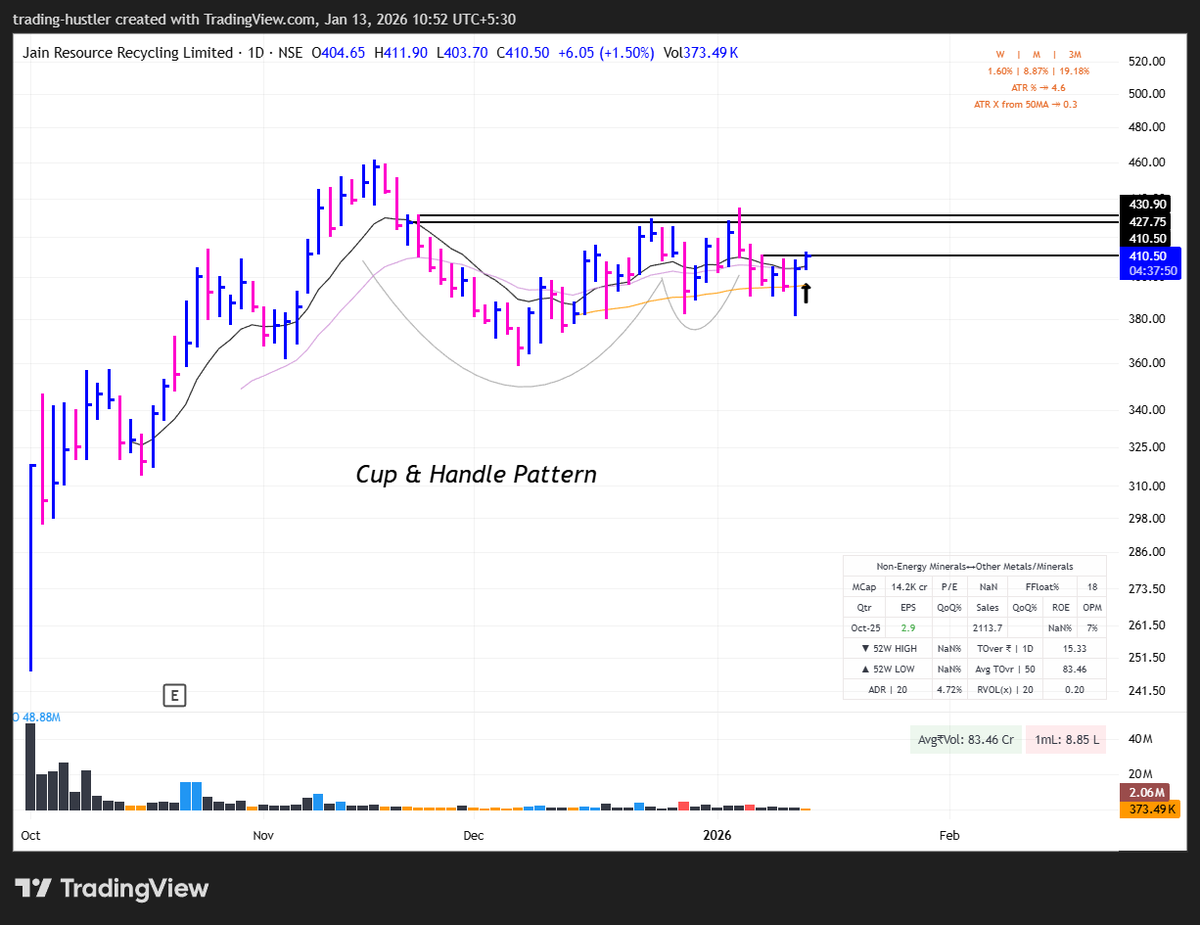
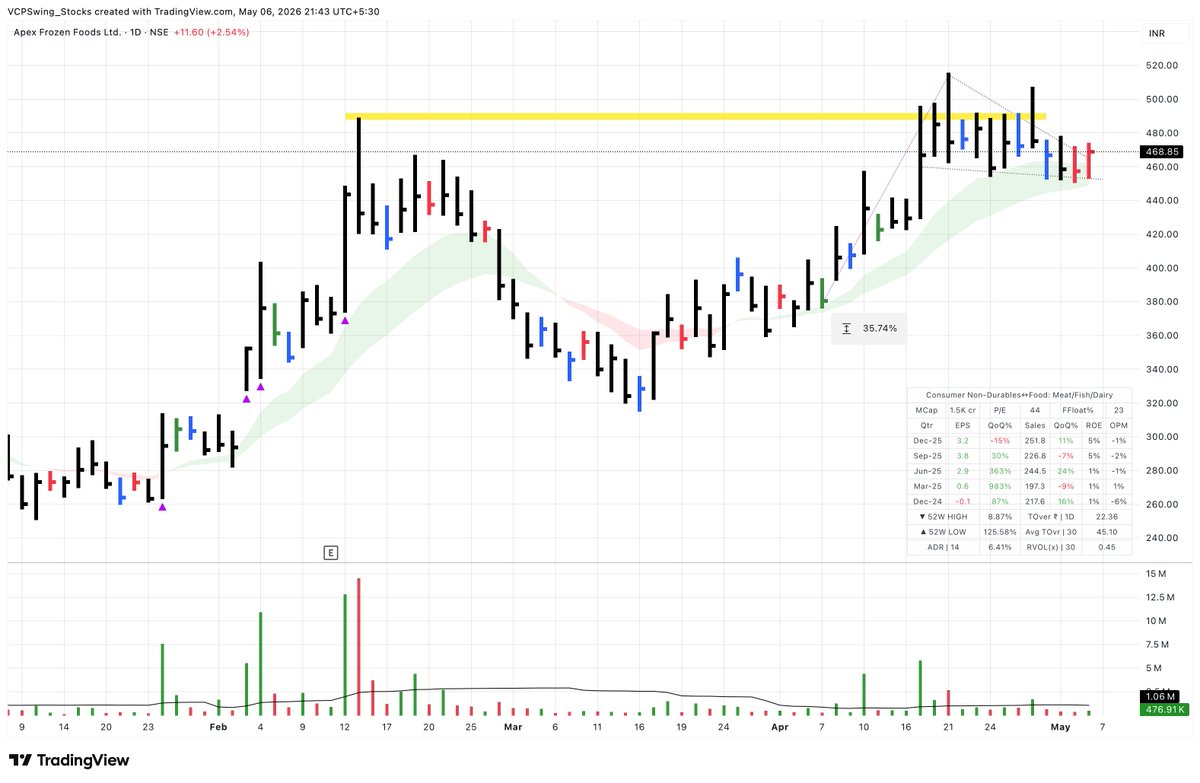
Stock quiz time.
You have three setups . Setup A, B and C.
All three are daily charts. All are trading above their 10, 20 and 50 EMA.
Suppose there us a situation where all three stocks are in your watch list. But you can take only one trade.
Which one will you choose?
There is no right or wrong answer here. This is a mental exercise. In a strong market, situations like this happen all the time. You have multiple good setups, but limited capital.
So the question is not just what you buy. It is why you choose one over the other.
Answer with your pick. And most importantly, explain your why. That is what gives clarity in your process.
#Stockquiz


English

#INOXINDIA - The dark side of Investing / Trading ⛈️
What was supposed to be a 0.5% risk trade turned out to be a trade impacting a -1% just because of the rapid fall.
During the fall you will be stuck in a war with your mind to either wait for it to come back or just exit and follow your system.
The first thought is linked with "HOPE" which is not under my control. And relying on "HOPE" is by far the most dangerous strategy in Investing.
The second thought is linked with "SET OF RULES & SYSTEM" which is under my control.
Took the SL. Confident enough I can make it back!
"Grab your balls & move ahead" is what we gotta do when uncertainty decides to act dirty.

English

@VCPSwing Do you place orders a day before at PDH or execute the trade as the market opens?
English


1/ Still using AI-generated slop journals with zero design taste? 💀
We built one of the craziest trading journals ever.
One-click broker sync.
One-click migration from other journals.
Trading terminal view. Annotated charts. Analytics.
Portfolio holdings. Running stats. Multiple portfolios for different strategies.
Real-time ticks just like your broker. Real-time stock charts.
Supports both Indian and US markets.
Never type a single thing manually again. We promise.
Runs completely in your browser with real-time Google Drive backups.
@nexus_journal
FREE for the next few days.
Like. Comment. RT. Share.
Comment “FREE” and I’ll DM you the link.

English
Market Wizard retweetledi

THIS IS IMPORTANT.
If you think this doesn’t affect you yet, it will.
The moment your current subscription expires and you renew, you’ll face the same issue.
PLEASE RESHARE.
TOGETHER, WE CAN MAKE THIS IMPOSSIBLE TO IGNORE.
Chhirag Kedia@swing_ka_sultan
AN OPEN LETTER TO TRADINGVIEW FROM AN ADMIRER I’ve always been a big admirer of the team at @tradingview for what they’ve built and how they’ve transformed the charting experience for traders. I’ve also been quite vocal about the importance of investing in essential tools rather than hesitating over such costs. However, the recently introduced symbol limits per watchlist, even on paid plans, feel like a step backward. I understand the intent to increase ARPU and push upgrades, but reducing the Premium plan limit from 1000 to 500 symbols is quite restrictive, especially considering it’s already at the upper end of what retail traders in India can afford. This change feels unjustified and, ideally, the earlier limits should be restored. If that’s not feasible, then at least increasing the caps would be a fair middle ground, bringing Premium back to 1000 symbols, and raising Essential and Plus tiers to 250 and 500 respectively. Now, one might argue why anyone would need such a large number of symbols in a watchlist and how it actually helps. What most traders, and even the team at TradingView, may not fully understand about India is the concept of circuit filters enforced by our regulators. This is quite unique to Indian markets. Since international platforms don’t provide a way to exclude stocks based on these filters directly in scanners, we are forced to first eliminate such stocks using local tools. To avoid illiquid names, especially those stuck in 2% or 5% circuit filters, we have to create a refined “Total Universe” watchlist first. Only then can we effectively run scans on TradingView. If we skip this step and rely purely on inbuilt scanners, results often get cluttered with circuit-bound stocks, which are practically untradeable and hard to filter out afterward. Currently, National Stock Exchange of India has around 2300 listed stocks. Even after filtering out illiquid names and those under strict circuit limits, we are still left with roughly 900 to 1100 stocks depending on market conditions. This already exceeds even the earlier limits. I had earlier requested increasing these limits, but the recent change has gone in the opposite direction, making it almost impractical to use TradingView’s watchlist-based scanning effectively in Indian markets. I’ve used multiple platforms over the years, free and paid, desktop and web, and haven’t encountered such restrictive limitations elsewhere. This kind of constraint could actually give competing platforms an opportunity to challenge TradingView, at least in the Indian market. On behalf of retail traders and the fintwit community, I would strongly request the TradingView team to restore the earlier limits. If changes are unavoidable, then at least consider increasing the limits as suggested earlier. I’d also urge the fintwit community to support and amplify this, so the importance of this issue is clearly communicated.
English
@VVVStockAnalyst
Hi Rohit, Do you have telegram channel as well ?
Found adv. for this channel.
Please confirm

English
English

@Market_Wizard__ @satishvasu @swing_ka_sultan @Anuragg_CA We’ve already selected the second trader to feature in this series, and the research is currently underway. It is scheduled for a June release.
English
Should we start preparing for the third trader to feature in the Dan Zanger-style webinar series?
Same market you’re trading.
Same constraints you complain about.
No perfect conditions.
No ideal setup.
Yet very soon, someone will hit their first triple-digit return.
So ask yourself:
What’s your excuse?
He may be the first super-performance story we showcase. But he won’t be the last.

English
In a bold and historic step towards Dhan Mukt Bharat, SEBI has introduced portfolio-level circuit filters to protect innocent retailers from the dangers of making too much money.
If your portfolio rises more than 2% in a day, it will be auto squared off.
Further, if your portfolio is up 5% in a week, you will receive a show cause notice.
Failure to justify this suspicious activity will result in a 500% penalty.
English
Market Wizard retweetledi

You might agree or disagree but you should not ignore what Nifty Smallcap 250 / Nifty 50 ratio is saying right now
🧭 THE RATIO NOBODY IS WATCHING
IS THE ONLY CHART THAT MATTERS RIGHT NOW.
By the end of this post, you will understand something
most market participants have completely missed.
Not where Nifty is going.
Not which sector to buy next.
But WHERE we are in the cycle.
Precisely. Structurally. Historically.
And why that single insight changes every decision
you make about Indian equities for the next 24 months.
All data: NSE, TradingView 1M charts, Screener.in.
Cross-referenced across 20 years of verified index history.
📌 The one sentence this entire thesis reduces to:
"The market does not reward prediction.
It rewards positioning."
━━━━━━━━━━━━━━━━━━━━━━━━━━━━━━━━━━━━━━━━━━━━━━━━━━━━━━━
🔍 WHAT EVERYONE BELIEVES RIGHT NOW
Here is the consensus narrative on every platform today:
→ "Smallcaps corrected 20-25%. Bottoms are near."
→ "This is a buying opportunity in SC 250."
→ "Nifty will hold 21,500 and make new highs by year end."
Confident. Comfortable. Almost certainly wrong.
Here is the data that proves it.
Most people believe a 20% price correction in smallcaps
signals a cycle bottom.
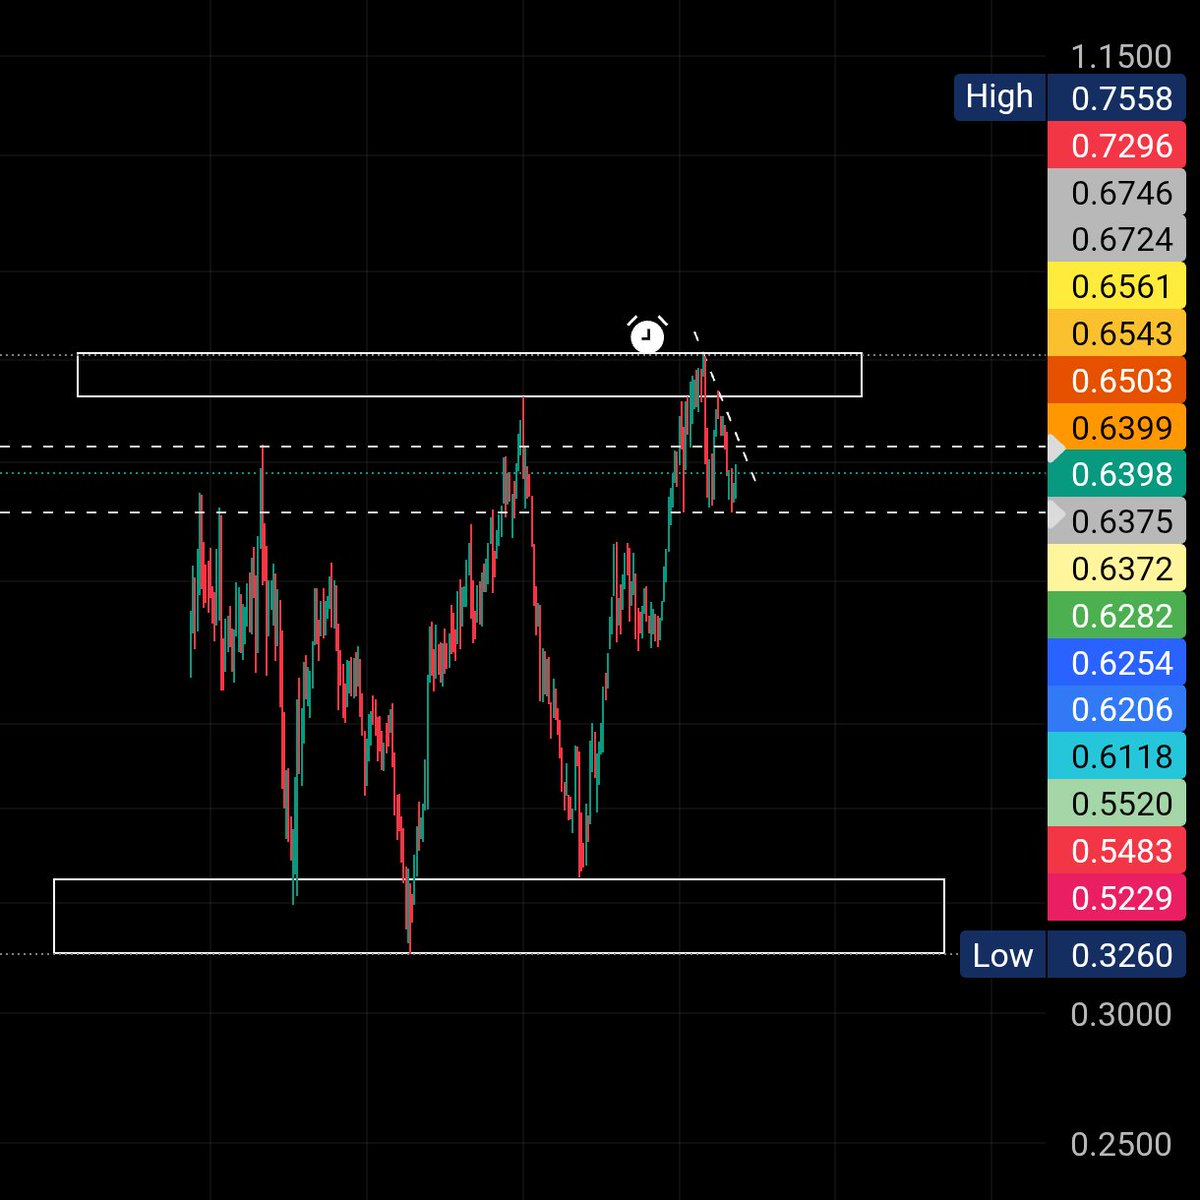
But the Nifty Smallcap 250 / Nifty 50 ratio
sits at 0.64 today.
It peaked at 0.75 in December 2024.
In every past cycle since 2003, the ratio has cycled
between a topping zone of 0.65 to 0.75
and a bottom zone of 0.32 to 0.36.
We have covered less than one-third of that journey.
📌 This is not a correction that is almost over.
This is a correction that has barely begun.
━━━━━━━━━━━━━━━━━━━━━━━━━━━━━━━━━━━━━━━━━━━━━━━━━━━━━━━
🔭 WHAT THIS POST IS AND IS NOT
This is NOT a call to panic or exit equities.
This IS a structural framework to understand exactly
where we are in a 20-year Indian market cycle.
→ Not a short-term trading call.
→ Not pessimism dressed as analysis.
→ Not a prediction. A map.
Most market commentary confuses two things:
📉 Price falling vs 📐 Cycle structure deteriorating.
The Nifty Smallcap 250 has fallen 23.5% from ATH 18,688.
The ratio has moved only from 0.75 to 0.63.
Price tells you what happened.
The ratio tells you where you are in the cycle.
Only one of those two numbers is actionable.
━━━━━━━━━━━━━━━━━━━━━━━━━━━━━━━━━━━━━━━━━━━━━━━━━━━━━━━
🌊 THE TIDE THAT IS TURNING
Picture a beach at high tide.
The water is high. Everything looks covered.
The rocks are invisible. The sand is submerged.
This is India post-2020.
Liquidity flooded every asset class.
Smallcap companies that had never seen institutional capital
were suddenly being re-rated aggressively.
The Nifty Smallcap 250 went from 2,867 in March 2020
to 18,688 by late 2024.
A 551% gain in 56 months.
Demat accounts crossed 100 million.
Smallcap fund AUM hit all-time highs.
The ratio peaked at 0.75 in December 2024.
Now the tide is turning.
Not with crashing waves.
The way tides always turn.
Slowly at first. Then undeniably.
You cannot see the rocks yet.
But the water level is dropping every month.
And everyone standing on what they thought was sand
is about to discover where the rocks actually are.
━━━━━━━━━━━━━━━━━━━━━━━━━━━━━━━━━━━━━━━━━━━━━━━━━━━━━━━
📊 THE DATA NOBODY PUTS TOGETHER
THE RATIO. 20-YEAR VERIFIED CYCLE ZONES:
→ 0.65 to 0.75 Topping zone. Euphoria. Speculation peak.
→ 0.60 to 0.65 Early breakdown. Smart money exits quietly.
→ 0.50 to 0.55 Mid-cycle reset. Where March 2023 bottomed.
→ 0.40 to 0.48 Full cycle capitulation. Maximum opportunity.
→ 0.32 to 0.36 Deep bear bottom band. Crisis territory.
📍 CURRENT RATIO: 0.64
In the early breakdown zone.
Still two full phases away from the real buy zone.
---
THE SC 250 INDEX. WHERE ARE WE STRUCTURALLY:
→ ATH: 18,688 (late 2024)
→ Current: 14,288 (March 30, 2026)
→ Fall from ATH: -23.5%
Historical peak-to-trough in every major bear cycle:
→ 2008 bear: SC 250 fell -76% from peak.
→ 2013 bear: SC 250 fell -52% from peak.
→ 2020 bear: SC 250 fell -58% from peak.
→ Average: -62% peak to trough.
We are at -23.5% from ATH.
Based on the historical average,
roughly 79% of this bear cycle remains ahead of us.
---
THE PE PICTURE CONFIRMS IT:
→ SC 250 PE today: ~25.6x
→ SC 250 PE at March 2023 low: ~16.9x (mid-cycle, not bottom)
→ SC 250 PE at historical lows: 14x to 16x (full bear bottoms)
→ SC 250 PE at 2008 bottom: below 10x
We are at 24.1x today.
Historical smallcap cycle bottoms in India occur
between 14x and 16x PE.
We are nowhere near that.
---
🤔 YOU ARE PROBABLY ASKING:
"If this is historically true, why does it FEEL
like the bottom is already in?"
Because the human brain cannot distinguish between
price pain and cycle completion.
A 23% fall feels enormous when you are living through it.
Until you look at what every prior Indian bear cycle
has actually demanded before the real bottom formed.
The March 2023 rally fooled most people.
The ratio had only reached 0.50 at that point.
That was a mid-cycle reset. Not a bottom.
The real cycle bottom requires the ratio to reach
0.32 to 0.36.
And the PE to fall to 14x to 16x.
Neither has happened yet.
━━━━━━━━━━━━━━━━━━━━━━━━━━━━━━━━━━━━━━━━━━━━━━━━━━━━━━━
🏔️ THE NIFTY 50 STRUCTURAL MAP
Nifty today: 22,331. ATH: 26,373. Fall: -15.3%.
POST-2003 BEAR MARKET HISTORY. COMPLETE RECORD:
Only 2 real crashes in 23 years:
🔴 2008 GFC: -64.35% top to bottom. Floor: 144M EMA.
🔴 2020 COVID: -39.50% top to bottom. Floor: 144M EMA.
Only 2 corrections crossing 20%:
🟠 Nov 2010 to Dec 2011: -28.5%. Floor: 63M EMA held.
🟠 Mar 2015 to Feb 2016: -25.3%. Floor: 63M EMA held.
Everything else was a shakeout:
🟡 Oct 2021 to Jun 2022: -18.5%.
🟡 Sep 2024 to Apr 2025: -17.5%.
THE CRITICAL STRUCTURAL RULE:
→ 63M EMA holds = 20-28% normal correction. Bull resumes.
→ 63M EMA breaks = 30-40% deep bear. Structural damage.
→ 144M EMA tested = Real crash. GFC or COVID type.
THE NIFTY SUPPORT MAP RIGHT NOW:
→ 63M EMA: 20,560 (-22.1%) First major test
→ AVWAP 2022 low: 19,422 (-26.3%)
→ 30% from ATH: 18,461 (-30.0%)
→ AVWAP 2020 low: 17,961 (-31.9%)
→ 100M SMA: 16,917 (-35.9%)
→ 40% from ATH: 15,823 (-40.0%)
→ 144M EMA: 15,766 (-40.2%) Real crisis floor.
The 144M EMA and 40% from ATH are virtually identical.
Both times a real crash happened, this level was the floor.
Monthly close. Never broke below. Not once in 23 years.
━━━━━━━━━━━━━━━━━━━━━━━━━━━━━━━━━━━━━━━━━━━━━━━━━━━━━━━
🔢 THE ARITHMETIC NOBODY WANTS TO DO
This is not an opinion. This is multiplication.
📐 If Nifty falls 30% from ATH:
26,373 x 0.70 = 18,461
📐 If ratio compresses to 0.40 (capitulation zone):
18,461 x 0.40 = 7,384 on SC 250.
SC 250 today: 14,288.
SC 250 at base case bottom: 7,384.
Additional fall ahead from today: -48.3%.
Let that sit for a moment.
Not because it is guaranteed.
But because this exact outcome has materialised
in every major Indian bear cycle since 2003.
→ 2008: Ratio hit 0.38. SC 250 fell -76%.
→ 2013: Ratio compressed to 0.42. SC 250 fell -52%.
→ 2020: Ratio compressed to 0.47. SC 250 fell -58%.
Every cycle. Without exception.
We are at 0.63 today.
The gap between 0.63 and 0.40 is your preparation window.
Use it or lose it.
━━━━━━━━━━━━━━━━━━━━━━━━━━━━━━━━━━━━━━━━━━━━━━━━━━━━━━━
🔁 HOW SMALLCAPS ACTUALLY FALL
Not linearly. In phases.
Each phase more brutal than the last.
🔴 PHASE 1 | TOPPING (Ratio 0.75 to 0.65)
STATUS: COMPLETED.
→ Smart money exits quietly while headlines stay bullish.
→ Retail keeps buying. The most deceptive phase.
→ Window: December 2024 to approximately February 2026.
🟠 PHASE 2 | BREAKDOWN (Ratio 0.65 to 0.55)
STATUS: IN PROGRESS RIGHT NOW.
→ Ratio at 0.63 and falling.
→ Smallcap funds visibly underperform Nifty every month.
→ Breadth deteriorates. More losers than winners.
→ Most investors still not alarmed. This is the trap.
🟡 PHASE 3 | ACCELERATION (Ratio 0.55 to 0.45)
STATUS: AHEAD.
→ Forced selling from leveraged positions begins.
→ Smallcap fund redemptions surge month after month.
→ Every technical bounce gets sold aggressively.
→ Retail panic fully activated.
→ Feels like there is no floor anywhere.
🟢 PHASE 4 | CAPITULATION (Ratio 0.45 to 0.36)
STATUS: AHEAD. THIS IS THE ZONE.
→ Maximum pessimism.
→ PE compresses to 14x to 16x.
→ SIP stoppage and redemptions peak simultaneously.
→ Nobody publicly discusses smallcap investing.
→ THIS IS WHERE GENERATIONAL WEALTH IS CREATED.
⚫ PHASE 5 | DEEP BOTTOM BAND (Ratio 0.32 to 0.36)
STATUS: TAIL RISK.
→ Requires a systemic macro event. GFC-type disruption.
→ Maps to 144M EMA territory on Nifty.
→ If it happens, deploy absolutely everything you have.
━━━━━━━━━━━━━━━━━━━━━━━━━━━━━━━━━━━━━━━━━━━━━━━━━━━━━━━
🎯 THREE SCENARIOS. FULLY MAPPED.
Scenario Nifty SC 250 Ratio SC vs today
---------------------------------------------------------
🐂 Mid-Cycle 21,500 10,750 0.50 -24.8%
📊 Base Case 18,461 7,384 0.40 -48.3%
⚫ Deep Bear 16,917 6,090 0.36 -57.4%
Personal estimates only. Not SEBI research. Not investment advice.
MID-CYCLE SCENARIO:
→ Nifty holds 63M EMA at 20,560. Does not break.
→ Ratio bottoms near 0.50 (mirrors March 2023 pattern).
→ SC 250 lands between 10,000 and 11,000.
→ PE falls to approximately 17x to 19x. Acceptable but not cheap.
→ This is the bull case. Possible if FIIs return forcefully.
BASE CASE (highest probability):
→ Nifty corrects 30% from ATH. 63M EMA breaks.
→ Ratio compresses to 0.40. Every full bear cycle hit this.
→ SC 250 lands near 7,384. Down 48% from today.
→ PE falls to 14x to 16x. Historical bottom territory.
→ HDFCSML250 ETF NAV: approximately Rs 74 to Rs 76.
DEEP BEAR (tail risk, low probability):
→ Macro stress event required.
→ Ratio falls to 0.32 to 0.36 bottom band.
→ Nifty tests 144M EMA at 15,766.
→ SC 250 at 5,700 to 6,500.
→ Deploy everything if this materialises.
THESIS INVALIDATION SIGNAL:
→ Monthly ratio close above 0.70.
→ SC 250 makes new all-time high above 18,688.
→ If either happens, this framework pauses.
The near miss most analysts are making right now:
Most institutional analysts expected SC 250 to bottom
between 11,000 and 12,000 citing "35% correction from ATH."
They anchored to price. Not to the ratio.
Not to PE.
The March 2023 bottom taught us clearly:
Even at ratio 0.50 and PE 16.9x, the market was only
mid-cycle. Not a full structural bottom.
This time, with the ratio starting from 0.75,
a full reset requires the ratio to reach 0.36 to 0.48.
Not 0.50.
━━━━━━━━━━━━━━━━━━━━━━━━━━━━━━━━━━━━━━━━━━━━━━━━━━━━━━━
⚠️ THE RISKS TO THIS FRAMEWORK
Intellectual honesty is non-negotiable.
🔵 RISK 1: Global liquidity returns sharply.
→ US Fed pivot + aggressive FII inflows into India.
→ Signal: monthly ratio close back above 0.70.
🔵 RISK 2: Indian earnings beat consensus for 2-3 quarters.
→ SC 250 PE at 25.6x could compress slowly via earnings growth
rather than price fall.
→ But current 1-year SC 250 CAGR is only 4.66% (Screener.in).
Earnings are not supporting current valuations yet.
🔵 RISK 3: Structural re-rating raises the ratio floor.
→ India's global index weight has grown materially.
→ Domestic SIP flows are now structural, not purely cyclical.
→ The ratio floor this cycle could be 0.45 to 0.50
rather than 0.32 to 0.36. Possible.
🔵 RISK 4: Small sample size limits confidence.
→ Only 3 full bear cycles since 2003.
→ Framework is probabilistic. Not deterministic.
→ Treat scenarios as base cases, not certainties.
━━━━━━━━━━━━━━━━━━━━━━━━━━━━━━━━━━━━━━━━━━━━━━━━━━━━━━━
🌱 THE OPPORTUNITY ON THE OTHER SIDE
Every Indian smallcap bear cycle since 2003
was followed by a bull market that completely
dwarfed the preceding decline.
THE FULL RECORD:
→ 2008 bottom: SC 250 returned +420% to the next peak.
→ 2013 bottom: SC 250 returned +400% in 53 months.
→ 2020 bottom: SC 250 returned +420% in 56 months.
The ratio is your map.
When it reaches 0.36 to 0.48 and PE falls to 14x to 16x,
that is not a danger zone. That is the launch pad.
If HDFCSML250 ETF reaches Rs 74 to Rs 76 at base case:
→ Rs 10 lakh invested becomes Rs 45 lakh at +350%.
→ Rs 25 lakh invested becomes Rs 112 lakh at +350%.
Not in a year. In a full bull cycle. 5 to 7 years.
But ONLY if you have dry powder ready at the bottom.
And dry powder only exists if you did not deploy too early.
The gap between 0.63 and 0.40 is not dead time.
It is the most important phase of the entire cycle.
━━━━━━━━━━━━━━━━━━━━━━━━━━━━━━━━━━━━━━━━━━━━━━━━━━━━
✅ THREE THINGS YOU NOW KNOW
1. THE RATIO IS THE ONLY REAL MAP.
→ SC 250 / Nifty 50 ratio tops between 0.65 and 0.75.
→ It bottoms at 0.32 to 0.36 in full bear cycles.
→ Mid-cycle reset (like March 2023) stops at ~0.50.
→ We are at 0.63 today. Early Phase 2. Work not done.
2. PE CONFIRMS WHAT THE RATIO SHOWS.
→ SC 250 PE today: 24.1x Not cheap by any measure.
→ Historical full bear bottoms: PE 14x to 16x.
→ March 2023 mid-cycle low: PE 16.9x. Not even that yet.
→ A 48% further fall in SC 250 is what gets PE to 14x to 16x.
3. THE OPPORTUNITY IS PROPORTIONALLY ENORMOUS.
→ Every Indian smallcap bear since 2003 gave +400% to +420%
in the subsequent bull cycle.
→ The investors who will look back at 2027 to 2028
the way veterans look back at 2008 and 2020
are building their war chest right now. Not deploying it.
━━━━━━━━━━━━━━━━━━━━━━━━━━━━━━━━━━━━━━━━━━━━━━━━━━━━━━━
🔥 THE VERDICT
The ratio is your map. Price is just noise.
When the SC 250 / Nifty 50 ratio reaches 0.36 to 0.48
and PE falls to 14x to 16x,
that is not a danger zone.
That is the launch pad for the next +400% bull cycle.
It has produced that outcome three times since 2003.
Three times. Without exception.
We are at ratio 0.63 and PE 25.6x today.
The gap between here and there is your preparation window.
---
What I find genuinely fascinating about this:
The market is a machine that transfers wealth
from the impatient to the patient in every single cycle.
Not sometimes. Every cycle. Without exception.
And the ratio is the most precise measure of exactly
how much patience is still required.
---
The tide is turning.
Not with crashing waves.
The way tides always turn.
Your only job is to have your bucket ready
when the tide goes out completely.
---
💬 ONE QUESTION FOR THE COMMENTS:
March 2023 bottomed at ratio ~0.50 and PE ~16.9x
and immediately launched an 18-month bull run.
Is there a scenario where this cycle also bottoms
at ratio 0.50 to 0.55 rather than 0.36 to 0.40?
Or does the starting point of 0.75 demand
a full reset to the 0.32 to 0.36 band?
I have a view. I want to hear yours.
---
If you tracked the ratio, cross-referenced the PE,
and understood the arithmetic most people avoid,
you are operating at a level of structural analysis
that the majority of market participants never reach.
The market does not reward prediction.
It rewards positioning.
You are now positioned to think about it correctly.
━━━━━━━━━━━━━━━━━━━━━━━━━━━━━━━━━━━━━━━━━━━━━━━━━━━━━━━
📌 QUICK REFERENCE CARD
CURRENT STATUS (March 30, 2026)
→ Nifty 50: 22,331 (-15.3% from ATH 26,373)
→ SC 250: 14,288 (-23.5% from ATH 18,688)
→ SC 250 PE: 24.1x (target: 14x to 16x)
→ Ratio: 0.63 (target: 0.36 to 0.48)
RATIO WATCH ZONES (monthly closes only):
→ 0.55 to 0.60 Phase 2 deepening. First small lumpsum.
→ 0.45 to 0.54 Acceleration phase. Active accumulation.
→ 0.36 to 0.44 Capitulation. Maximum aggression. Deploy all.
→ 0.32 to 0.36 Deep bear band. Crisis level. Rare.
NAV ALERTS TO SET NOW:
→ Rs 131 | Rs 112 | Rs 99 | Rs 81 | Rs 74
PE ALERTS TO SET NOW (indexpe.in/nifty-smallcap…):
→ PE 20x | PE 17x | PE 14x
MONITOR MONTHLY (not daily):
→ Ratio chart: NIFTYSMLCAP250/NIFTY on TradingView | 1M
→ PE tracker: indexpe.in/nifty-smallcap…
━━━━━━━━━━━━━━━━━━━━━━━━━━━━━━━━━━━━━━━━━━━━━━━━━━━━━━━
Not SEBI registered. Not investment advice.
Do your own research before investing.
All data from NSE, TradingView, Screener.in.
All scenarios are personal estimates only.
Recheck all numbers as they keep getting modified.
━━━━━━━━━━━━━━━━━━━━━━━━━━━━━━━━━━━━━━━━━━━━━━━━━━━━━━━
English
Market Wizard retweetledi

Something most traders never think about:
Execution is not one skill. It is six.
Opening minutes when it is volatile and active
Post opening range phase
The next 30 mins
Mid morning
Early afternoon
The close
Each phase behaves differently. Each needs a separate plan and a separate scan.
Using the same execution method throughout the day is where most traders end up missing the best opportunities the market offers.
The craft lives in this planning. Not in the 3 stock formula everyone is still searching for.
Latest workshop clip covers exactly this 👇
TradeTM@tradetm_org
IMPROVE EXECUTION IN THE FIRST 5–15 MINUTES Many traders who rely heavily on opening range trading often struggle with where to focus in the initial minutes of the trading day and how to avoid missing trades during this period. Poor execution in this window can mean missing out on the entire trading day. In this video, we discuss how we address this using procedural memory and live simulations of the first 5 to 15 minutes of the trading day. We also cover how we improve stock selection for the focus list during this period through feedback loops. This is a common challenge in the fintwit community, where everyone is searching for a mechanical formula to shrink a watchlist of 25–30 stocks down to just 3–5, hoping to pick only the stocks that will move the next day. Unfortunately, such magic formulas exist only for three kinds of people: God, an astrologer, or a liar. For the rest of us, there are no A=B type rules that can consistently identify the next day’s best movers. And this desperation is exactly what allows many snake oil salesmen thrive. That said, the focus list can be improved significantly through consistent feedback loops, by comparing your watchlist with what the market actually delivered. Over time, your chart-reading ability improves, and you start recognizing the characteristics that lead to high-probability setups. This is where the craft of trading comes into play, not just the rigid, rule-based approach that many keep searching for.
English
Market Wizard retweetledi
🌿Four Months After “The Book I Never Thought I’d Write🌿
When I first put this book out, I genuinely didn’t know what to expect. It was a collection of my own blogs and tweets which were anyway publicly available, so seeing it stay on Amazon’s Top Seller list for nearly a month was wild. For something I never intended to monetize, that response definitely caught me by surprise.
Since the launch, we have sold 700+ copies and generated ₹80,067. I am attaching the snapshot here for transparency. I am sharing the numbers because many of you didn’t just buy a book, you backed the intent behind it.
Writing books is actually a pretty bad ROI. After all the effort, the payout per book barely covers a decent lunch. If I were doing this for the margins, I’d have quit on day one. Stick to trading if you want to make money.
The story that actually matters: Out of that, ₹68,000 has already gone to Snehal in Mangalore for her medical degree tuition fees. Once she graduates and starts earning, she’ll be the one supporting her whole family. She and her family specifically asked me to thank everyone who bought the book and contributed to this.
Often, helping one strong family member stand on their feet creates more impact than spreading small help everywhere. You can see her story which RHA posted here: instagram.com/p/DSKqfMQiLwf/
RHA also asks students to contribute a portion themselves. It keeps things transparent and ensures skin in the game. The balance funds are yet to be withdrawn and utilized and I will keep it updated here.
I also want to thank @swing_ka_sultan, @iManasArora and @AnkurPatel59 . These guys stepped in purely out of goodwill and promoted the book for the intent behind it.
A special thanks to @finallynitin for compiling this for me. He was the ignition behind this entire project and the reason it exists in the first place.
A quick update on the book itself: The unexpected surge in demand meant the publisher had to move quickly to keep up, and in that process of scaling, the output quality of the charts and images wasn't where it needed to be. I am pausing sales for now to ensure every copy meets the standard I want for you. I will bring it back once we have refined the production and I have added some new insights from a few months of fresh writing.
The book is taking a break, but the writing won't. My weekend blogs will resume soon. Every new edition will be used to fund such further education and health-related causes.
I didn't expect the random twitter rants to turn into this, but I'm glad it did. Thanks for being part of the journey...


Anuragg Venkatakrishnan@Anuragg_CA
🌿 The Book I Never Thought I'd Write 🌿 This book was never planned. It wasn't an idea or a dream; it started as scattered tweets and reflections I wrote just for myself, little lessons along the way. Then, something truly unexpected happened. @finallynitin took the initiative to compile all my existing blogs and writings into a single book format using AI, just to show me the potential. I didn't take it seriously at first. But when we saw the initial version, the response was overwhelming, and that spark grew into this project. For his vision in compiling my work, I'll always be deeply grateful. Through this journey, I leaned on @iManasArora , my mentor. His wisdom has been an anchor in how I think, learn, and grow. And @swing_ka_sultan, my brother and partner, has been both mirror and compass. A big part of this book carries his spirit too. But above all, this book belongs to my father. He always urged me to write. For years I resisted. When I finally did, I discovered I loved it. Every single line I have written carries him inside it. This book is my way of keeping him alive in words. The Heart of the Offering Those outside the financial world often ask me, "What do traders really contribute to the world?" This is my answer. 💙 100% of the proceeds from this book will go towards healthcare and education. This isn't about profit; it's about channeling my work into a small, meaningful act of giving back. To keep our commitment honest, I will share regular updates here on exactly how much is raised and where it is directed. I want you to know how your support is directly touching lives. My hope is that every copy of this book becomes a beautiful act of kindness. When I first wrote, it was only for myself. Now I will write for others too, for anyone who may find help, hope, or a spark of knowledge in these pages. And this won't stop with one book. I will keep writing and sharing. How Can You Join the Journey The book is now available: 📖 Notion Press - bit.ly/3KAyIA9 📖 Amazon India - bit.ly/4gMsfy4 📖Flipkart - bit.ly/4pPH4Ef 📖Amazon International - bit.ly/4mGo4VX 📖Amazon UK - bit.ly/4mIP07m Ordering directly from Notion Press means a larger share of the proceeds can go towards the causes I’ve mentioned, since platforms like Amazon and Flipkart keep a significant portion. They may take a little longer to deliver, but I’ll leave that choice entirely to you. Every copy, whichever way you buy it, still means the world to me. And when you do order, I’d love it if you could drop a comment here and add a review to where you bought it from or maybe even share a snap when your copy arrives. Seeing those moments will keep me inspired to continue this journey. And most of all, thank you. I wouldn't have written a single word without you. Your presence, your questions, your encouragement... they gave me the courage to share. In many ways, this book is as much yours as it is mine. ❤️
English
Market Wizard retweetledi
Real trading often gets concealed behind good-looking charts and quotes. @markminervini @Qullamaggie or @PradeepBonde would trade the same charts as you in the Indian markets, but their execution and post-trade analysis are what set them apart.
Here's what I learnt and did:
Why - I was disappointed with my performance in 2020. By sticking to an 8% stop-loss limit, it reduced my starter position size significantly. Additionally, partially selling into strength left me with single-digit positions that hardly impacted my portfolio.
What - MAE and MFE are two important ratios in post-analysis that can help optimize your stop-losses and exit strategies. MAE indicates the maximum amount of price movement against you during your trade, while MFE indicates the maximum amount of price movement in your favour during your trade.
For example, if you entered a trade at 100, and the price dropped to 97 before jumping back up to a high of 110, your MAE is 3 and your MFE is 10.
How - I went over all of my trades from 2020 and calculated for MAE and MFE. Then, I marked the points where I got in, set my stop loss, and made my exits on 5 min and daily timeframes.
Journal Insight - I noticed that more than 85% of the times, if the price dropped below 3% of my buy price, it would hit my 8% stop loss. Even if I had set my stop loss at 3% instead of 8%, my win rate wouldn't have been any different. I realized that I had been taking on unnecessary risk by using a higher stop loss percentage or entering breakouts too late.
Most of my big winners were both risk-free and profitable immediately. This was not because the chart looked better than the others (in fact, it was often my least hopeful trade), but rather because of favourable market forces. However, I couldn't trail with a large position size to have a sizable impact on my portfolio.
My Improvements on SL
• My average stop loss (SL) ranges between 1% - 2.5%. I use a higher SL (max 4%) depending on the WHY of the trade like IPOs or earnings BO, or for lower priced stocks (
English
Market Wizard retweetledi
How a Small Tweak Can Turn Breakeven into Super Performance
Most traders try to optimize their setups when results don’t go their way. They assume changing the setup will fix performance.
But the setup is rarely the real problem. The issue is a lack of understanding of the second-order effects of their decisions.
This is where data analysis helps. By creating different scenarios, you can see how small changes impact performance, and what trade-offs come with them.
In our August cohort, we worked with a trader managing a $1M US portfolio, with a $250K allocation for short-term trading. After 500+ trades in CY25, he was almost breakeven.
We suggested a few simple tweaks and asked him to analyze his own data. We asked him to use uniform position sizing and cap losses at -2% to control risk. To assess the impact on win rate, we also asked him to run an MAE analysis.
The results were striking. With just these adjustments, his performance would have shifted from -$15K to +$347K, roughly 138% on the portfolio. With further refinements, it could have improved by another $50K.
Same trades, same setups, same entries, same post-entry management. But a completely different outcome.
The real edge lies in understanding what you’re doing, why you’re doing it, and how it impacts your results. Often, it’s not about big changes, but small, well-informed tweaks backed by data.
(There is a minor typo in one of the stats, which distorts a few others. However, it does not affect the overall conclusion of the exercise.)
English

Learning Post
100 Days Challenge PDF
I completed a 100 Days Challenge, and during this journey I used several stock setups. I’ve created a simple and useful PDF explaining all the setups I used.
If you want the PDF:
FOLLOW, LIKE, RETWEET, and COMMENT #PDF
I’ll send it to you via DM.
English