Mayank Bajpai

4.3K posts

Mayank Bajpai banner
Mayank Bajpai

Mayank Bajpai

@Maybajpa

IIIT-B I Individual Investor I Investing Enthusiast | AI & ML GenAI Specialist I share are not intended as buy or sell signals | RTF Framework

India Katılım Haziran 2023
205 Takip Edilen3K Takipçiler
Sabitlenmiş Tweet
Mayank Bajpai
Mayank Bajpai@Maybajpa·
Hi folks! You can access YouTube videos related to the RRG Chart for self-learning using the link below. If you wish to subscribe to the Strike Platform with a 10% discount, please use the following link: Keep learning and keep enhancing your skills! web.strike.money/signup?referra… @RRGInsights/videos" target="_blank" rel="nofollow noopener">youtube.com/@RRGInsights/v…
English
2
3
28
23.2K
Mayank Bajpai
Mayank Bajpai@Maybajpa·
One subscription I'm always happy to keep is StockScans. It's been amazing to watch how the platform has evolved since the very beginning. Looking forward to seeing what comes next! @stockscansin
English
1
1
16
941
Mayank Bajpai
Mayank Bajpai@Maybajpa·
Great nudge, learn to use both. March 2020 shows why I still keep RSI alongside it, at the crash low, trailing PE was only ~17 not "screaming cheap" even though the market had fallen ~38%. Then as lockdown-quarter earnings collapsed, trailing PE ballooned to ~40 by early 2021 and screamed "expensive," while the market kept climbing for another year. Trailing PE has a blind spot in earnings shocks the denominator breaks exactly when you need it most. That's where momentum tools like RSI stay useful instead. Valuation and momentum cover different failure modes. I'd rather use both than pick one. 🙌
English
0
0
2
62
Jay Singh
Jay Singh@Swiing_Sense·
@Maybajpa Nope, learn how rsi works, it have nothing to do with reversal, instead plot the PE ratio of nifty 500 and it will be a much better indication of reversal.
English
1
0
0
73
Mayank Bajpai
Mayank Bajpai@Maybajpa·
Can the Monthly RSI help identify major market extremes? Looking at the Nifty 500 over the past 20+ years, the answer is: surprisingly, yes. Major market peaks have typically formed when the Monthly RSI entered the 75-80+ zone, while major bear market bottoms have occurred when RSI approached the 30-40 zone. Since 2004: 🟢 Around 5 major overbought extremes 🔴 Around 4 major oversold extremes This doesn't tell you the exact top or bottom. It tells you when risk is increasing or when long-term opportunity is improving. That's how I like to use RSI: RSI >75 → Reduce aggression and review positions. RSI <35 → Start building a shopping list of quality stocks. RSI is a probability tool, not a prediction tool.
Mayank Bajpai tweet media
English
3
4
24
3.1K
Mayank Bajpai
Mayank Bajpai@Maybajpa·
@calmshank @rk_onkar @iManasArora That’s okay, I will not block you. At least I should appreciate that you took some time and commented/shared your question. Thank you for that!
English
1
0
0
52
Mayank Bajpai
Mayank Bajpai@Maybajpa·
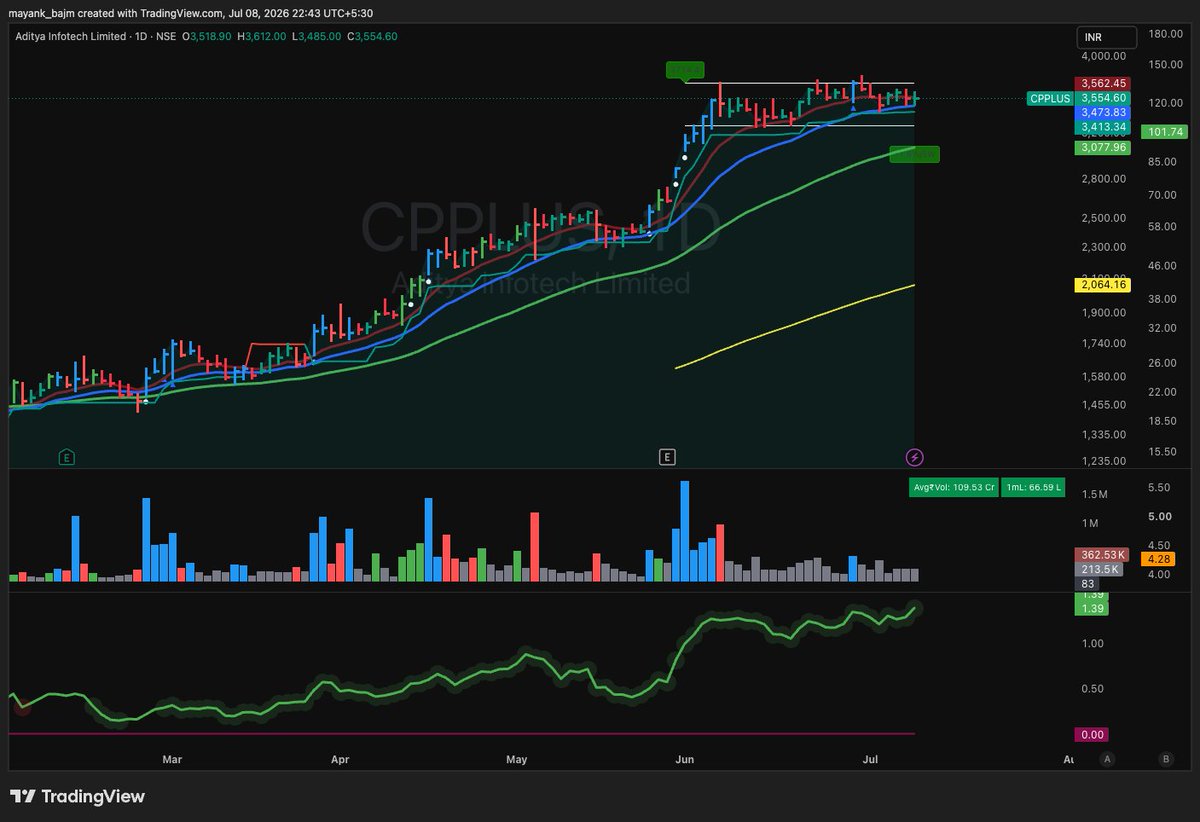
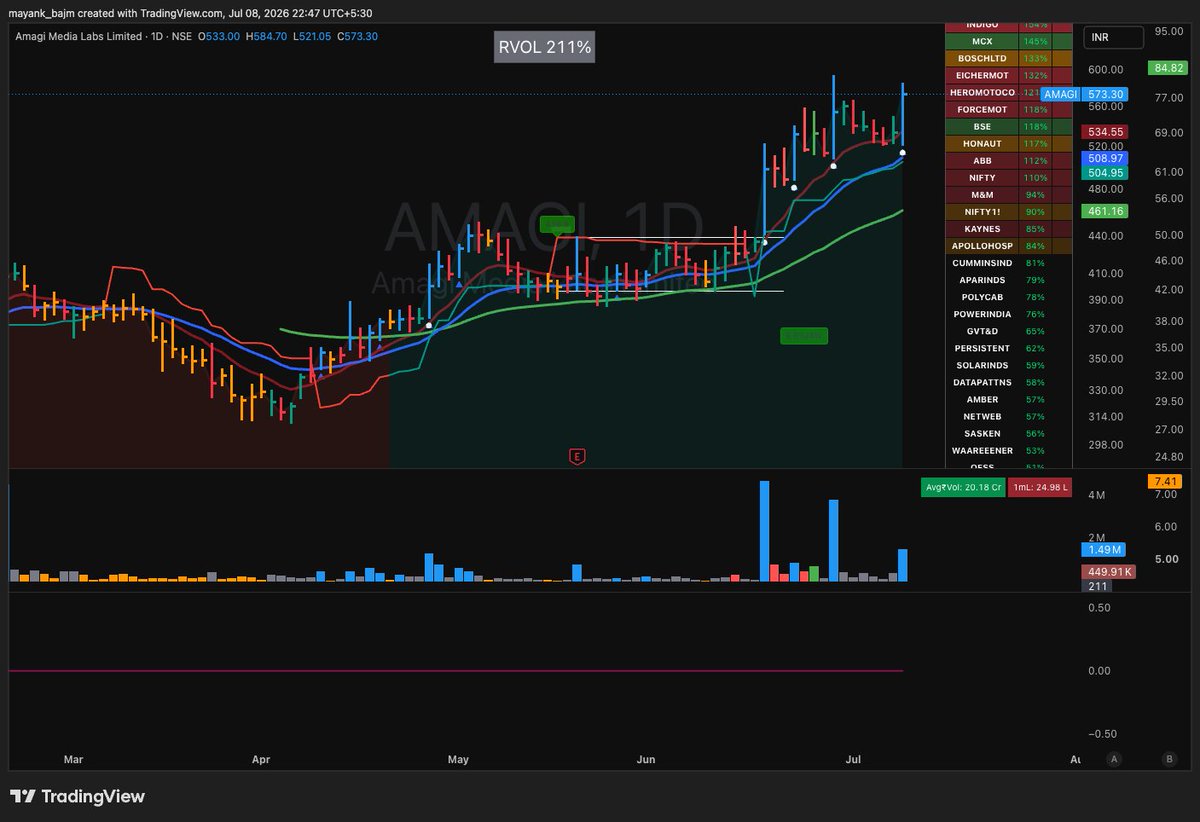
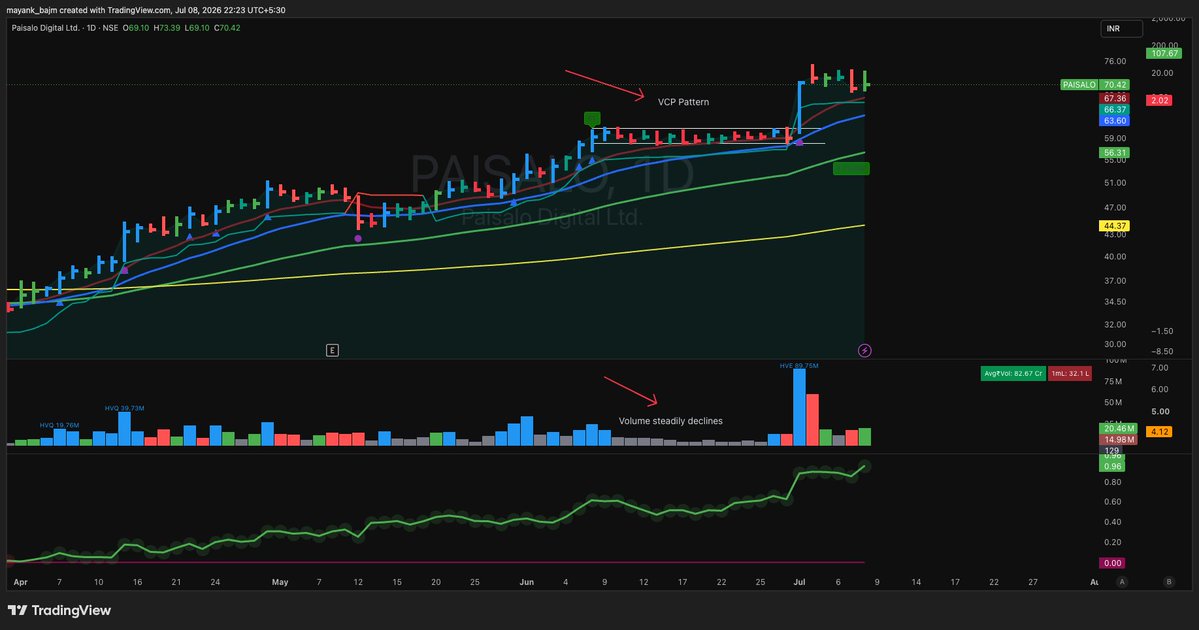
One thing I've learned from @iManasArora is this: when the broader market is under pressure, focus on the Net New Highs screener. The stocks making new highs despite a weak market often deserve a closer look, as they can be signaling underlying strength.
Mayank Bajpai tweet mediaMayank Bajpai tweet mediaMayank Bajpai tweet media
English
5
8
70
6.6K
Mayank Bajpai
Mayank Bajpai@Maybajpa·
@pranavrshah @iManasArora Hi Pranav, trust you are doing good. This is from the screening, you can directly build by using in the tradiningview.
Mayank Bajpai tweet media
English
0
0
5
335
Mayank Bajpai
Mayank Bajpai@Maybajpa·
There are three ways to create a custom Index, Pine script, manually adding multiple stocks in the tradinview and use any tool providers like @stockscansin. Please find the link to access the Pine Script for the equal-weight custom index. If you encounter any errors, try troubleshooting them using an LLM. Even the free tiers of models such as ChatGPT, Claude, or Gemini should be sufficient to help identify and resolve most issues. docs.google.com/document/d/1-s… I will try to find some time to cover these, but at the moment I am occupied with a number of professional commitments.
Rishi Shah@iamrishishah1

@Maybajpa Could you create a video demonstrating how to build a custom index and shortlist stocks for it? Since there can be many other stocks as well, I’d like to understand your selection process and how you build and track it. Request to make compete post or video on this topic. Thanks

English
1
0
13
1.9K
Mayank Bajpai
Mayank Bajpai@Maybajpa·
Di PIpes - Custome Index (Series) 🚨 Di Pipes/Saw Pipes index waking up +1.55% today, breaking out of a multi-month base (5,000 → 8,378 zone). But it's a one-stock rally: WELCORP +7.4% doing the heavy lifting. JINDALSAW, JAIBALAJI, ELECTCAST all flat/red. Catalysts driving WELCORP: 📦 Order book ₹25,350cr (all-time high), booked through FY28 🇺🇸 US data center + LNG buildout — 33-35% US mkt share in large-dia pipes 🇸🇦 Saudi plants commissioning by FY27-end 💰 Net cash, ROCE 22%+, FY27 guide: ₹20,000cr rev / ₹2,850cr EBITDA RS line vs Midcap400 still trending up but has cooled off its May peak momentum stretched near-term, structural story intact. Not a reco, just tracking the setup. 📊 Chart: @stockscansin
Mayank Bajpai tweet media
English
2
1
25
9.6K
Mayank Bajpai
Mayank Bajpai@Maybajpa·
I'd lean toward "partial position now, scale in as it confirms" rather than an all-or-nothing choice between "wait" and "buy now" especially for a story like Welspun where a meaningful chunk of the growth is already disclosed in the order book, not purely speculative. But this is a framework for thinking about the tradeoff, not a specific call on Welspun worth forming your own view on how much of the story you think is already priced in at current levels.
English
1
0
3
225
Anaya Dani
Anaya Dani@AnayaDani31·
Respected Sir, I had a small doubt. For companies like Welspun Corp, where a big trigger is yet to manifest, what is the right approach? Should we wait for the triggers to play out, or buy in advance knowing that by the time they are visible in earnings, the stock may already be trading at a much rich forward valuation? What are your views? Thank you!
English
2
0
2
346
Mayank Bajpai
Mayank Bajpai@Maybajpa·
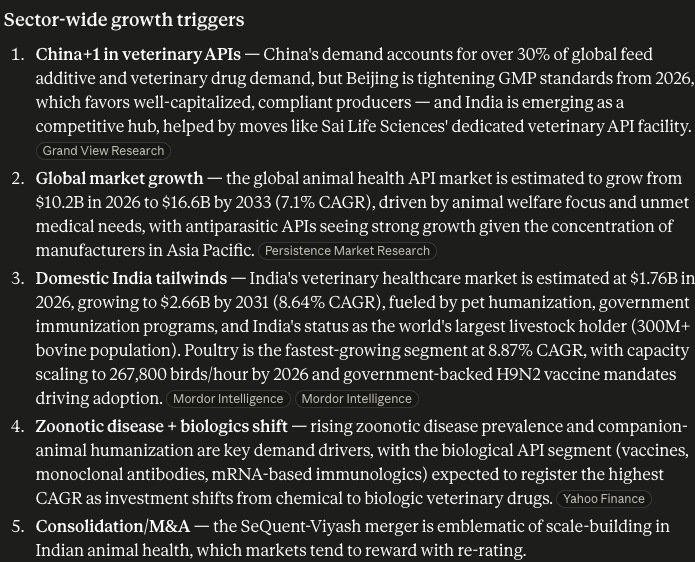
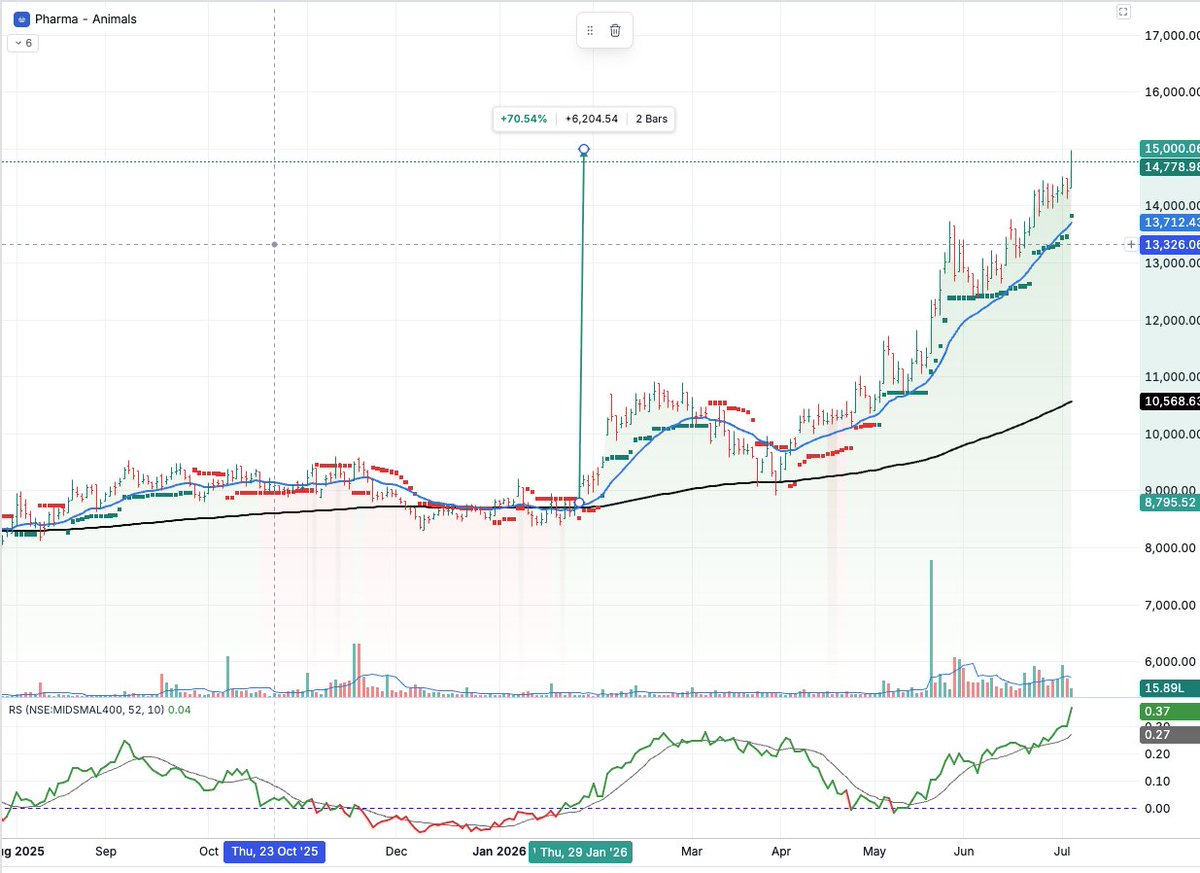
Pharma - Animal (Custom Index) 🐄💊 Pharma-Animals basket is on fire +70% since Jan NGLFINE just hit a fresh 52W high (₹3,260), up 150%+ in a year HESTERBIO riding poultry vaccine demand + doubling profits VIYASH/SeQuent merger building India's animal-health giant (₹8,000cr deal, 16 plants, 150+ export markets) Why: China tightening vet-API GMP rules → India becomes the China+1 hub. Global animal health API market → $16.6B by 2033. India's own vet healthcare market growing 8.6% CAGR. Sector story, not just stock story. 📈 Not investment advice, DYOR.
Mayank Bajpai tweet mediaMayank Bajpai tweet media
English
1
0
17
1.4K
Mayank Bajpai
Mayank Bajpai@Maybajpa·
Realty - National (Custom Index) Nifty Realty: brutal 2-year shakeout, now attempting a turn The index has seen 3 major drawdowns since its 2024 highs: 📉 ~11,700 → ~8,200 (Aug'24-Feb'25): -30% 📉 ~10,700 → ~9,000 (Jul'25-Sep'25): -16% 📉 ~10,700 → ~6,000 (Nov'25-Apr'26): -44% - the deepest cut of the cycle That final washout matches MOFSL's read: smaller developers got flushed out (new-launch participants down from ~3,500 to ~2,100), leaving fewer, stronger hands. Now: +33.6% off the Apr low, back above the 200-DMA, RS vs Midcap400 flipping positive for the first time since Nov. Early signs the tide is turning. Top picks per report: LODHA (+29% TP), ABREL (+39% TP), constructive on DLF, GPL, OBER. Not investment advice, DYOR 🧵
Mayank Bajpai tweet media
English
0
0
12
1.2K
Mayank Bajpai
Mayank Bajpai@Maybajpa·
Custom Index Series continues Recycle Theme Recycling Theme (custom index) another cycle turn in real time. Jan–Mar '26: grinding downtrend, below both EMAs, RS negative vs Midsmallcap 400. Late Mar: a sharp reversal day, index jumps and doesn't look back. Since then: 20 EMA crosses above 200 EMA, RS flips positive and stays there, index runs from ~8,000 to a high of ~11,750. Minor pullback in June (RS cooled off too), but it's already back near highs at 11,272, with both EMAs still rising underneath. Clean Stage 2 uptrend so far. Chart: @stockscansin
Mayank Bajpai tweet media
English
3
0
10
1K
Mayank Bajpai
Mayank Bajpai@Maybajpa·
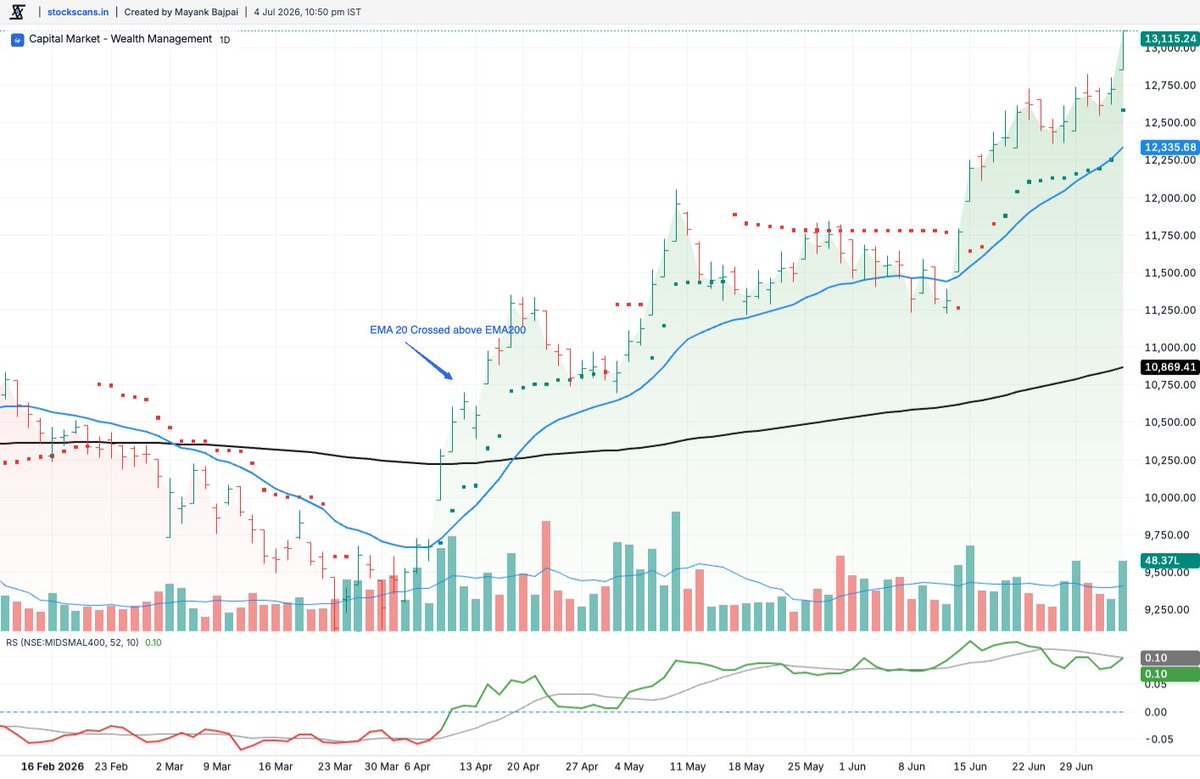
Capital Market – Wealth Management (custom index) is in a clean Stage 2 markup. 📈 20 EMA crossed above 200 EMA in mid-April '26 near the 10,300 zone - golden cross. Since then: 10,300 → 13,115 (+27%) RS vs Nifty Midsmallcap 400 turned positive at the same time and has stayed there consistent outperformance vs the broader mid/smallcap space. Chart: @stockscansin
Mayank Bajpai tweet media
English
2
7
50
12.6K