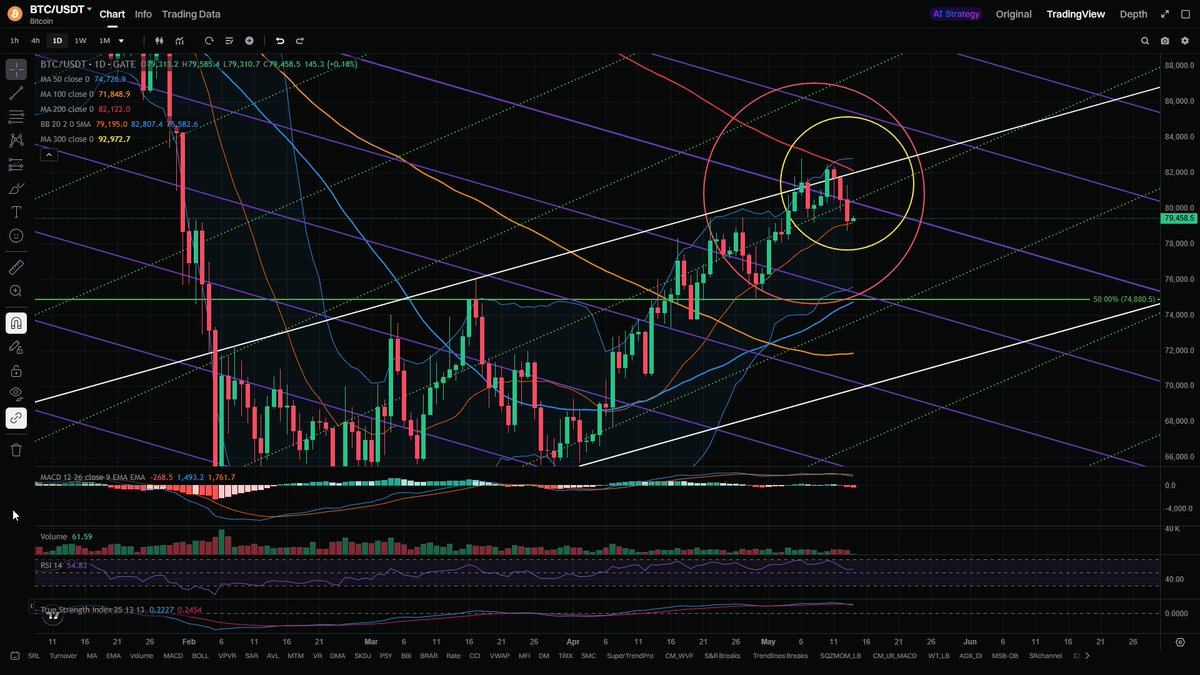
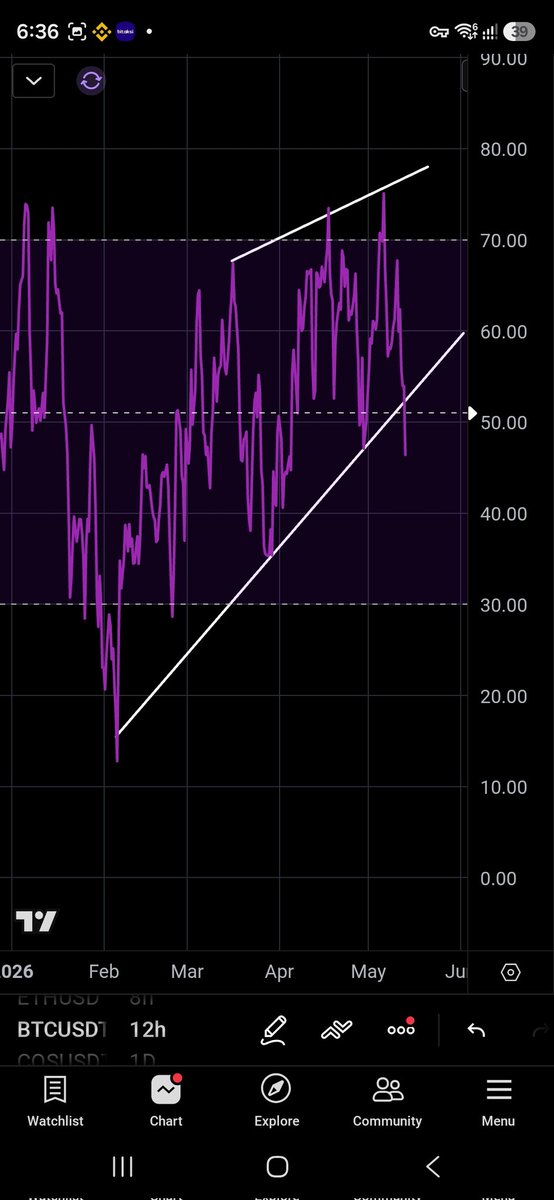
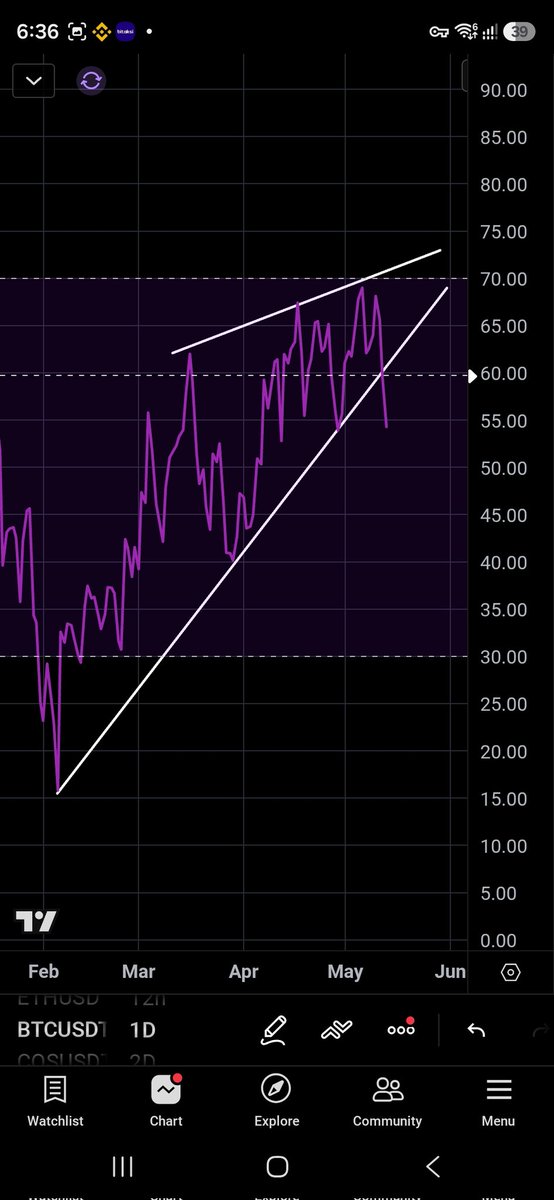
I had nothing much to do today so back to looking at some BTC charts and data points. I had this thought of all the major support/resistance line patterns. If there were anything related to the current price action and the previous data points. So what I did was just to draw up 5 parallel lines where support turned resistance or where resistance turned support. I just named them here as Major Trend 001-005. It draws points all way back to October 2023 but due to the screen size, I will show from April 2024 onwards. It is really interesting to see the lines converges with the price actions 1 year ahead. As random as the movements are, we able to see some order in the overall movement. Its like decoding the matrix. Not only it is respecting these trend lines but it is also moving along with the Fibonacci Retracement levels. Coupled with more indicators such as the moving averages, RSI, TSI, Stoch RSI, MACD, we can probably figure out and narrow down the possibilities of the moves. Making it more "predictable". For instance at this moment today, if the MA50 breaks. 2 likely scenarios, a retest of lower Bollinger or the Major Trend 002 which also coincides with the 23.6% Fib levels. And if that is respected we could bounce and retest MA50 as resistance line. And if today, we could see breakout, prices could be retesting upper BB which coincides with 0.0% Fib levels. If anything, this 104k levels should be over by mid July 2025. Either BTC prices will trend lower to test Major Trend 001 or we will be moving towards Major Trend 003. All depends if prices respect or rejects Major Trend 002. All major indicators are showing weakness in buys. MACD and TSI continues to extend widening below signal and trending to cross below 0. Stoch RSI down. RSI hovering below 50. If daily RSI can hold 42 levels, we will be safe.