I'M INCREDIBLY STUPID, CAN'T READ, AND AM CONFUSED. HOLD ME.
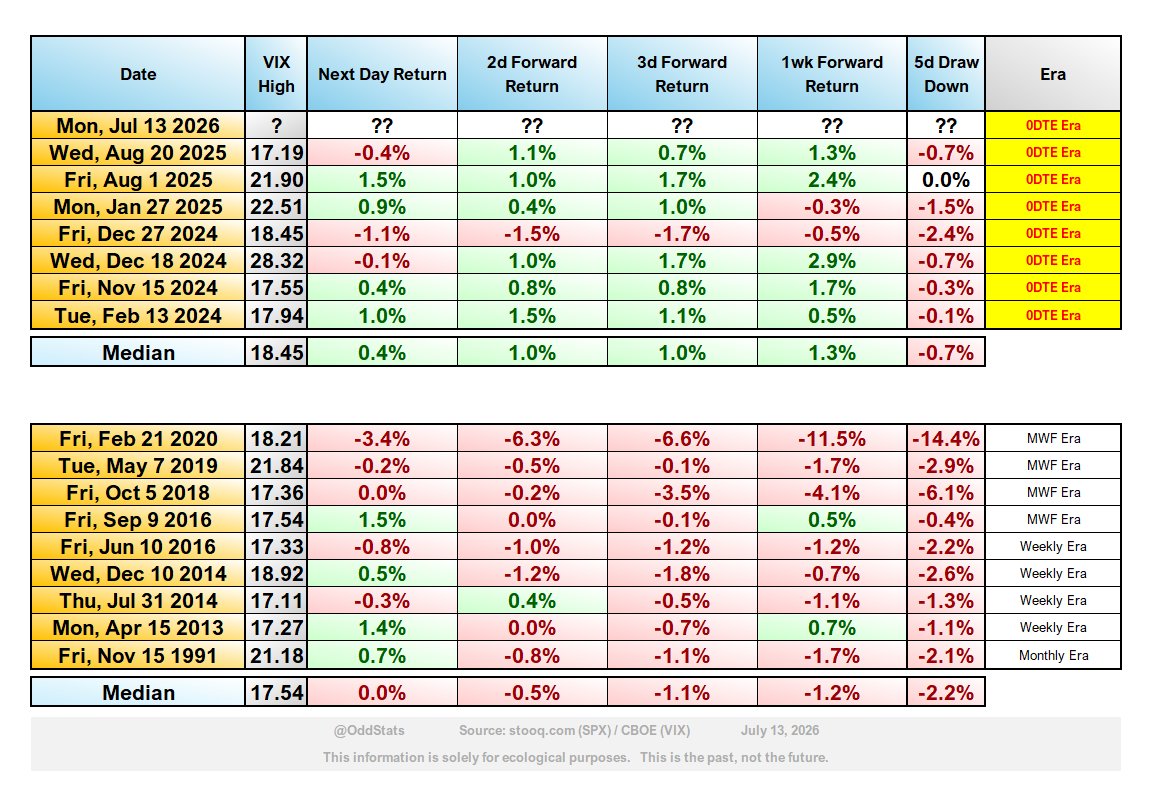
Sure, so...both tables show the exact same criteria. These are the forward returns and 5 day max draw downs after VIX goes from the 14s one day to the 17s the next (at any point during the day). Also, SPX must have been within 1% of all time high close on the day VIX was in the 14s, but is now more than 1% away from a new high.
Fucking incredibly, once we went to everyday 0DTEs, the entire outlook flipped entirely. The table before 0DTEs was a sea of fucking red, with negative forward returns and median draw downs for the next week over 2%.
But once 0DTEs kicked in? Baby, everything changed. Now the forward returns are a virtual sea of *green* and the draw downs over the next week were manageable instead of possibly terrifying.
There's not even really an edge here, I just posted this because it's the single most stark difference I've seen yet between options eras. It's hard to argue things didn't change tremendously.
What a difference an era makes.
Both tables below show the same things changing within a day:
▪ VIX goes from the 14s to the 17s
▪ SPX goes from within 1% of a new ATH close to more-than-1% away
So what's the difference?
Top table is just the 0DTE era.
Bottom is before.
Unless SPX somehow closes above 7580.06 today, we'll have a negative June.
June's direction has matched the direction of the entire calendar year for 9 of the past 10 years.
Only 2018 saw them go in different directions; positive June/negative year.