
Sabitlenmiş Tweet
The_JD
2.2K posts


The_JD
@Montu1774
Government Teacher By Profession #Codeviserian To Be @ViruPandey81 Trading Mentor, Winner of @Codeviser free live session dt-11/04/2022...😍
Gujarat Katılım Nisan 2022
34 Takip Edilen62 Takipçiler


🔸SBI FUNDS IPO
What pathetic listing 🥲🥲
Just +6% gains
Totally unexpected 🤡
unbelievable volume first up. itni kya jaldi thi bhai sell karne ki 😅
But have bought more in pre open,
let's see how it goes!! ✅
I am in no hurry for anything, watching with comfort.
🔸Alpine Texworld
Lists flat
🔸Millworks SME
Lists at +90% ✅🔥
conratulations to allotment receivers here 💐
#IPOAlert
English

8th Day of Learning:-
Current Ratio
The Current Ratio measures a company’s ability to pay its short-term liabilities using its short-term assets.
Definition:-
Current Ratio = Current Assets ÷ Current Liabilities
Easy example:-
* Current Assets = ₹200 crore
* Current Liabilities = ₹100 crore
Current Ratio = 200 ÷ 100 = 2.0
This means the company has ₹2 of current assets to pay every ₹1 of short-term liabilities.
Why is the Current Ratio important?
* Shows the company’s short-term financial strength.
* Indicates whether it can pay bills, suppliers, and other obligations due within one year.
* A healthy current ratio reduces the risk of liquidity problems.
What is a good Current Ratio?
* 1.5 – 2.5 → Excellent ⭐⭐⭐⭐⭐
* 1.2 – 1.5 → Good ⭐⭐⭐⭐
* 1.0 – 1.2 → Acceptable ⭐⭐⭐
* Below 1.0 → Warning sign ⚠️ (the company may struggle to meet short-term obligations)
Important point:-
A very high Current Ratio (above 3) isn’t always a good sign. It can indicate the company is holding too much idle cash or inventory instead of using its assets efficiently.
Rule for long-term investing
Look for companies with:
* ✅ Current Ratio above 1.5
* ✅ Low Debt-to-Equity (D/E) Ratio
* ✅ Strong ROE and ROCE
* ✅ Consistent sales and profit growth
Simple way to remember:-
* Current Ratio > 1 = Company can generally pay its short-term debts.
* Current Ratio < 1 = Company may face short-term liquidity issues.
* Current Ratio around 2 = Often considered a healthy balance.
The Trading Marvel®@TradingMarvel
7th Day of Learning Series….” Debt-to-Equity (D/E) Ratio The Debt-to-Equity (D/E) Ratio shows how much debt a company has compared to its shareholders’ equity. Definition: D/E Ratio = Total Debt ÷ Shareholders’ Equity Easy example: Total Debt = ₹50 crore Shareholders’ Equity = ₹100 crore D/E Ratio = 50 ÷ 100 = 0.5 This means the company has ₹0.50 of debt for every ₹1 of shareholders’ equity. Why is D/E Ratio important?: Shows whether a company depends heavily on borrowed money. Lower debt generally means lower financial risk. High debt can become a problem if profits fall or interest costs rise. What is a good D/E Ratio? 0 to 0.5 → Excellent ⭐⭐⭐⭐⭐ 0.5 to 1.0 → Good ⭐⭐⭐⭐ 1.0 to 2.0 → Acceptable, but analyze carefully ⭐⭐⭐ Above 2.0 → High risk; investigate the reason before investing ⚠️ Important note: Some industries naturally have higher debt, such as: Banks Infrastructure Power utilities Telecom So always compare the D/E ratio with companies in the same industry. Rule for long-term investing Look for companies with: ✅ D/E below 0.5 (where practical for the industry) ✅ ROE above 15% ✅ ROCE above 15% ✅ Consistent sales and profit growth ✅ Positive operating cash flow Simple way to remember: Low D/E = Lower financial risk High ROE = Better returns for shareholders High ROCE = Efficient use of total capital A company with low debt and high ROE/ROCE is often a stronger long-term investment candidate than one with high debt and similar profits.
English
🔸Lohia Corp IPO
- 1000 to 1100 Cr (tentative issue size)
🔸Xtranet Technologies IPO
- 166 Cr (confirmed issue size)
Both are slotted together,
closing on 27th July ✅ (Confirmed)
👉So, If by any chance,
Indo-MIM Ltd IPO is also slotted together with these 2 IPOs, it will be a TRIPLE THREAT Match on 27th July.
And what's the icing on the cake?
Indo-Mim expected issue size is 3500-4000 Cr 🤣 plus it's a good business.
Really excited,
WHAT IF this happens? 🤩
#IPOAlert
English
@weKFintech @investorniti I Smell something is Fishy in Your allotment process and too many people are believe exactly same.
Have fear of god 👍.
जय श्री राम 🙏🧿
English
Just to be sure,
👉 Is there anyone who applied SH Quota + SHNI/BHNI through ASBA
And got both? In SBI funds management IPO.
Anbody??
English
@investorniti Salo ne puri raar bethkar apne baapo ko allocation diya he...MC 🤬🤬🤬.
Indonesia
SBI Funds Management IPO
ALLOTMENT OUT ✅
Tell me friends, was all this worth it?
Did you get it or not? Comment 👇
Investorniti 🏆@investorniti
SBI Funds Management IPO 👉 Allotment Link : ipostatus.kfintech.com Tonight, This link is going generate 0.2g worth gold for many applicants. 😂 (Mera kfintech ka link sona ugle, ugle heere moti…) Save this link to glory ✅ #IPOAlert #sbifundsmanagementipo
English
@investorniti Bakvas allotment overall...only Shareholder working...other wise worst allocation.
Bc🤬🤬🤬🤬
@weKFintech bakvas registrar.
@weKFintech we didn't expect this shit From you.🤬
English

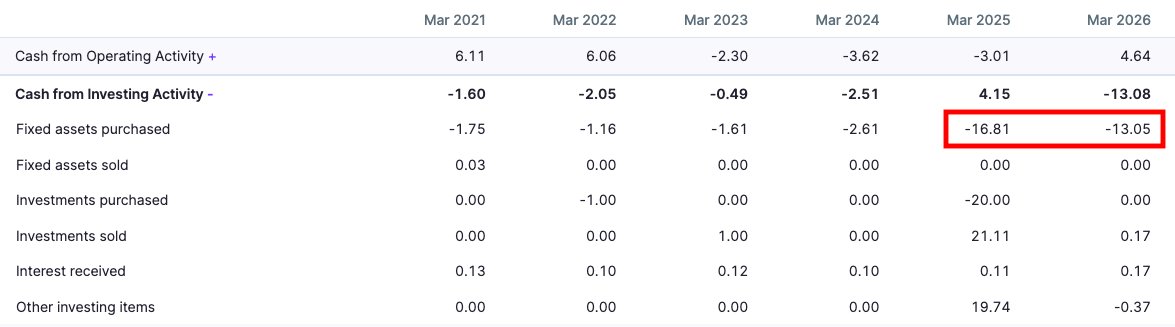
🚨 This is why I love tracking microcaps.
Current Market Cap: ₹45 Cr
But look at what the company has done quietly over the last 2 years:
✅ Purchased ₹25+ Cr worth of assets
✅ Trading at just ~20 PE
✅ Major capacity expansion underway
✅ Around 25% of revenue comes from exports
Think about it...
The company has invested more than 55% of its current market cap into building future growth.
If the new capacity gets utilized well and exports continue to grow, the next few years could look very different from the last few.
This is exactly the kind of setup I like researching before the market starts paying attention.
Not a buy/sell recommendation. Please do your own research.
#StockMarket #IndianStockMarket #MicroCap #SmallCaps #ValueInvesting #Investing #NSE #BSE #StocksToWatch #FundamentalAnalysis
English
@reachanandl समझमें नहीं आया आपने जो bh बोला लेकिन सुनके मजा आया...🤣🤣🤣
.
बोलो जय श्री राम 🙏🧿
हिन्दी

@Montu1774 Parenting?? My profile clearly mentions I'm not a Trader.
Tommorow if it doesn't do well he will come back and bad mouth you. This is what I see in X.
His responsibility he should take care.
If you keep comforting, Shree Ram will come and kick your butt 😀
English

@ArthKakadiya @reachanandl चलेगा भाई ...धैर्य रखना होगा... एक बार चलना शुरू किया उसके बाद सन पर ही रुकेगा...😉😉😉
.
जय श्री राम 🙏🧿
हिन्दी

@reachanandl Price action is not showing strength sur
Stock is not moving despite continuous good results. Holding patiently is what i am doing
English

@GuruShareMarket Ye bade IPOs me listing gain leke nikal jana chahiye coz badme sab hawa nikal jati he inke aur half price me milte he
हिन्दी

PREVIOUS LISTED IPO WITH SHAREHOLDER QUOTA AND GAINS 🚀
Bajaj Housing Finance
Listing Gain: 114%
Bharat Coking Coal (BCCL)
Listing Gain: 95%
Tata Technologies
Listing Gain: 139%
HDB Financial Services
Listing Gain: 12%
ICICI Prudential AMC
Listing Gain: 20%
How much listing gain does SBI FUND MANAGEMENT IPO deserves (Unlisted price ~₹850 per share & IPO price ~₹574)
English

Just my view and trade, Possible or I will get a loss?
Please answer
#nifty #indianstockmarket

English
@Asset_Architect Wait karte he to hath me nahi aata enter karte he to liquidity sweep ho jaati he...🤣🤣🤣
English

PPAP 340
Look at that massive wick.
380 pe liquidity leli aur price ko niche push kar diya. That is why i say “Wait for monthly or weekly price to close for confirmation”
If this goes down 6-7% here you will panic sell and then they will push prices back up.

Gnyanad Bhatt@Asset_Architect
PPAP Automotive | CMP: ₹323 🚗📈 One of the cleanest bullish charts in the auto ancillary space. After 7 long years, the stock has finally broken out of a massive symmetrical triangle. The bullish confirmations keep stacking up: ✅ 7-year triangle breakout ✅ Monthly Supertrend turns GREEN after 8 years ✅ OBV breakout showing strong accumulation ✅ RSI breakout confirming momentum ✅ High volumes over the last 2 months Business Overview PPAP Automotive manufactures plastic injection-moulded parts, interior & exterior automotive components, sealing systems and EV-related parts for major automobile OEMs. The company spent the last few years growing slowly, but the latest quarter suggests operating leverage is finally kicking in. Better capacity utilisation, an improving product mix and stronger demand have translated into a sharp jump in profitability. So I checked the business numbers… The company was largely flat for the last 7–8 quarters. Mute numbers. But the latest quarter changed everything. 📈 Revenue: ₹174.6 Cr • +18.6% YoY • +25.7% QoQ 💰 Net Profit: ₹45.5 Cr • ~18x YoY growth ( 2cr to 45cr ) • Massive turnaround QoQ This is exactly how multi-year stories begin. But…… “Remember, multi-year breakouts come with violent volatility.” Investors trapped for years will try to exit on every rally, so expect sharp intraday corrections along the way. How I’d play it: • Build a small trial position this week. • Add aggressively if the ₹290–300 retest holds in coming week if it ever comes. • Add more after a monthly close above ₹340—that would be the real confirmation. If the upcoming quarterly results are anywhere close to the previous quarter, I won’t be surprised to see this stock deliver a 200–300% move over the next 2 years.
English

Manipal Health Enterprises IPO 🔜
Size :
Fresh - 8,000 Crore
OFS - 4,32,27,668 Shares
Retail : 35%
FY23
Revenue : 4,927 Crore
PAT : 414.2 Crore
FY24
Revenue : 6,265.2 Crore
PAT : 533.2 Crore
FY25
Revenue : 8,362.8 Crore
PAT : 1,081.7 Crore
H1 FY26
Revenue : 4,809 Crore
PAT : 571.8 Crore
IPO Size : 9,000-10,000 Crore
Manipal is India's Largest Multispecialty hospital network by bed capacity (12,367 Beds) and the 2nd largest hospital chain by number of hospitals (48 Hospitals)
This should be a super Hot IPO 🔥
Likely to open in the last week of this month

English

Sometimes retail provide exit to institutions
Laser Power Bulk Deal :
NIPPON INDIA MUTUAL FUND
BUY 8,95,239 Qty At 260.98
BANK OF INDIA MUTUAL FUND
BUY 9,43,020 Qty At 263.36
BOFA SECURITIES EUROPE SA
BUY 9,00,000 Qty At 262.63
We sold.
English
Inflation : 6%
IPO day listing gain : 16%
No brainer to beat inflation.

English

Allotment Chances in SBI Fund Management IPO ⚡️
Retail: 3/7 (3 out of 7)
SHNI: 1/14 (1 out of 14)
BHNI: 1/5 (1 out of 5)
SH: 9.5x
- Those who applied 10 Lots or more in SH Category will get sure shot allotment of 1 lot. In fact 9 Lots should also ensure allotment due to possible cancellations of many applications
QIBs: 140x (₹2.48 Lakh Cr)
In total ₹2,97,850 have been Pumped in this IPO 🔥
#SBIFundManagement #SBIFundIPO
English