
MrBigNatural
691 posts
@SystematicPeter Thanks I’ve been trying to implement this. Do you use 200dma/40weekly as your regime filter for stock snd the broad market?
English

Starting traders usually try to go faster.
More screens.
More trades.
More signals.
More stress.
But speed is not automatically an edge.
Very often, it is just a faster way to overtrade, overfit and break your own rules.
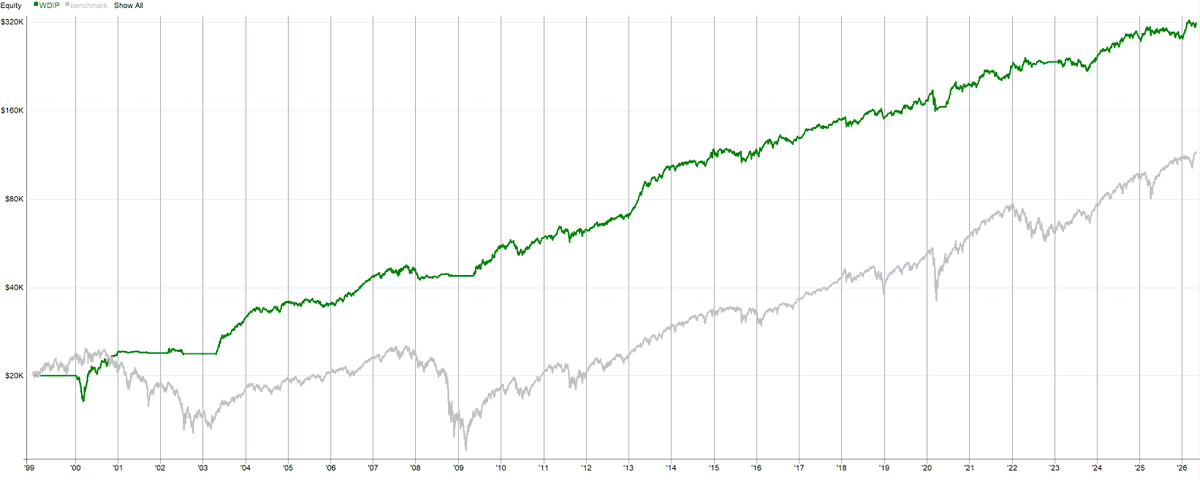
This green line is my weekly "buy the dip" model on S&P 500 stocks.
It trades once per week.
The logic is intentionally boring:
- Find stocks already in an uptrend
- Trade only when the broad market is also in an uptrend
- Define the dip on a weekly chart
- Check entries on Monday
- Manage the trade with SL/PT
Just a simple systematic process repeated over and over.
I like slower trading because it usually has a better chance of survival.
Fewer decisions to mess up.
Less noise to react to.
Less temptation to optimize the strategy into something fragile.
Of course, slow trading has drawbacks.
You usually do not want to run this type of model with leverage.
It will tie up a lot of capital.
Returns take patience.
It will not give you dopamine every morning.
But as a foundation, it makes a lot of sense.
Build the robust, boring portfolio first.
Then add faster and more advanced strategies on top.
Starting with speed often feels exciting.
Starting with robustness is usually smarter.
I track this model and its open positions in real time on my blog:
Live Trading Models / Buy the Dip (weekly)
Use it for inspiration.
English
@AlexArch @Yam_Trades @Norseman1 Would you mind sharing why you think specifically 5600 will come? Thanks!
English


Market just doesn't want to give an inch as the 5dma, 10dma (not touched for 14th session now), and the 21ema rise to catch up to Price.
English
@PKprivate18 Do we have much room left until we reach major upside zones? Where are the major upside zones now?
English
@SystematicPeter Thanks! Really cool. What is your trend context filter/how to design one that actually works?
English
April is a good reminder that a flat position is not the same as doing nothing.
My monthly rotational momentum model is fully out of Nasdaq stocks for April because the context filter says NDX is not in an uptrend. At the same time, the same model on TSX stocks is still risk-on.
Viewed in isolation, the Nasdaq model looks inactive.
Viewed as a portfolio, it is freeing capital that would normally be tied up in long Nasdaq positions and making it available for other edges.
In my case, that same capital can now be used by short-term strategies that tend to perform better in weaker market conditions.
This is why single-strategy thinking can be misleading. What looks inactive on one chart is often just portfolio rebalancing in action.
English
@PKprivate18 What are the current probabilities we see sub 6000 this year in ES?
English
@ZeeContrarian1 I’ve been wanting to start buying tech for long term portfolio, but many people are telling me not too. This post helps. Do you have any favorites in the mag 7 or in larger tech to accumulate and hold longer term? Thanks for any help!
English


@Norseman1 @grok @JP_Money_95630 Do you agree with the five listed from Grok? What would your list of five be?
English
Guess this ends this debate once and for all time. After years of debating it on forums.
Claude won’t touch it…lol.

English
@PKprivate18 Longer term what are the current probabilities that we go below 6000 ES?
English
@SystematicPeter 1. How do you rank stocks by momentum in this example?
2. Do you have any dividend growth strategies?
Thanks for the insight!
English
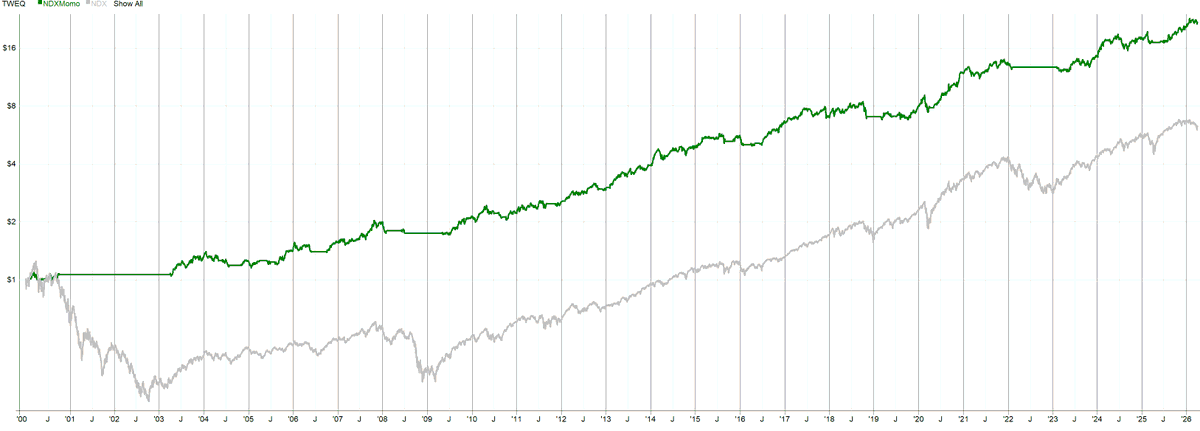
There is a reason I trust simple systematic models more than clever ones.
One of my "smart beta" sleeves is just US + Canada rotational momentum:
- rank stocks by momentum
- require a positive regime, like index > MA200
- once a month buy the strongest X names
- hold for 1 month
- size by volatility targeting
That is it.
No complex prediction.
No overengineered logic.
Just systematic exposure to effects that have worked for decades.
That is why I believe models like this have a real chance to keep working.
They lean on durable drivers, not on anomaly that disappears as soon as conditions change.
And this year has been a very good example.
The portfolio has meaningfully outperformed Nasdaq, helped in part by Canadian exposure to resources and gold.

English
@PKprivate18 Thank you! Please keep us posted when it’s a good time to add/initiate longterm positions!!
English
@PKprivate18 From a longer term perspective how low do you expect ES to go in 2026? Need to know for longer term positioning!!
English
@exposurerisk Thanks for the response! Why do you say each market has only one trend? How do you identify that trend objectively?
English

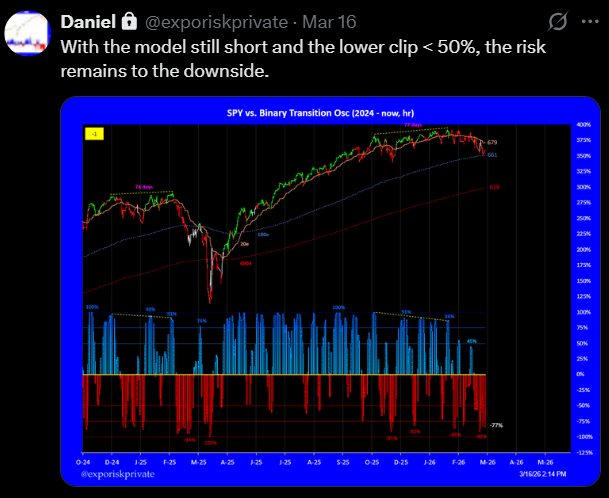
A reminder, we all live in a world of backfitting; the model stats are there to appease your emotions by making the user believe it makes sense to do whatever. The most important stat is in the historical returns; it is key to understand why the returns in the tails took place. Another red flag is the # models in use by some of these 🧙♂️🧙. There is only one trend per market; the less, the better.
MrBigNatural@MrBigNatural
@exposurerisk This is really cool. What is the performance of this model over time?
English
@exposurerisk This is really cool. What is the performance of this model over time?
English

@MrBigNatural I would go
50% $SCHD because you get dividend growth too
20% $GPIX which is 8% and doesn’t sacrifice growth
Then 30% of whatever dividend kings you like
$GPC $KO $O…whatever you feel good with
English
Any questions on stocks, options or dividends? Drop in the comments.
I’ll be on responding to every one for the next 30 mins
English
@DividendMil Just dividends that are safe and higher yielding!
English
@MrBigNatural Do I want growth too or am I only looking at dividends?
English
@PKprivate18 Thank you! Do you have any long term upside targets?
English
@TailThatWagsDog When using this options indicator on a daily chart, what options dates should we use for inputs?
English

Tue Dec 30 | 7:30 AM CDT
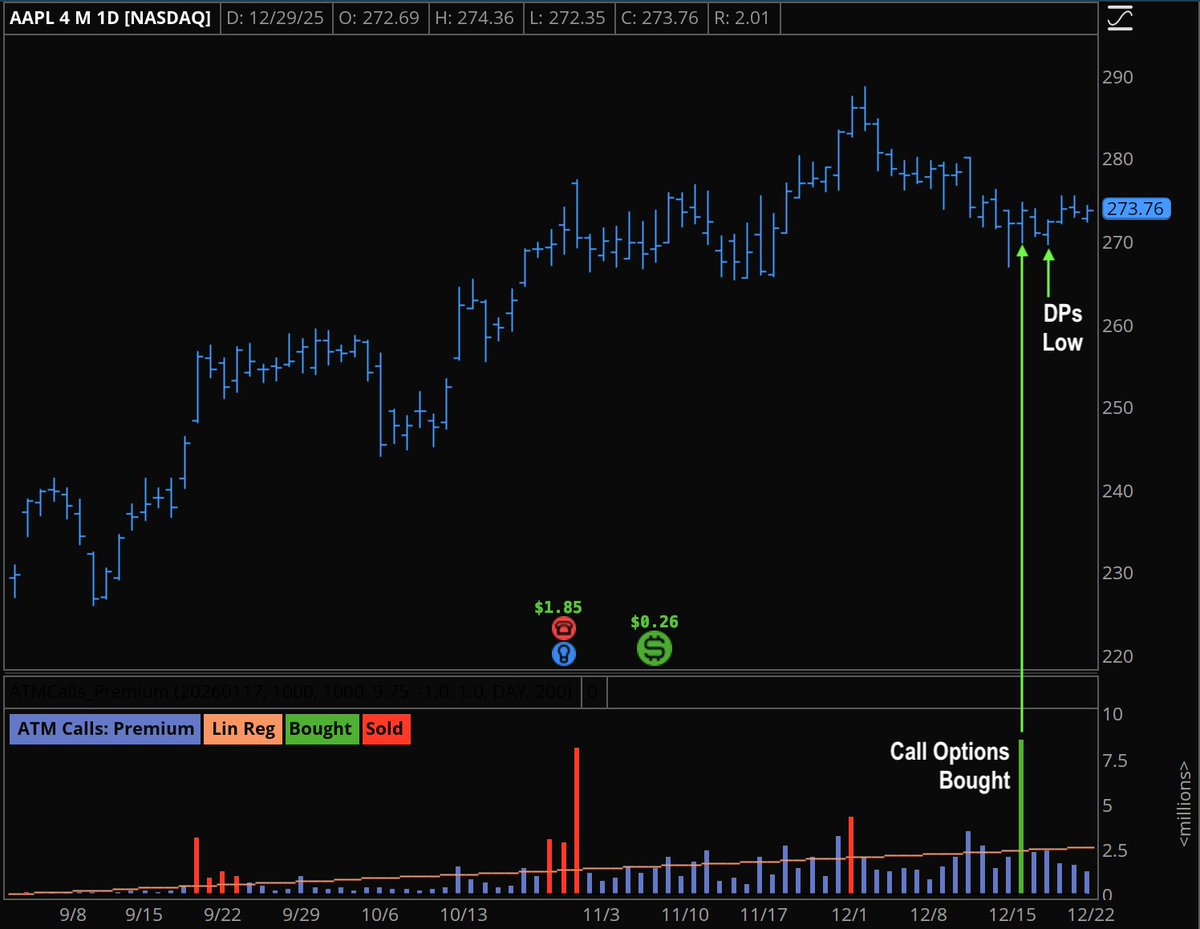
Strategy Example
THE SETUP
$AAPL in an uptrend.
Options traders and dark pools selling into strength.
>> $AAPL price pulls back to a key support level.
12/19 options traders buy long calls.
12/23 dark pools's selling exhausts, buying follows.
SUMMARY
Asset in uptrend >> retraces >> options/dark pools selling exhausts >> options/dark pools buying follows.
English
@PKprivate18 @gsizzlesauce Thanks! I was wondering if you had anything longer term though - like an overall range for 2026 or something like that
English