Peter - Cracking Markets

1.4K posts

Peter - Cracking Markets banner
Peter - Cracking Markets

Peter - Cracking Markets

@SystematicPeter

Systematic trader, fund manager. Web: https://t.co/Qga9clOPid

Katılım Ağustos 2022
94 Takip Edilen8.3K Takipçiler
Sabitlenmiş Tweet
Peter - Cracking Markets
Peter - Cracking Markets@SystematicPeter·
I’ve been trading for ~30 years. First half: fully discretionary, living inside futures microstructure. It worked—until algos started exploiting the same patterns and reacting in microseconds. Edge decay was real. So ~10 years ago I switched to systematic. Now I run many uncorrelated strategies in parallel without babysitting screens all day. I wouldn’t go back. My biggest unlock: reusability of know‐how. When I finish a new system, I plug it into a ready workflow in minutes. It monitors itself; I move my brain to the next big thing. Here’s the playbook I wish I had from day one: - Framework (design once → reuse forever) - Data → clean, feature, label. - Hypothesis → simple, testable edges (breakouts, momentum, mean reversion). - Validation → IS/OOS, realistic costs/slippage. - Risk → position sizing, max heat, portfolio exposure caps. - Deploy → automated orders, fail‐safes. - Monitor → health dashboards, kill‐switch rules, mobile app. - Iterate → new systems slot into the same pipeline. Principles that compound: - Many small, independent edges > one “genius” setup. - Process beats prediction. - Shipping beats perfecting. Discretionary taught me markets. Systems gave me scale.
English
21
31
490
52K
Peter - Cracking Markets
Peter - Cracking Markets@SystematicPeter·
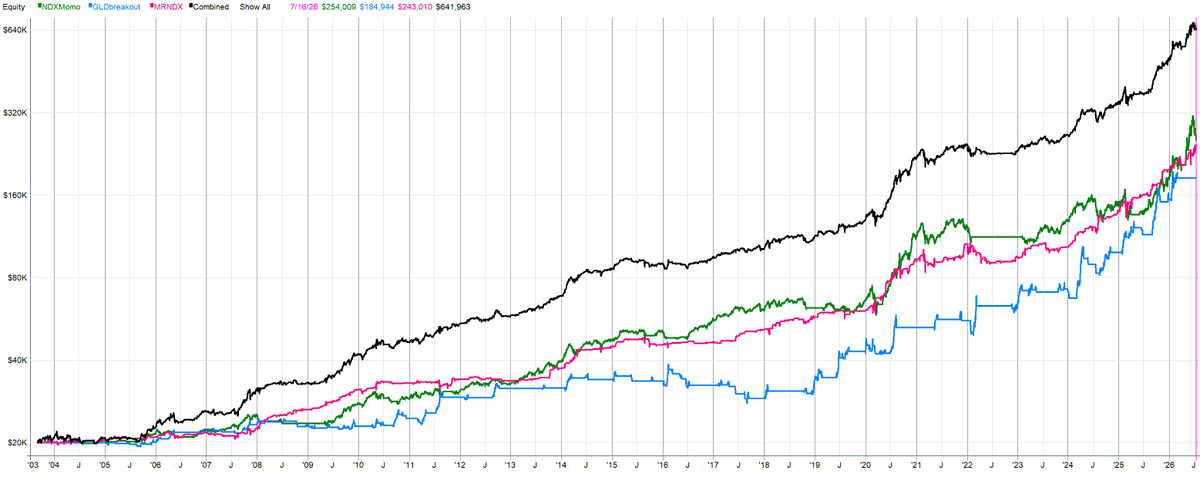
A portfolio doesn’t need every system to look impressive on its own. It needs their weak periods not to arrive together. In this 2003–2026 backtest, three simple systems turned $20,000 into $641,963: Green - NDX rotation momentum with volatility targeting; no price stop Red - buy-the-dip mean reversion; time stop Blue - long-only Donchian breakout on gold; trailing stop Black - the shared-capital portfolio This is diversification by trading logic, not just by market. The portfolio edge is not secrecy. Momentum and Donchian breakouts are simple, well-known ideas. I publish the complete buy-the-dip rules for free. What matters is how the systems interact. Sharpe: 1.31 Max drawdown: -14.5% Fees included The NDX rotation was tested on a survivorship-bias-free database. Average capital use was only 41%, leaving room to add genuinely different systems instead of adding more exposure to the same edge. No holy grail. Just simple tactics doing different jobs.
Peter - Cracking Markets tweet media
English
5
10
101
5.3K
Peter - Cracking Markets
Peter - Cracking Markets@SystematicPeter·
One of my best short diversifiers currently: An intraday volatility breakout. Short x*ATR from the open under specific conditions. Small stop or end-of-day exit. Fees included. Definitely worth exploring. Had the market tanked yesterday, this sleeve would have helped balance my long exposure. This is not just research. I trade it live.
Peter - Cracking Markets tweet media
English
4
4
49
3.7K
Ayush Talesara
Ayush Talesara@ayush_talesara·
@SystematicPeter But how do you do capital allocation between those sleeves? You can't be running 50/50 all the time right?
English
1
0
0
8
Peter - Cracking Markets
Peter - Cracking Markets@SystematicPeter·
Shorting stocks systematically is not easy. But after 2,196 live trades since June 2021, I am reasonably happy with this SHORT-only portfolio. Exported directly from IBKR: • Stocks and indices • 52% win rate • 1.16 profit factor • 0.69 Sharpe The portfolio internals are more interesting than the headline statistics. Since last fall: • Short mean reversion has been miserable • Short momentum has picked up across stocks and index breakout models Same lesson again: I never know which approach will work next. That is why I combine different short strategies instead of relying on one model. One sleeve struggles. Another carries the portfolio. The goal is not one perfect system. It is a portfolio of robust return drivers. Live results, not a backtest.
Peter - Cracking Markets tweet media
English
4
1
36
3K
Nova Drift
Nova Drift@nova_drift8·
@SystematicPeter Hey man like with all those trades and stuff you've managed to pull off how do you even begin to decide which strategy is gonna be the one to carry the portfolio next?
English
1
0
0
6
Antek
Antek@anteqkois·
@SystematicPeter I see that You use Nautilius I'm under heave development of platform - CFD, Futures, Prop, Prediciton Markets - Nautilius + vectorbt engines - deep Robustness Testing pipeline - ofc MCP and agent research 24h/7 - and many other idk if I would make this public, but maybe some day
Antek tweet mediaAntek tweet mediaAntek tweet mediaAntek tweet media
English
1
0
0
182
Peter - Cracking Markets
Peter - Cracking Markets@SystematicPeter·
AI has changed what “finished” means in my trading projects. A year ago, many projects stopped at “good enough.” The code worked. I could use it. But the tests, documentation, monitoring and structure around it were often incomplete. That made a tool useful today, but painful to maintain or extend six months later. The final 20% consumed most of the time and energy. Now I can take a useful prototype and finish it properly - turning it into robust infrastructure I can trust, maintain and build on. The data catalog in the screenshot is one example. The real change is that I can now build my own trading infrastructure to a standard that previously required more time than I could justify. And that compounds: every finished component becomes a durable building block for the next project. One workflow has improved the quality further: Claude Code builds. Codex audits. I do not want the same model writing the code and grading its own work.
Peter - Cracking Markets tweet media
English
4
2
19
2K
Peter - Cracking Markets
Peter - Cracking Markets@SystematicPeter·
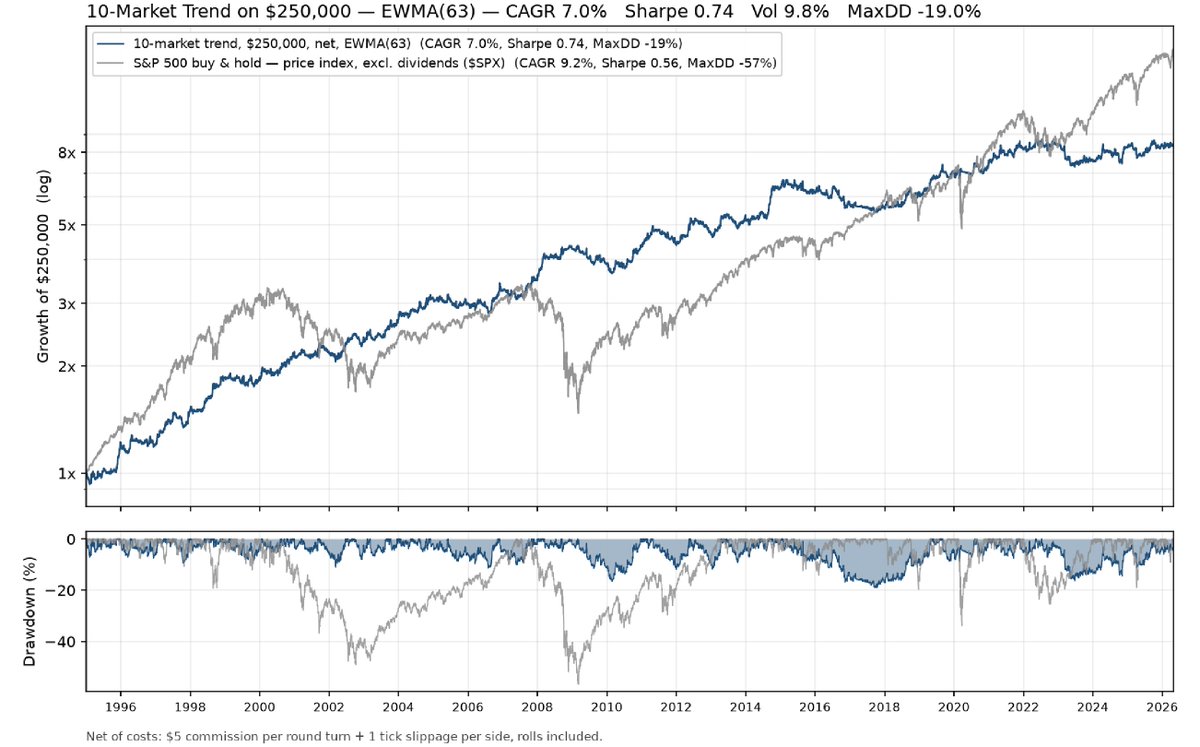
A diversifier does not need to beat the asset it diversifies. This 10-market trend backtest compounded at 7.0%, below the S&P 500 price index at 9.2%. Yet max drawdown was -19% instead of -57%, and Sharpe was higher: 0.74 vs 0.56. The 10 markets are selected automatically from a broader universe of 70+ futures markets. Most traders focus on the lower CAGR. I focus on the different return path. Most of my current systems trade stocks and indices. My next research project is a small futures trend sleeve, trading only a few markets at a time and potentially using long options on futures. The goal is not a mythical Sharpe 2. The goal is a capital-efficient sleeve that adds a different return driver to the portfolio. The screenshot shows an early-stage backtest, net of modeled costs. It is not live trading. DM me if you are working on the same problem and interested in collaborating.
Peter - Cracking Markets tweet media
English
3
0
26
2.3K
Peter - Cracking Markets
Peter - Cracking Markets@SystematicPeter·
I’m often asked how to start systematic trading. My answer: start doing it - slowly, with minimal risk. Forget the perfect strategy and complicated infrastructure. Start with stocks and a few simple principles: • Momentum • Long-only mean reversion • Conservative position sizing The harder question is: how do you do this practically? My suggestion is RealTest by Marsten Parker. I have no affiliation. Even during the trial, you get a useful collection of simple example systems that are easy to test and run. Its biggest advantage is that it is portfolio-oriented. You can evaluate several strategies together instead of becoming obsessed with one attractive equity curve. It also includes a simple execution tool, which makes the first step toward automation much easier. Combine it with Norgate Data and you have a clean research-to-execution workflow at a reasonable cost. The point is not to build the perfect system immediately. Start small. Trade simple rules. Learn how the full process behaves with real money and minimal risk.
Peter - Cracking Markets tweet media
English
5
9
120
8.2K
Shikumi Daily
Shikumi Daily@ShikumiDaily·
@SystematicPeter do you embed market regime based sleeve allocations in your system? or does each sleeve handle regime as part of its trading rules?
English
2
0
0
169
Peter - Cracking Markets
Peter - Cracking Markets@SystematicPeter·
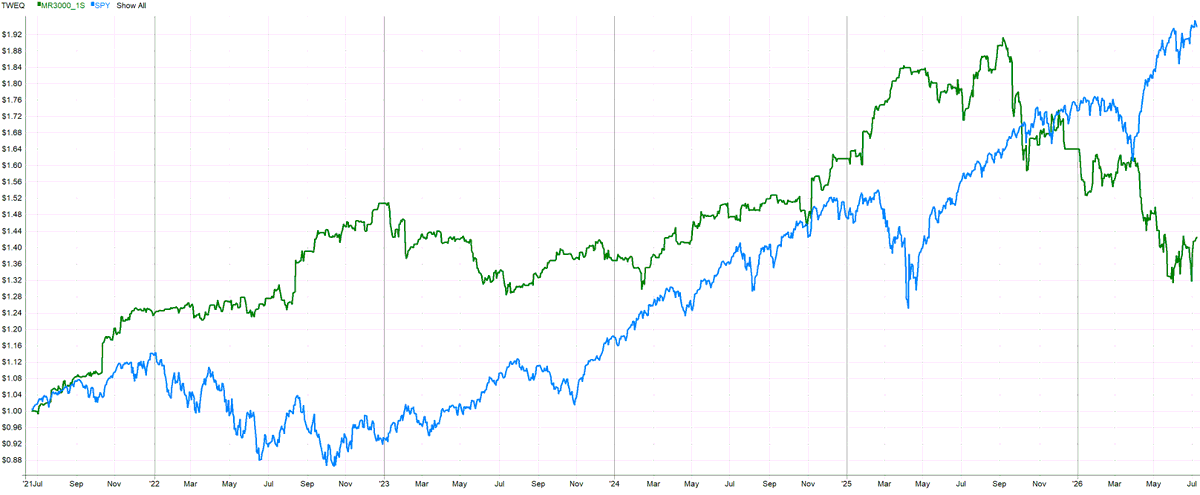
The weakest sleeve in my strategy mix lately: Short-side mean reversion on US stocks. This chart is not a backtest. These are my live IBKR fills, rescaled to a constant 10% allocation per account. A few observations: • It has not done much damage because the sleeve was small • I reduced the already small allocation further in early 2026 • The interesting part is not the loss itself • The interesting part is studying how market behavior changed This is why I prefer running strategies as sleeves. A weak strategy inside a diversified portfolio still gives useful information. A weak strategy as your whole portfolio is a problem. How are your short mean reversion models on US stocks doing this year?
Peter - Cracking Markets tweet media
English
9
4
45
4.6K
Peter - Cracking Markets
Peter - Cracking Markets@SystematicPeter·
Strong tip for intraday breakout traders: Don’t only test the entry logic. Test the instruments too. This is my volatility breakout systems that I share on the blog. Red = ETF version Black = slightly ITM 0DTE long option version Same core signal. Very different implementation. ETF/futures version: * needs more capital * more exposed to intraday noise *needs tight stop placement *no time decay 0DTE long option version: * capital required is mainly the option premium * risk is defined upfront *no stop used *different return path *but it must fight time decay The same signal can behave differently when expressed through a different instrument. ETF = stop-based risk control. 0DTE option = premium-defined risk, but constant time-decay pressure. Same idea. Different risk mechanics. Different failure modes. That is often where portfolio robustness improves when they are combined.
Peter - Cracking Markets tweet media
English
0
1
32
3K
SectorX
SectorX@SectorX_AI·
@SystematicPeter I guess there are brokers still charging commission. Not these fine folks... Fidelity, Schwab, Vanguard, Robinhood, E*TRADE, Webull. But they get their money somehow ;)
English
2
0
0
124
Peter - Cracking Markets
Peter - Cracking Markets@SystematicPeter·
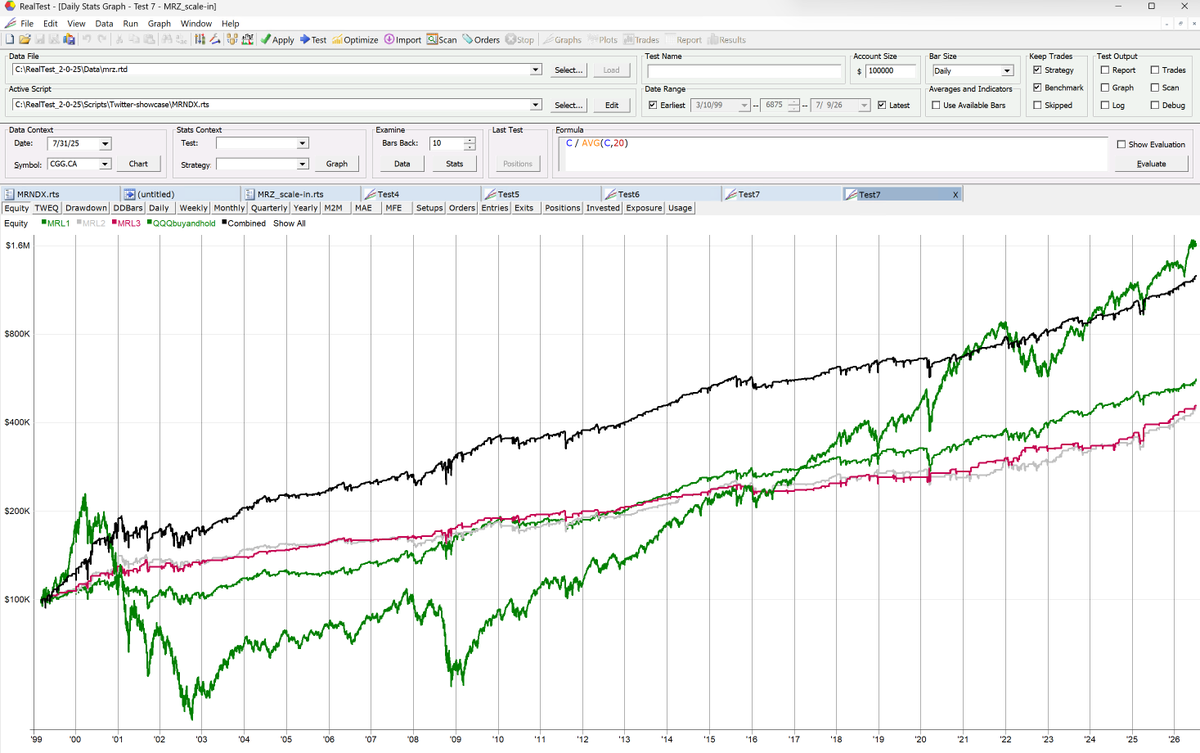
I’ve been trading for ~30 years. One mistake I see newer traders make over and over: They chase speed before robustness. Faster trading feels professional. More trades, more signals, more feedback. But live trading is where speed gets expensive: commissions, spreads, slippage, bad fills, data errors, execution delays. If fees + slippage would consume something like 1/3 of the backtest profit, the system has very little margin for normal backtest error. A small modelling mistake, data issue, or regime change can wipe out what looked like an edge. The chart shows a simple RSI long-dip strategy on stocks. Not daily. Weekly. Backtest: Net profit: $304,685 vs $76,502 benchmark SPY Max DD: -18.1% vs -54.4% Sharpe: 1.08 vs 0.42 Trades: 498 This is not exciting. That is the point. Slow, boring, lower-friction systems are often better candidates for a portfolio core. Then faster sleeves can be added carefully. Daily updates for inspiration: crackingmarkets.com/buy-the-dip-we…
Peter - Cracking Markets tweet media
English
5
3
77
5K
Peter - Cracking Markets
Peter - Cracking Markets@SystematicPeter·
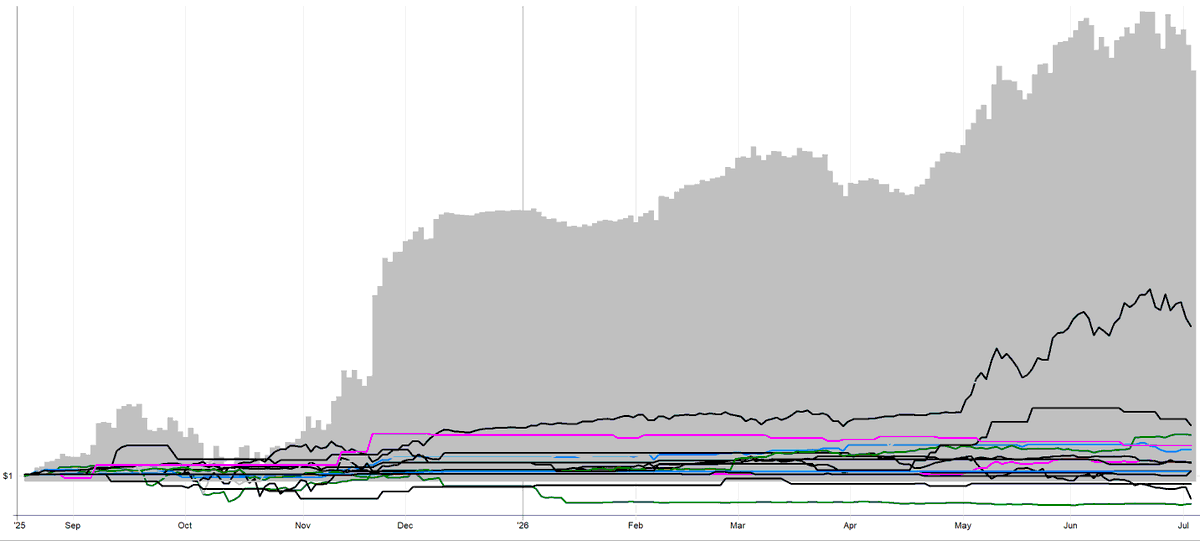
Your broker P&L curve is not a research tool. It is accounting. It tells you what happened to the account. It does not tell you why. And in trading, “why” is where the work starts. A broker equity curve does not show: * which system made money * which system lost money * whether live trades match the backtest * whether slippage matches assumptions * whether exits are doing their job * whether execution is quietly eating the edge That is why I like strategy-level diagnostics. The screenshot is from my own live account, but the equity curve is not the point. The workflow is. Gray = full portfolio Lines = individual systems This is live trading exported from Interactive Brokers into RealTest. From there I can compare each live system with its continuous backtest and test synthetic exits on actual live entries. That is where the useful questions start: * Is the edge decaying? * Or did the live account miss trades? * Are fills worse than modeled? * Is slippage a few ticks higher than expected? Same broker P&L curve. Very different conclusions. You can build this in Python. I use RealTest because it makes this debugging loop much faster than building the whole stack myself. Broker P&L answers: “What happened?” Strategy-level diagnostics answer: “Why did it happen?” That is the difference between watching a trading account and actually managing a systematic portfolio.
Peter - Cracking Markets tweet media
English
2
4
28
3.1K
Peter - Cracking Markets
Peter - Cracking Markets@SystematicPeter·
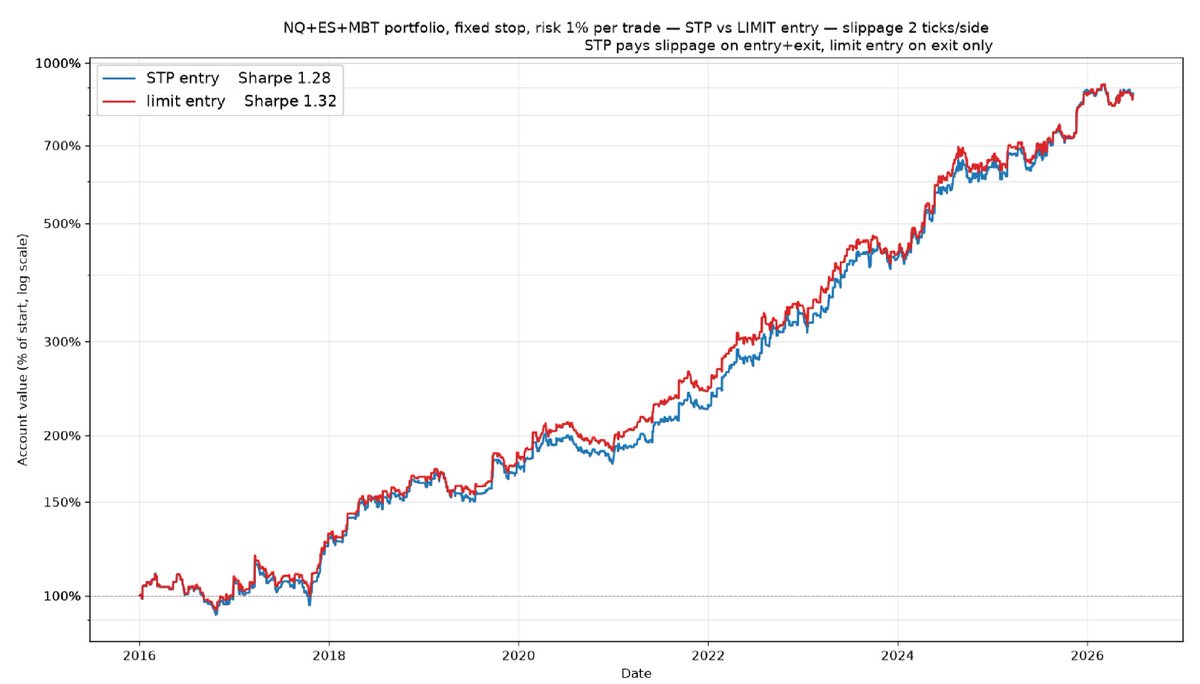
Most traders spend weeks optimizing breakout parameters. Very few test the actual entry mechanics. That is a mistake. In intraday trading, slippage can eat a large part of the edge, especially as size increases. This is a backtest of my intraday volatility breakout portfolio: NQ + ES + MBT Fixed stop 1% risk per trade 2 ticks/side slippage assumption Blue = stop entry on breakout Red = limit entry after breakout The stop entry is faster. But a stop order into rising volatility often means paying slippage exactly when the market is moving fastest. The limit version is slower. It enters during the first 1-minute bar after the breakout. The limit must trade through to count as filled. If not filled after 1 minute, the order is moved. So the trade-off is simple: Stop entry = earlier entry, worse price control Limit entry = later/missed entry, better price control The surprising part: Stop entry Sharpe: 1.28 Limit entry Sharpe: 1.32 Almost the same result. For intraday systems, execution logic is not an implementation detail. Order type, fill logic, slippage, and repricing rules are part of the strategy. And as size grows, they can materially affect strategy capacity.
Peter - Cracking Markets tweet media
English
1
4
36
4.3K