
Zimby
43 posts


To make myself perfectly clear: I am not assuming that this fractal will repeat proportionally like in the photo
It is merely an example of how the price action could unfold.
Tomorrow is the FOMC meeting, which means the final countdown has begun.
I will open a $1.5 million USD position at $60,000 and add another 5 Bitcoins for every additional $1,000 drop.
I expect a range of $58,000–$59,000, maybe a small wick under $58,000.
If we lose that zone, yes, we could theoretically see $52,000 in June, but that is very unlikely.
As I’ve already mentioned, July will bring a massive push that turns bears into bulls, only to punish them in August.
Meanwhile, around 840 days after the Bitcoin halving, we should see a flash crash toward September/October that forms the final bottom.
I’ve prepared you very well.
Now let’s see how this whole thing plays out.
FINAL COUNTDOWN ⌛️
XAPA@xapa03
Can we repeat the Fractal of 2022 for Bitcoin? It looks very similar! As you can see on this chart, we built a golden cross in June 2022, exactly like we did on 6.6 of June. Before 16. June / 17. June 2022, bitcoin started to pump only to dump on the 17. June 2022! So we could see a small pump before 16 / 17. of June 2026, exactly like 2022. 15.06.2022 we had our FOMC meeting! As i said in my previous post, that we always pumped in the FOMC Meetings, only to dump after it. If we repeat that fractal of 2022, Bitcoin should touch the 50k Area once again with a lower low. We don't need to repeat this fractal exactly! I am mainly interested in the push in July, the dump in August, and the final bottom in September/October. The final bottom is NOT in! I expect to build liquidity in July and trap late longs, onl to dump in August to our final bottom. (Sept. Oct.) Dont get confused, on the left side 2022 June we had also 17 % leg down, but 22% from the top of the FOMC. 17 % from the golden cross point, exactly like 2026! Interesting time for Bitcoin now 🔥🔥🔥 bitcoin:native
English
Every time Bitcoin hits the red zone, it marks our top.
We’re currently at 15.43 and still need to reach the level below 15.
As I said, we have the FOMC pivot coming up soon. Expect another push into the meeting, then we should hit the level below 15, see the dump, and prepare for the next major pump in July.

XAPA@xapa03
bitcoin:native Every time Bitcoin hits the red zone, it marks our local top. The first image is the 4-hour timeframe, very accurate. We are currently at 17.38 and still need to reach the level below 15. For an earlier overview, switch to the 3-hour chart: you can already see that we have touched the red box (2nd picture). It’s difficult to see clearly because I had to zoom in heavily, and it’s almost impossible to spot without a video. I marked it in yellow with the date.
English

#Bitcoin
If I'm being honest.... 95% of you are not meant for this.
Period!
English
1 hour later Bitcoin choose his direction, finally.
I expect a rejection around the $65,000 level, the resistance of our trendline, which I have already mentioned several times.
I will close this long hedge position in the area of the marked circles on the TEM chart.
If we do not touch it, i will keep my hedge long position.
I’ll be out, before Bitcoin touches the red zone.
If it does touch that zone, I will definitely max out my swing short position.
If we can not flip it, fake out's are happening many times & we sweep the 60k before higher 60k.


XAPA@xapa03
bitcoin:native Bitcoin is not strong enough to break the resistence at 63.800 $ Every attempt to break this price ended with a rejection. If we can not reclaim it, we will see prices below 60k again. On the second picture you can see, when Bitcoin hit's the red box, it is getting a hard rejection! That TEM is visible for you on 1H chart. (2. picture) The TEM on 4 hour is better for a HTF overview. (3. Picture) There you can see, that we reclaimed the light yellow box and we got a rejection at the dark yellow box. The resistence at the dark yellow box is the same resistence now like the red box (63.800$), which Bitcoin needs to break, to get higher prices or lower prices than 60k, once again. The last picture is the TEM on 1D Chart. You can see the circles, that should be our levels for now. Every circle you see act's as a resistence (if we break it, it will be a support). Level for level - best overview! Keep it easy! We are now in a hard "make it or break it" decision.
English
I've made mistakes in the past. Everyone has. 🙏
Growth in this space starts with being honest with yourself (humility) and recognizing your mistakes so you don't make them again (true growth).
I'm finally at peace, and I'm more focused NOW than EVER.
The next cycle will come, and when it does, I'll be perfectly positioned to build generational wealth.
I'm on a mission.
Mark my words! 🥂
#Bitcoin #Crypto #Altcoins #BearMarket
English
How low will #Bitcoin go?
Let me know, are you a buyer at these current levels ($60,800) or not? 🥂
English

$BTC - Long Trade Update
Got stopped out at breakeven overnight.
Thankfully, I already took 50% off the trade at +4.23% yesterday, so the trade still finished green overall.
Looking at the chart this morning, the first warning sign was the break below the symmetrical triangle support.
And the confirmaiton was when price rallied back into the trendline, failed to reclaim it, and got rejected.
Had I been awake for that retest, I likely would’ve closed the remainder of the position manually and reassessed from there.
Instead, price got rejected, swept the lows, and eventually tagged my breakeven stop.
Either way, this is why I like taking partial profits and moving my stop.
Worst case, I get taken out and keep some profits.
Best case, the trade keeps running and I’m still involved.
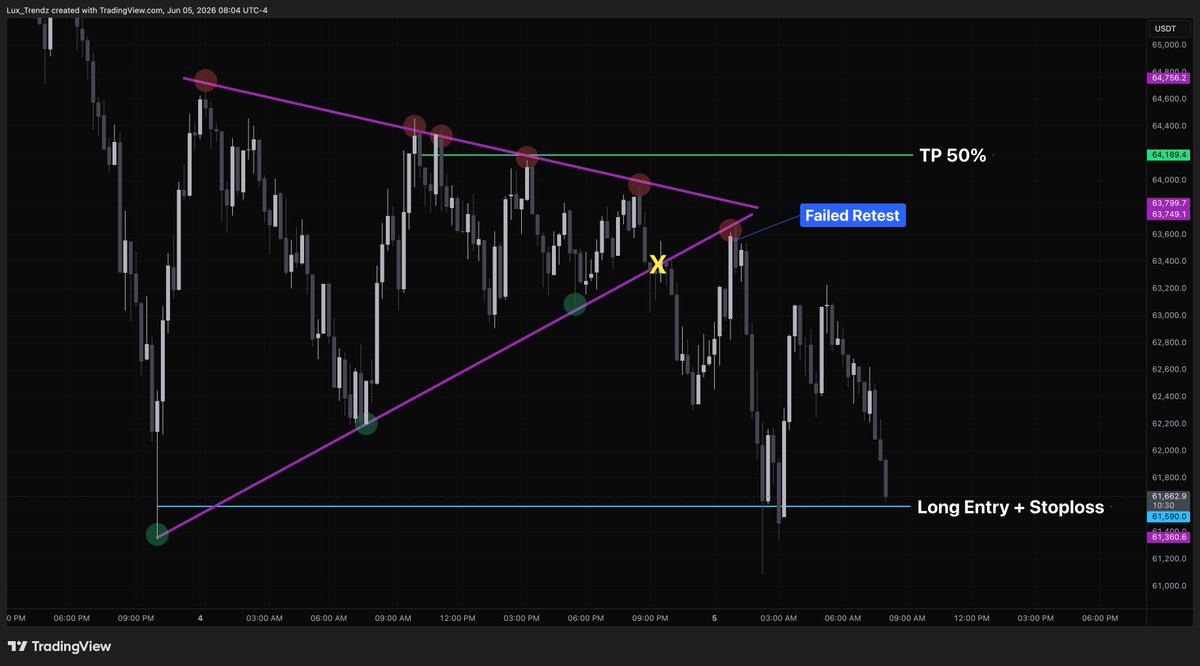
Lux@lux_trendz
$BTC - Long Trade Update (Took 50% Profit) Price managed to push above the NY 10-Minute High, which was one of the key levels I was watching. That said, the move is starting to look a bit weak, and we're currently trading back around that level rather than cleanly accepting above it. Because of that, I've taken 50% off the position here (+4.23%) at $64,190 and moved my stop loss to breakeven on the remaining size. At this point, it's a risk-free trade with profits already locked in. If buyers can continue building acceptance above the NY 10-Minute High and Previous Day Low, I'll look for a move toward the Previous Day Mid as a potential take-profit area. If we continue showing weakness and start getting rejected from these levels, there's a chance I'll manually close the remainder depending on how price action develops. And as always, no predictions. Just managing risk and reacting to what the market gives me.
English
bitcoin:native
I will not close my position.
But i will open a hedge long position.
Entry:
61.000 $
60.500 $
59.000 $
If it goes lower, i will add more.
Position:
5 BTC long at 61k
5 BTC long at 60,5k
5 BTC long at 59k
I prepare my longs for the pump in July.
We will find our first bottom in June, like i told you many times. 🎯

XAPA@xapa03
$BTC my main swing position is growing TP slowly under 60k, straight to bottom
English
@Crypto_Twittier Aku ikut saja sama ahlinya, biar ikutan untung 👍
Indonesia
If #Bitcoin bottoms in October like I believe it will, should I wait until then to share my bullish 2029 price predictions, or should I release them now? 👀
I've spent this entire time focused on building capital during the Bear Market to maximize gains for the Bull Run.
When the time comes, I'll be just as focused calling the next Bull Run.
One thing I can promise you...
I will nail the next BTC Cycle Top right on target. 🎯
Mark my words. 🥂
English
#Bitcoin - On this next leg down, you're going to hear countless influencers calling the bottom.
Trust me, many of the same people who led traders in the wrong direction all the way down are about to do it again.
The echo chamber is so predictable. 🤦🏻♂️
It's not over until I say it's over. 😉🥂
English

Would You Take This Deal? 🤔
Imagine someone offered you this deal:
1 out of every 4 trades, you’ll get stopped out and watch price eventually move in your original direction.
In exchange, you’ll avoid the occasional trade that turns into a 5-10%+ drawdown because you refused to cut the loss.
Would you take that deal?
I would.
----------
A lot of traders hate stop losses because they’re afraid price will tag their stop, then immediately move in their original direction.
And yes, that will happen sometimes.
But that’s simply the cost of "doing business".
The goal isn’t to avoid getting stopped out.
The goal is to protect your capital when you’re wrong.
One missed winner is frustrating.
A large loss can take weeks or months to recover from.
----------
That said, if you’re getting stopped out far more often than expected, the solution usually isn’t removing your stop loss.
It’s improving your entries, trade location, or stop placement.
Risk management won’t make you profitable by itself.
But without it, staying profitable becomes much harder.
English

@ShofyanTsauri2 @lilaccountz Percuma kak. Walau dinaikin statusnya ke bencana nasional, statusnya doang berubah, eksekusi bantuannya tetep 0 kayak sekarang.
Pemerintah kita ga becus ngapa2in selain bikin program sampah dan korupsi.
Indonesia

🚨URGENT‼️ NEED INFO⚠️
ini di rumah sakit umum Aceh Tamiang ada beberapa keluarga yg terjebak di lantai 2. ada BAYI NEWBORN, ibu baru melahirkan, dan LANSIA yg hanya bisa berbaring di ranjang.
apakah sudah ada yg bantu? mereka butuh pampers, makanan, minuman, dsb. TOLONGG PLEASE HELP!!!!
Indonesia

Kalau anda perhatikan alasan kenapa BNB naik terus itu sama persis seperti alasan kenapa HYPE naik?
HYPE naik karena sebagian besar keuntungan dex hyperliquid profitnya buat buyback token HYPE jadi ibarat perusahaan dapat untung sebagian profitnya buat beli token HYPE, intinya kalau harga token mau naik berarti harus ada yang beli.
Makanya saya mikir Binance itu cex nomor 1 dunia keuntungannya luar biasa dia tinggal pakai sebagian profitnya buat buyback BNB, kalau harga BNB naik terus otomatis jadi kebanggaan Binance juga.
Meskipun hal ini ga pernah diakui secara langsung tapi menurut saya alasan BNB naik mungkin karena BNB terus dibuyback sama CZ pakai profit Binance.
Coba anda pikir kenapa 99% altcoin ga naik atau balik ke ath, alasan utamanya ya karena duit darimana buat naikin harga?
Indonesia


Today, the FED will decide whether to cut, hike, or keep rates unchanged.
What's your prediction?
Best guess wins $100 in #Bitcoin!

English