
OVR Performance

449 posts

OVR Performance banner
OVR Performance

OVR Performance

@OVRPerformance

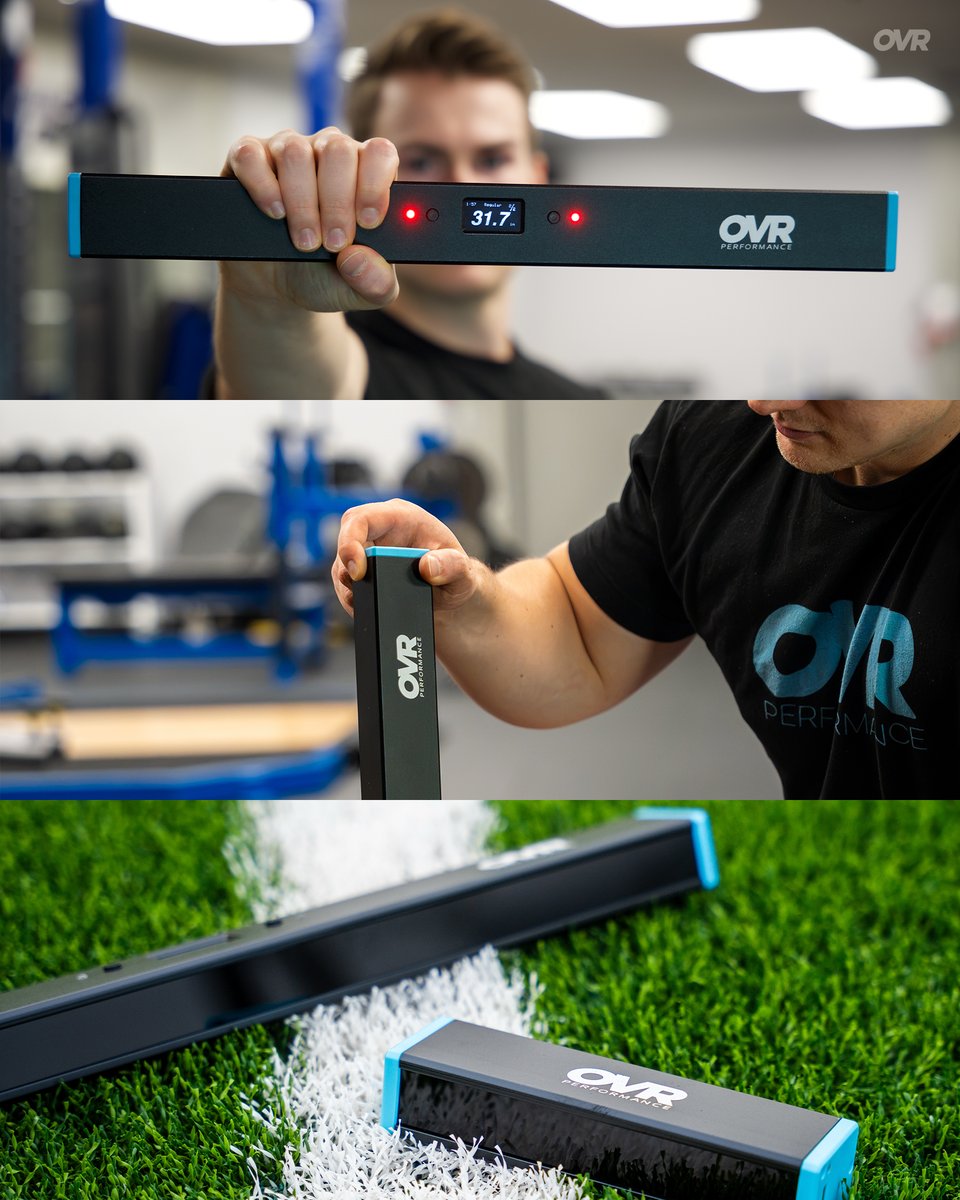
💪🏼 Upgrade your training with easy to use devices 💵 VBT made affordable $249 📈 Jump testing made simple 👇 Order Now! 👇

Katılım Temmuz 2023
24 Takip Edilen1.9K Takipçiler
Sabitlenmiş Tweet
OVR Performance
OVR Performance@OVRPerformance·
The OVR Score is here. One simple number from 1 to 99 🕹️ 🔹 The OVR Score takes six key metrics and transforms them into your OVR Score, an overall athletic rating. - Vertical Jump - Velo Bench - 5-10-5 Shuttle - Tru40 - Height - Weight 🔹 What's a good OVR? 0-49 (Common) Building athletic potential 50-59 (Bronze) Varsity high school starter level 60-69 (Silver) College recruit territory 70-79 (Gold) D1 power conference starter 80-89 (Diamond) All-conference caliber 90-99 (Legendary) Elite/pro level, extremely rare 🔹 You'll also get five individual ratings from 1-99: - Speed - Acceleration - Power - Agility - Jump Built off datapoints from 140,000+ athletes. Get one of six exclusive scorecards from Common to Legendary based on your score. What's your OVR Score? Go to ovrscore.com, enter your data, and get your own custom scorecard. Share it and tag us to show off your score. The only question left is... what's your OVR? #GamifyYourTraining #WhatsYourOVR
OVR Performance tweet mediaOVR Performance tweet mediaOVR Performance tweet mediaOVR Performance tweet media
English
0
5
18
6.3K
OVR Performance
OVR Performance@OVRPerformance·
How do your athletes jump heights compare? 🎓 📊 Data taken from 10,000 high school football players #GamifyYourTraining
OVR Performance tweet media
English
0
0
4
586
OVR Performance
OVR Performance@OVRPerformance·
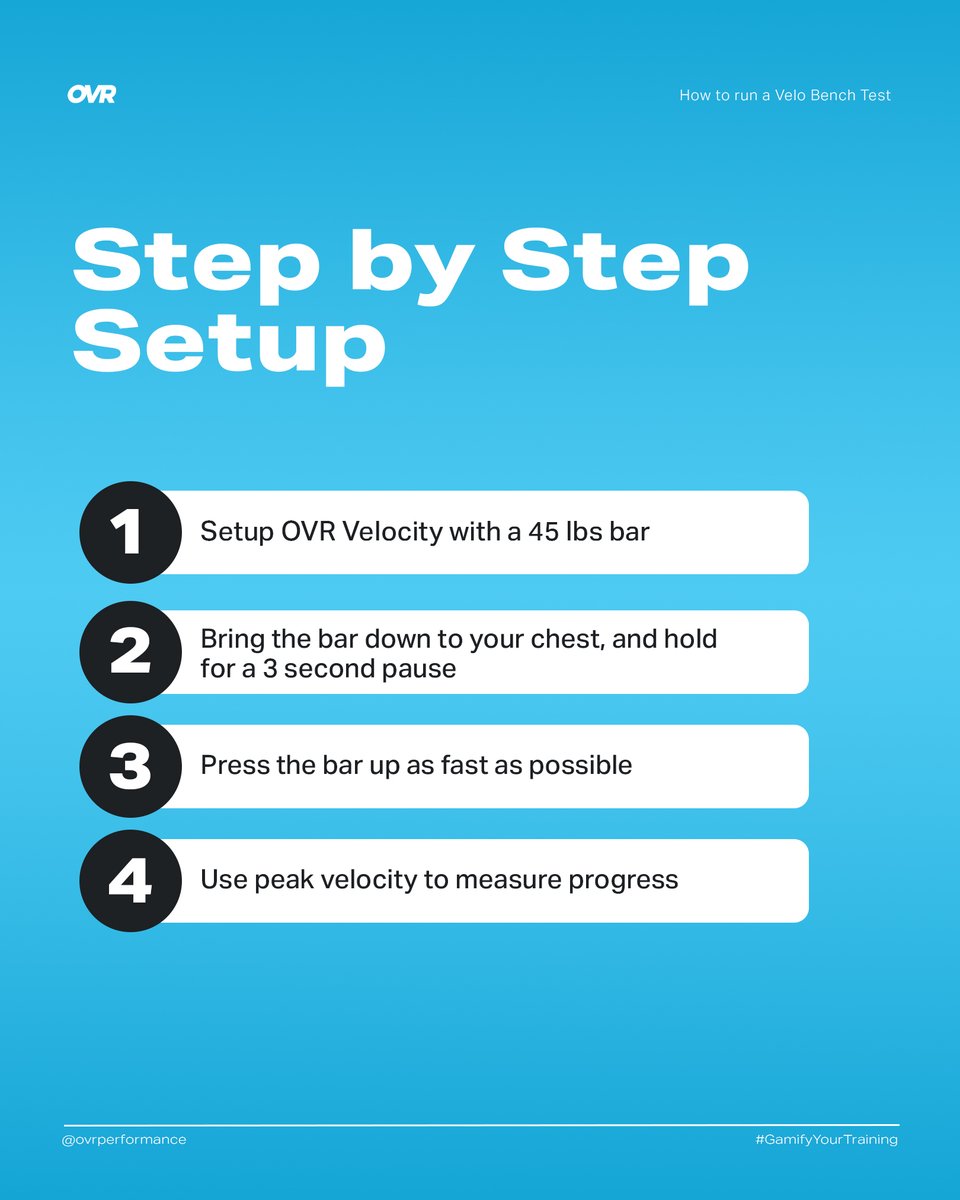
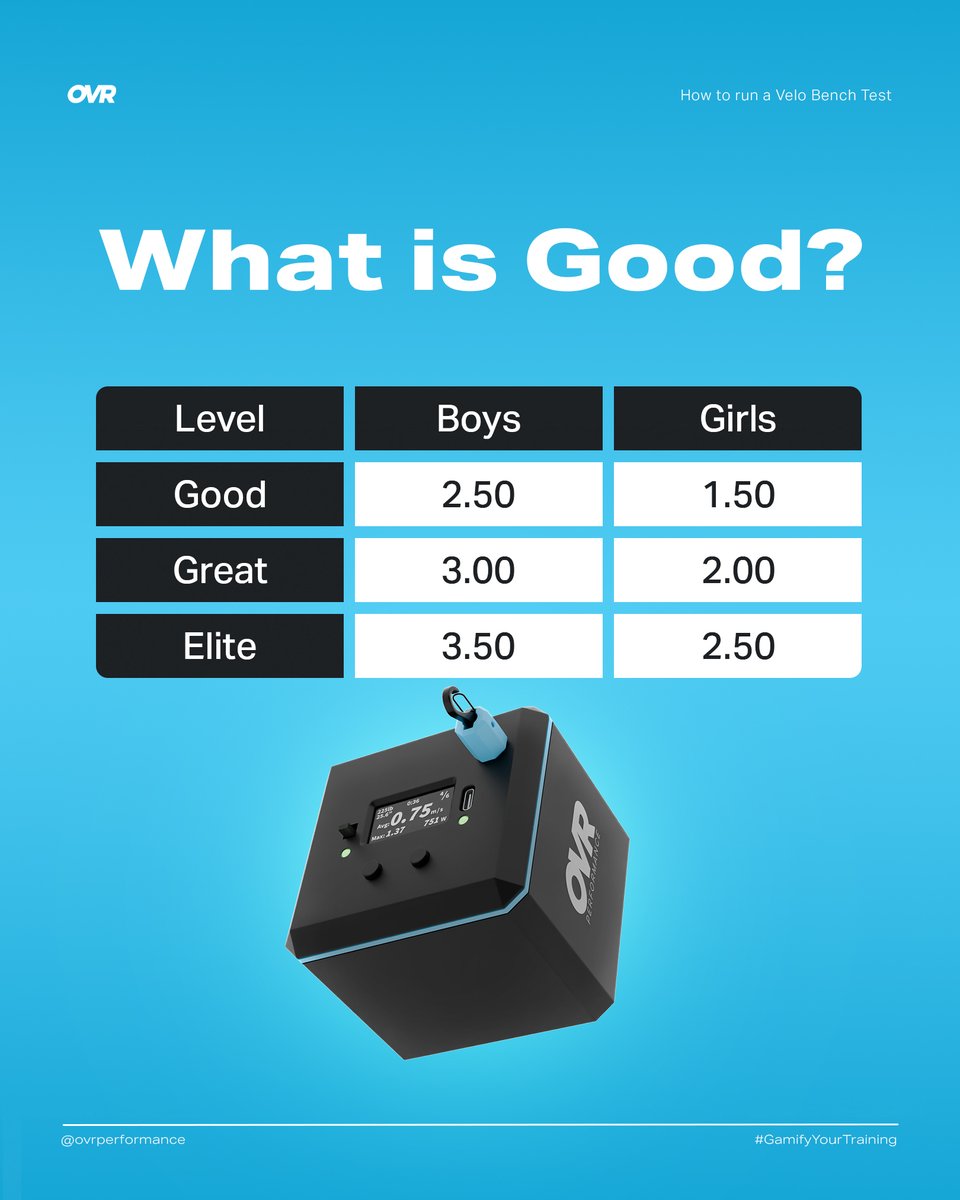
How to Run a Velo Bench Test 🏋️⚡️ Use the Velo Bench Test to find your OVR Score. Here is how to run it: 🔹 Setup OVR Velocity with a 45 lbs bar 🔹 Bring the bar down to your chest and hold for a 3 second pause 🔹 Press the bar up as fast as possible 🔹 Use peak velocity to measure your progress Where do you stack up? 👦 Boys Benchmarks: ⚪️ Good: 2.50 m/s 🟡 Great: 3.00 m/s 🟢 Elite: 3.50 m/s 👧 Girls Benchmarks: ⚪️ Good: 1.50 m/s 🟡 Great: 2.00 m/s 🟢 Elite: 2.50 m/s 💬 What is your velo bench score? #GamifyYourTraining
OVR Performance tweet mediaOVR Performance tweet mediaOVR Performance tweet media
English
0
0
3
301
OVR Performance
OVR Performance@OVRPerformance·
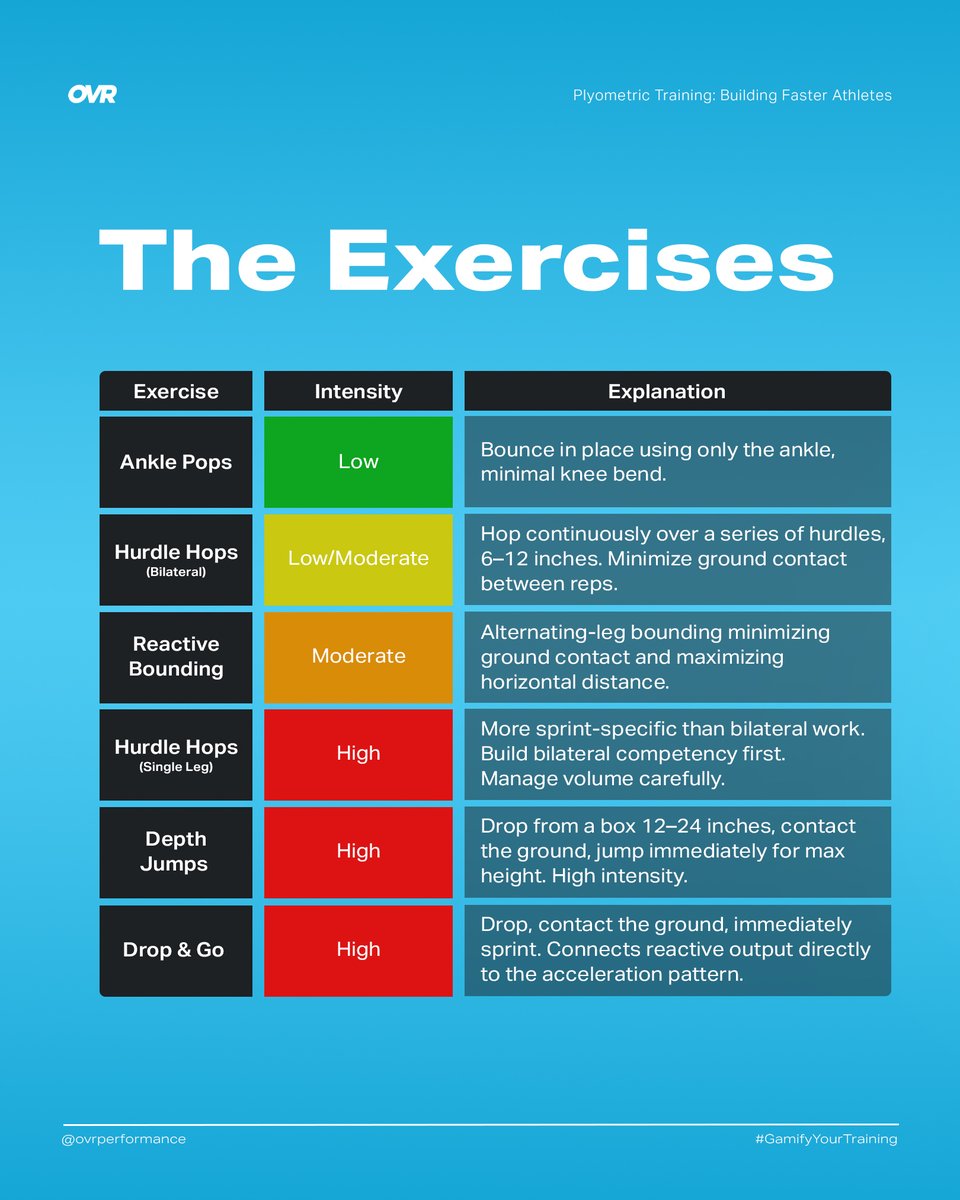
How to Use Plyometric Training to Build Faster Athletes 🏃⚡️ Not all jumping is plyometric. A true plyometric movement requires three things: ⬇️ An involuntary stretch on landing or braking ⏱️ Ground contact under 250 m/s ⚡️ An immediate push-off with zero pause Here is what plyometric training actually develops: 🔢 Reactive Strength Index — jump height divided by ground contact time 🦵 Tendon Stiffness — how efficiently your body stores and returns elastic energy 💥 Rate of Force Development — how fast you produce force in a short ground contact 🧠 Neuromuscular Coordination — the right muscles firing in the right sequence automatically Here is how to build it into your program: 🟢 Introduction — Low intensity, 80–100 contacts, 2–3x per week 🟠 Development — Moderate intensity, 60–80 contacts, 2–3x per week 🔴 Realization — High intensity, 40–60 contacts, 1–2x per week 🟡 In-Season — Low-Moderate intensity, 20–40 contacts, 1x per week Track it all with OVR Jump. RSI is the metric that tells you whether reactive training is actually working. OVR Jump measures jump height and ground contact time on every rep giving coaches real-time feedback.
OVR Performance tweet mediaOVR Performance tweet mediaOVR Performance tweet mediaOVR Performance tweet media
English
0
1
6
654
OVR Performance
OVR Performance@OVRPerformance·
VBT vs. PBT 📊⚡️ What is the difference, when does each method work, and how do you use both? ❌ The Problem With Percentages When a coach writes 4x3 at 85% that number is based on a test that happened weeks ago. Sleep, stress, travel, and back to back practices don't move the number on the spreadsheet. 📅 1RM should be tested on one specific day under specific conditions 📉 Day to day fluctuations can shift true capacity by 15-20% ❓ A programmed 85% may actually be 70-90% of that day's real max 📊 Bar speed gives coaches an objective number to work from instead Here is what bar speed actually tells you: 🔴 Absolute Strength — Less than 0.50 m/s — Greater than 80% 1RM 🟠 Accelerative Strength — 0.50 to 0.75 m/s — 65-80% 1RM 🟡 Strength-Speed — 0.75 to 1.0 m/s — 45-65% 1RM 🟢 Speed-Strength — 1.0 to 1.3 m/s — 25-45% 1RM 🟢 Starting Strength — Greater than 1.3 m/s — Less than 25% 1RM Stop guessing your training intensity. OVR Velocity puts a number on every rep. 📊 💬 Are you training with VBT or percentages? #GamifyYourTraining
OVR Performance tweet mediaOVR Performance tweet mediaOVR Performance tweet media
English
0
2
7
346
OVR Performance
OVR Performance@OVRPerformance·
Did you know your 1 Rep Max Changes Daily 📊⚡️ Most athletes choose their training weight based on a fixed 1RM. The problem? Your true 1RM changes every single day based on recovery, sleep, and other variables. Training based on a fixed number means you could be lifting too much when fatigued or leaving gains on the table when you're fully recovered. That's where OVR Velocity comes in: ⚡️ Use bar velocity to get instant feedback on training intensity 🔄 Prescribe velocity ranges instead of percentages of 1RM 📊 Compare velocity to previous data to measure daily readiness 🎯 Tailor training and avoid overtraining on your worst days 💪 Push harder on your best days Start training smarter with OVR! #GamifyYourTraining
OVR Performance tweet mediaOVR Performance tweet mediaOVR Performance tweet mediaOVR Performance tweet media
English
0
0
3
281
OVR Performance
OVR Performance@OVRPerformance·
10 Yard Dash Benchmarks for Track and Field by Gender and Level 🏃⚡️ Where do you stack up? Here are the 10 yard dash benchmarks for track and field athletes from middle school through elite: 👦 Male Track and Field Benchmarks: 🔴 Middle School (Elite): Sub-1.70s 🟠 High School (Elite): Sub-1.52s 🟡 College (Elite): Sub-1.45s 🟢 Elite / Olympic (Elite): Sub-1.45s 👧 Female Track and Field Benchmarks: 🔴 Middle School (Elite): Sub-1.80s 🟠 High School (Elite): Sub-1.65s 🟡 College (Elite): Sub-1.56s 🟢 Elite / Olympic (Elite): Sub-1.55s Context matters. Sprinters and jumpers will produce the fastest 10 yard times. Distance runners will typically test well below these numbers. Know your number, know where you stand, and train to improve it. Track it all with OVR Sprint. 📊 💬 What is your 10 yard dash time? #GamifyYourTraining
OVR Performance tweet mediaOVR Performance tweet mediaOVR Performance tweet media
English
1
1
2
984
Travis Scott
Travis Scott@TRKCoachScott·
I feel like @OVRPerformance is about to drop an app update that lets you time/save results from multiple athletes and...it's just over for everybody at that point.
English
1
0
0
15
OVR Performance
OVR Performance@OVRPerformance·
Pro Agility Benchmarks for Basketball Players by Gender and Level 🏀⚡️ Where do you stack up? Here are the pro agility benchmarks for basketball players from middle school through professional: 👦 Male Basketball Benchmarks: 🔴 Middle School (Elite): Sub-5.05s 🟠 High School (Elite): Sub-4.55s 🟡 College (Elite): Sub-4.35s 🟢 Professional (Elite): Sub-4.25s 👧 Female Basketball Benchmarks: 🔴 Middle School (Elite): Sub-5.30s 🟠 High School (Elite): Sub-4.90s 🟡 College (Elite): Sub-4.70s 🟢 Professional (Elite): Sub-4.55s Context matters. Guards typically test 0.10 to 0.20 seconds faster than forwards and centers at the same level. Know your number, know where you stand, and train to improve it. Track it all with OVR Sprint. 📊 💬 What is your pro agility time? #GamifyYourTraining
OVR Performance tweet mediaOVR Performance tweet mediaOVR Performance tweet media
English
0
0
3
571
OVR Performance
OVR Performance@OVRPerformance·
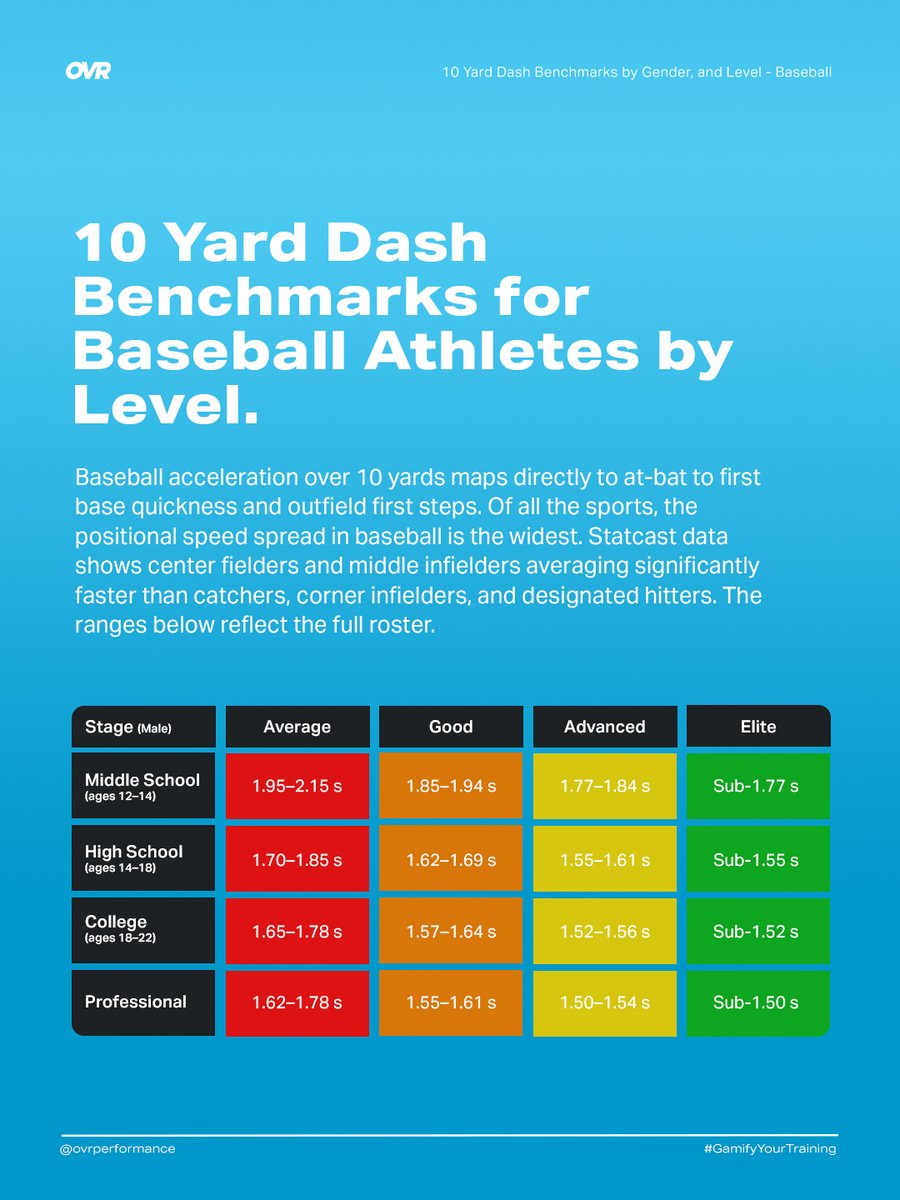
10 Yard Dash Benchmarks for Baseball & Softball Athletes by Level 🏃⚡️ Where do you stack up? Here are the 10-yard dash benchmarks from middle school through professional: ⚾️ Baseball Benchmarks: 🔴 Middle School — Average: 1.95–2.15s | Elite: Sub-1.77s 🟠 High School — Average: 1.70–1.85s | Elite: Sub-1.55s 🟡 College — Average: 1.65–1.78s | Elite: Sub-1.52s 🟢 Professional — Average: 1.62–1.78s | Elite: Sub-1.50s 🥎 Softball Benchmarks: 🔴 Middle School — Average: 2.05–2.25s | Elite: Sub-1.87s 🟠 High School — Average: 1.85–2.00s | Elite: Sub-1.70s 🟡 College — Average: 1.78–1.92s | Elite: Sub-1.63s 🟢 Professional — Average: 1.73–1.88s | Elite: Sub-1.58s Context matters. Acceleration over 10 yards maps directly to first-step quickness out of the box and first steps in the outfield. Position matters as well, center fielders and middle infielders consistently test faster than catchers and corner infielders at every level. Know your number, know where you stand, and train to improve it. Track it all with OVR Sprint. 📊 💬 What is your 10-yard dash time? #GamifyYourTraining
OVR Performance tweet mediaOVR Performance tweet mediaOVR Performance tweet media
English
0
0
5
575