
Frog
581 posts

Great time to go the through the charts and set stink bids on high quality stocks. Preparation is key.
Here's a couple from me..
$NVDA 153~
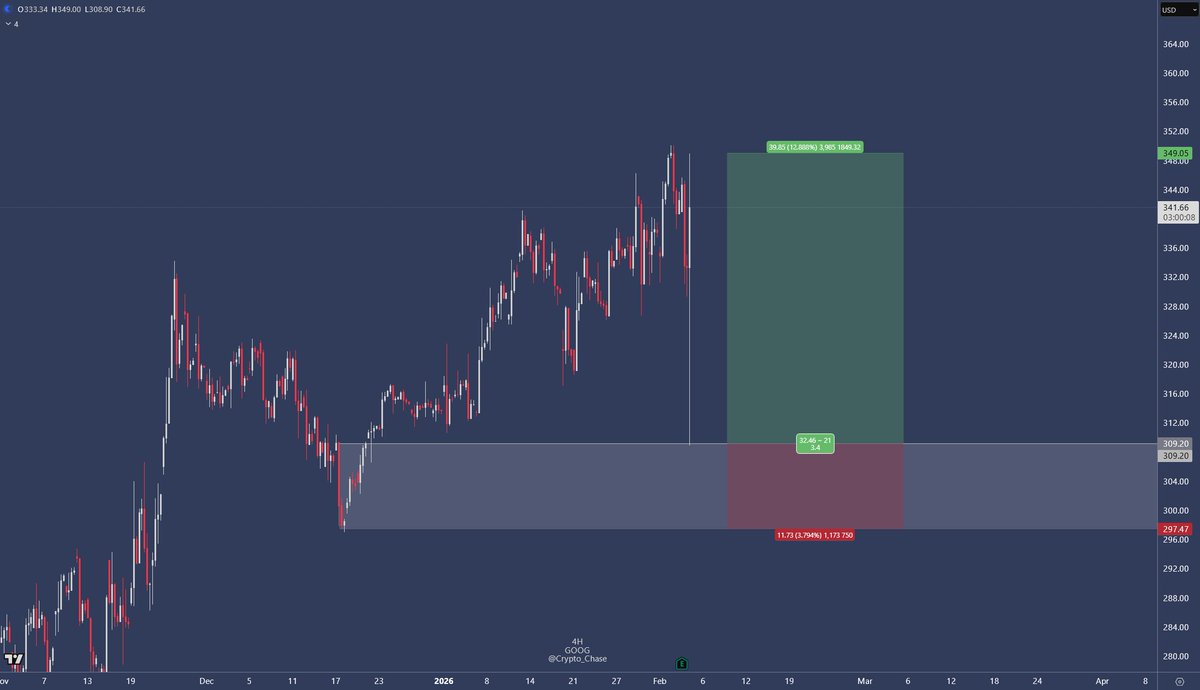
$GOOG 270's
$TSLA 330's
$SNDK 490's (half risk)
$MU 320's (half risk)
Not shorting to these levels, just willing to buy if market offers.
English
@Crypto_Chase I’ve been a fan of yours for a long time. I’m so happy you’re trading other markets than stupid crypto.
English
You're getting stopped out on Saylorcoin $BTC everyday while the greatest companies n innovators in the world perfectly tag Daily demand n give +3.4R in a matter of seconds. Break free from the cage. Quit bootlicking some guy who market buys every high while posting AI slop pics.
Chase@Crypto_Chase
@LSDinmycoffee sir.. i am pleading for an entry lol
English


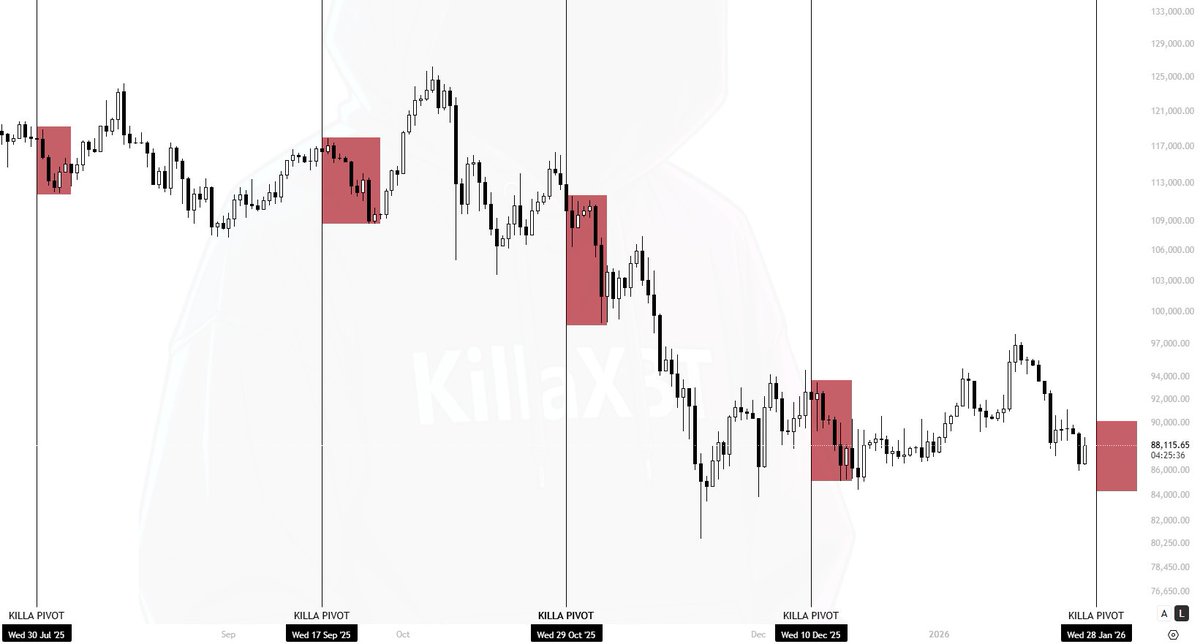
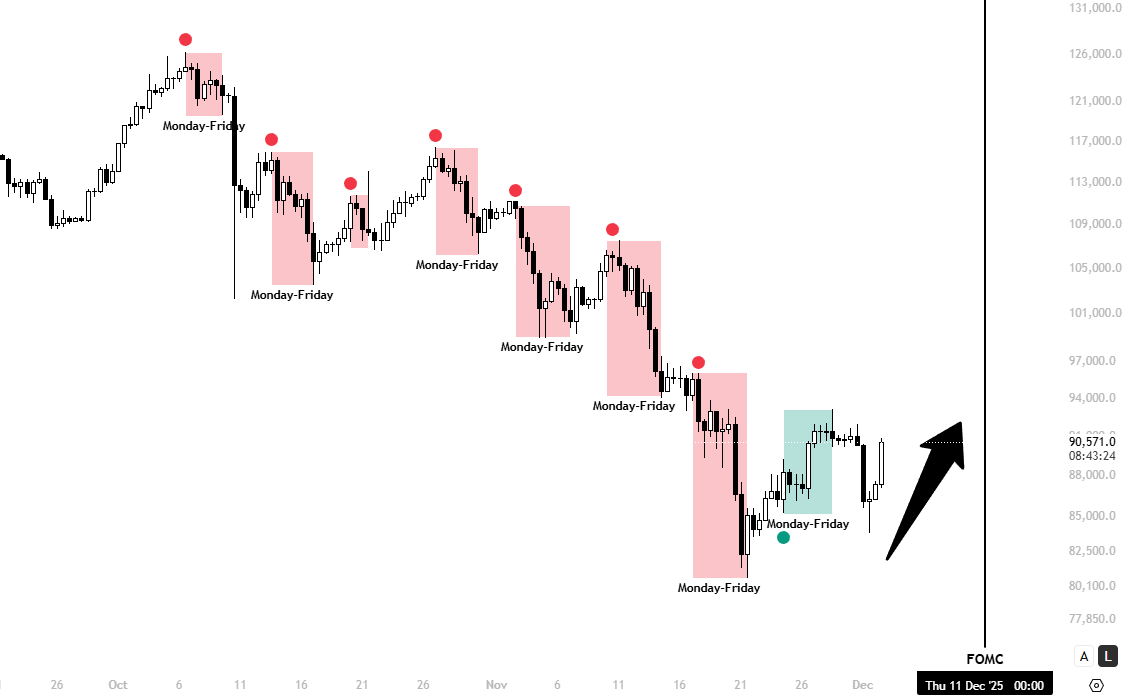
The next key $BTC pivot is in 2 days. The 28th.
If we follow the pattern we’ve seen over the past 5 months, BTC could drop another 5–6% from this zone, which would put the 82–84K range in play.
On the other hand, BTC usually rallies into pivot levels before reversing. This time, however, price is selling into the pivot instead. It will be interesting to see how this plays out.
Killa@KillaXBT
Next pivot 28th January. 5/5 Months $BTC declined on average 5-6% after this zone. This means that wherever BTC is into the pivot, it has a statistically high chance of being a lower high before pushing to 86.8K.
English
$BTC
I’m the one having the last laugh.
Thanks to everyone who doubted me, you only proved me right once again. 🖕
Killa@KillaXBT
$BTC People want to believe otherwise but the simulation will repeat itself.
English
@Crypto_Chase @Scobra9000 Can’t you post about your silver setups? Would be very interested
English
@Scobra9000 ofc, it's boring dogshit. i've just been focused on silver instead, easy liq sweeps -> strong rallies
English
@TraderDune Where did you post about that long? Can’t find in telegram
English

That's 3 profitable setups in a row on $BTC without trading in hindsight. Levels given before the move inside the Telegram as always.
All of these positions had body closes outside of their liquidity levels and "weak" reactions. Looked very scary as price flirted with my stop loss. But I never force closed.

Trader Dune@TraderDune
Currently short on BTC +4R Notice how it flirted with my SL for awhile, with bodies closing above the liquidity levels. Never closed in fear, I trusted my stop loss and embraced any potential loss that would occur. Whales will push price as far as they can to manipulate you into closing early or re-thinking entries before reversing. If I gave into fear, I would have exited with a loss instead of +4R worth of profits. Now I'm breakeven with profits secured on my main entry, with a runner still open with risk. Will likely let it run towards range lows as a BCS if that happens. Still have longs running from the bottom on alts: DOGE, SUI, ETH for examples. Interested in adding on this retrace if logical opportunities give, with risk being hedged by this short.
English
$BTC
Standard Procedure. I was right.
Killa@KillaXBT
$BTC There’s no way institutions would push a bearish narrative heading into an FOMC focused on rate cuts. With sentiment/liquidity already low, the market needs bullish momentum, not sentiment suppression, ahead of the announcement. More clear the day of the announcement.
English
@IamZeroIka I always thought "soar" sounds awkward, but on the other hand, "pump" sounds even worse :) Great post Zero!
English

@_just_an_x_user The approach doesn't change brother, it's almost the same.
You move it when your bags soar.
English
Trailing stop loss is one of the most valuable tools you can use to manage your risk and maximize profits.
"Some" considerations and insights:
For those who don't know, it provides a balance between allowing a trade to run while protecting you from losing too much of my gains.
Unlike a traditional stop loss, which is fixed at a predetermined price, a trailing stop loss moves with the market when the price is moving in my favor but stays in place when the price starts to decline.
This allows you to capture as much profit as possible while avoiding the emotional stress of deciding when to exit.
Over the years, I’ve found that the ability to manage my exit strategy is just as important as choosing the right entry point.
Many traders, including myself when I first started, focus too much on when to buy that they neglect to plan when and how to sell.
But the exit is where profits or losses are truly locked in, and a trailing stop loss helps me execute that part of my strategy without hesitation.
When I enter a trade, I immediately consider how I will protect my capital and secure profits.
A trailing stop loss allows me to stay in a trade as long as the trend remains strong while automatically adjusting my stop level as the price moves in my favor.
For example, let’s say I buy something at $100 and set a 10% trailing stop loss.
My initial stop loss would be at $90 (10% below $100).
If the price rises to $120, my stop loss moves up to $108 (10% below $120).
If the prices continues climbing to $150, my stop moves up to $135, but if, at some point, reverses and drops to $135, my stop loss triggers, and I exit the trade automatically.
The most important aspect of this system is that the stop loss only moves up; it never moves down.
This means that as long as the stock is moving in my favor, my stop loss keeps adjusting to protect more of my gains butq the moment the price starts to drop, my exit is locked in, preventing me from giving back too much profit.
“Bro, I don't trade, I'm a spot holder and I don't care..”
Ask spot holders how much happier they would have been if they had trailed their bags instead of hoping for the moon train.
The longer they held, the farther their journey… but the problem?
They never jumped off when the train arrived at its destination, only to end up back at the main station.
SPOT OR LEVERAGE, IT DOESN'T MATTER.
I usually set my trailing stop loss based on a percentage and manually, depending on my trading strategy and the type of asset I’m trading.
I don’t use the same trailing stop loss strategy for every trade.
Instead, I adjust my approach based on market conditions and the timeframe of my trade:
- Percentage- based TSL
This is the simplest and most common type. I set my stop at a fixed percentage below the highest price reached.
For example, if I set a 5% trailing stop, my stop loss will always be 5% below the highest price.
This method works well for steady trends where I want to capture gains while avoiding normal price fluctuations.
• Fixed dollar amount TSL
Instead of a percentage, I set my stop at a fixed dollar amount below the highest price.
If I set a $5 trailing stop, my stop loss will always be $5 below the highest price.
This approach gives me more control over the exact amount I’m willing to risk.
• Manual
Most of the time, I move my TSL manually because I spend a lot of time on the charts. This allows me to assess market conditions in real time, and given my accumulated experience, I definitely prefer this approach for myself.
Each of these approaches has its strengths and weaknesses, therefore proper contextualization is key.
Why I rely on trailing stops:
🎯They help me to lock in profits
Once my trade moves in my favor, I don’t want to risk giving back all my gains.
A trailing stop ensures that I capture a portion of my profits even if the market reverses.
🎯They allow me to stay in winning trades longer
One of the biggest mistakes I used to make was selling too soon out of fear that the price might drop.
With a trailing stop, I let my trade run as long as the trend remains strong.
🎯They remove my stress
Instead of constantly watching the price and wondering when to sell, I set my trailing stop and let the market do the work.
If the price keeps rising, I stay in.
If it falls back, I exit automatically.
Stopped out?
I don't care, I can always re-enter later if conditions are favorable, but it’s way better to be stopped out rather thank risking to lose much.
Extra sauce:
The decision of manually trade my stop losses is not only due to the fact that I can assess market conditions as a whole, but also looking deeper at the "mechanisms" behind it.
If a bearish OB I was looking gets melted becoming a BB, I adjust the TSL outside the BB region to account for potential liquidity sweeps before continuation.
If price invalidates the BB, it often signals a deeper retracement or MSS, warranting an exit.
I also consider FVGs in placing a TSL because within or too close to an FVG can result in being wicked out before price resumes in the original direction.
Both empty and full FVGs matter in my strategy because sometimes you'll notice that the price fills even empty ones, therefore placing the TSL below or above in case of a short (if it's not too distant from the entry point) is something I do.
Although trailing stop losses are a great tool, they aren’t perfect, and I’ve learned that they don’t work in every situation.
As said before, one issue is that if I set my trailing stop too tight, I might get stopped out too early due to normal market fluctuations.
For example, if I set a 2% trailing stop on a stock that moves 3% daily, my stop will likely trigger before the price has a chance to continue its upward trend.
On the other hand, if I set my trailing stop too wide, I might give back too much profit before my stop is triggered.
For example, if I use a 20% trailing stop in a slow-moving market, I could end up losing a significant portion of my gains before exiting.
Another challenge is that trailing stops don’t work well in choppy or sideways markets.
In these conditions, the price moves up and down within a range without a clear trend.
If my stop is triggered too often, I could end up exiting trades unnecessarily and missing out on potential gains.
To avoid these problems, I always adjust my trailing stop strategy based on:
• The market trend:
In a strong uptrend, I can afford a tighter trailing stop.
In a choppy market, I may avoid using a trailing stop altogether.
• The trade timeframe:
Short-term trades require tighter stops, while long-term trades need more room to move.
This ain't all, but if you've been massacred during the last downtrend, this is already a huge start for you.
English
@CredibleCrypto Hi cred I’m completely wiped out on Bybit uta and reason is I couldn’t close one position in time due to website lag to save the rest, so you think Bybit can offer compensation?
English

Heading home now and will be making a new YouTube vid within the next 48 hours to discuss the events of the last 24 hours.
Please ask me questions you’d like answers to in the comments below and I’ll choose the most well thought out ones to answer in the vid👇
English
Yup, actually holding up really well.
Flush down made us take our local lows but held the orange zone which is nice to see.
Looks good.
$CVX
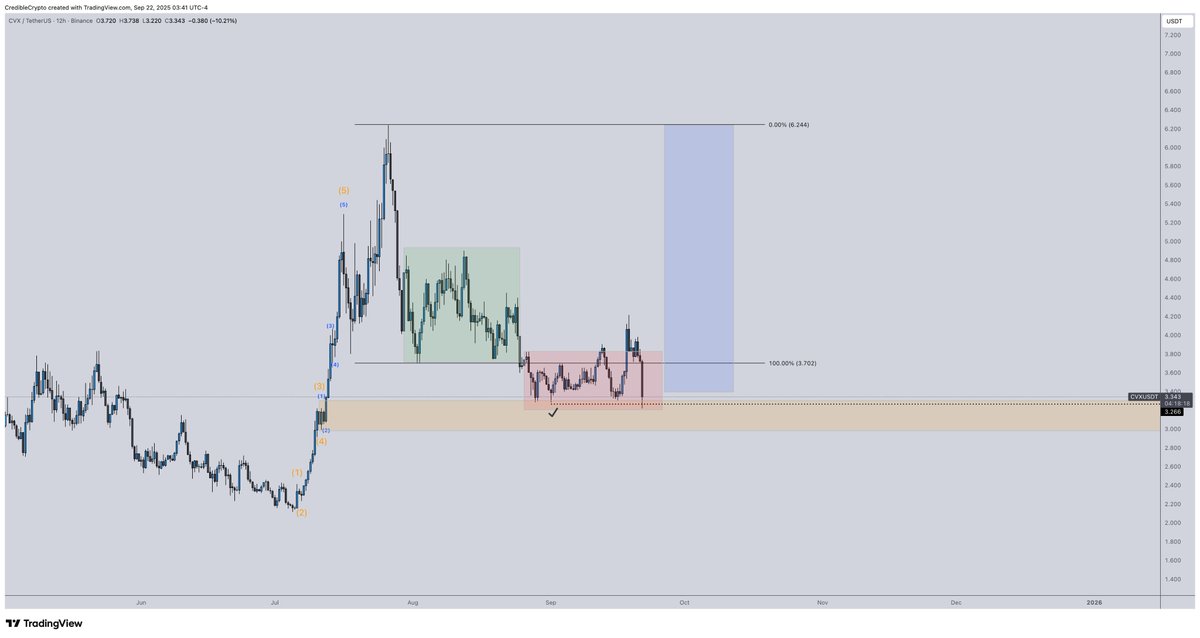
TimMILLionS@TimstaMills
@CredibleCrypto #cvx holding up remarkably well considering??
English
🎯- Educational content: Qualifying demand/supply areas based on market activity - 🎯
This is probably one of the most important educational content I wrote and I suggest you to carefully read it since I believe it will help you to understand but most importantly to contextualize the areas you're watching on your charts in the way I do it. (and I believe it works)
--------------------------------------------------------
1⃣ Theory
In my opinion, you cannot qualify a demand or supply zone based on levels alone, and this is where so many people go wrong.
A horizontal box drawn around a low or high may look neat and convincing on a chart, but in isolation it tells you nothing about the structural participation of the market.
A “zone” is only an assumption until the depth of activity within it is qualified, and this qualification cannot be derived from price alone.
Price is simply a print on the tape: it is the reflection of trades that have already taken place.
Without context, without the density of volume that shows us where business was actually conducted, those levels are hollow drawings that might just as well be wishful thinking.
The FRVP (Fixed Range Volume Profile) is what transforms an arbitrary level into a zone with statistical legitimacy.
The reason context is non-negotiable is because market structure is an auction, and auctions do not revolve around arbitrary highs and lows, but around the negotiation of value.
The FRVP offers a lens into this negotiation by displaying where the majority of transactions occurred within a defined segment of price action.
This creates what I like to call a "map of the battlefield": where buyers and sellers have already agreed on value, where value has been rejected, and where price is attempting to build or fail to build acceptance.
Without this, the notion of a demand or supply zone is just narrative and not evidence.
If price taps a level that you’ve drawn as supply, but volume data shows it sits in a thin, low-participation pocket, the rejection there is unlikely to be sustained as it’s air, not foundation.
If price interacts with the VAH (Value Area High) and is instantly rejected, that rejection is not arbitrary but it's a clean evidence that participants are unwilling to reprice value higher, and this transforms a level from conjecture into a statistically-qualified zone.
Similarly, if a demand zone aligns with the VAL (Value Area Low) and price begins to build acceptance above it, the implication is that buyers are attempting to redefine value upward from the outer boundary of consensus.
These are actionable insights that cannot be gleaned from candlesticks alone.
The problem with relying on levels in isolation is that it assumes the market respects static lines...well, it doesn’t.
The market respects liquidity, and liquidity is embedded in volume.
A level may appear to hold price for a moment, but unless the FRVP reveals substantive order flow and distribution there, that “hold” is fragile.
The VP tells you whether the market considered that level worth fighting over, or whether it was simply bypassed with little interest, making this the context that separates professional qualification from amateur annotation.
And this brings us back to mitigation and unmitigation.
A mitigated zone sitting at the POC is not the same as an untouched unmitigated zone resting at the Value Area Low.
One has been normalized into the market’s perception of fair value, while the other still carries untested liquidity that can fuel an aggressive move.
FRVP is the only tool that lays this out clearly as it distinguishes between zones that have been processed and zones that remain potent.
To pretend otherwise, to treat all levels as equal simply because they’ve been drawn on a chart, is to reduce analysis to little more than drawing areas and hoping.
The blunt truth is this: you cannot qualify demand and supply without volume, and you cannot contextualize volume without the profile.
2⃣ Application + explanation
The starting point is always the same: anchor your FRVP from a meaningful swing high to a meaningful swing low (or vice versa, depending on the direction of the move).
"Why from swing high to swing low?"
Because this isolates the auction leg, the segment of market activity where the imbalance originated.
A swing high followed by an impulsive move down is the beginning of a potential supply structure.
A swing low followed by an impulsive move up is the beginning of a potential demand structure.
By anchoring your FRVP across this exact leg, you capture the entire distribution of traded volume that underpins the move which is not arbitrary, it’s the footprint of where "business" was done, and it’s the only way to distinguish whether your “zone” is real or a mirage.
👁️When you apply the FRVP from high to low, you are left with 3 critical levels:
- POC (Point of Control): The single price level where the most contracts or shares traded.
If your supposed demand or supply sits directly at the POC, understand that this level has already been normalized into the market’s perception of fair value.
Don’t expect explosive rejection as it’s processed liquidity.
- VAH (Value Area High): The upper boundary of 70% of all traded volume within that swing.
Supply zones that overlap with VAH are powerful when price retests and rejects them.
Why? Because they mark the edge of accepted value.
If the market refuses to build above that edge, sellers are defending.
- VAL (Value Area Low): The lower boundary of that same 70% distribution.
Demand zones that overlap with VAL gain legitimacy when price retests them and then builds acceptance back above. Buyers are showing up to keep value inside the range.
Now watch what happens when you use this method concretely.
Let's say that price drives down from a swing high, leaving behind what you’ve identified as a potential supply zone.
When you anchor FRVP from that swing high down to the swing low of the move, you can immediately see whether your zone overlaps with the VAH or whether it sits in a thin low-volume pocket above value.
If it aligns with VAH, rejection there carries real structural weight as it’s the market defending value.
If it sits in a low-volume pocket above VAH, it may act like a vacuum where price snaps back quickly but struggles to hold.
If it’s at the POC, don’t fool yourself into expecting an outsized reaction as that’s where the market already agreed value resides.
3⃣ Examples
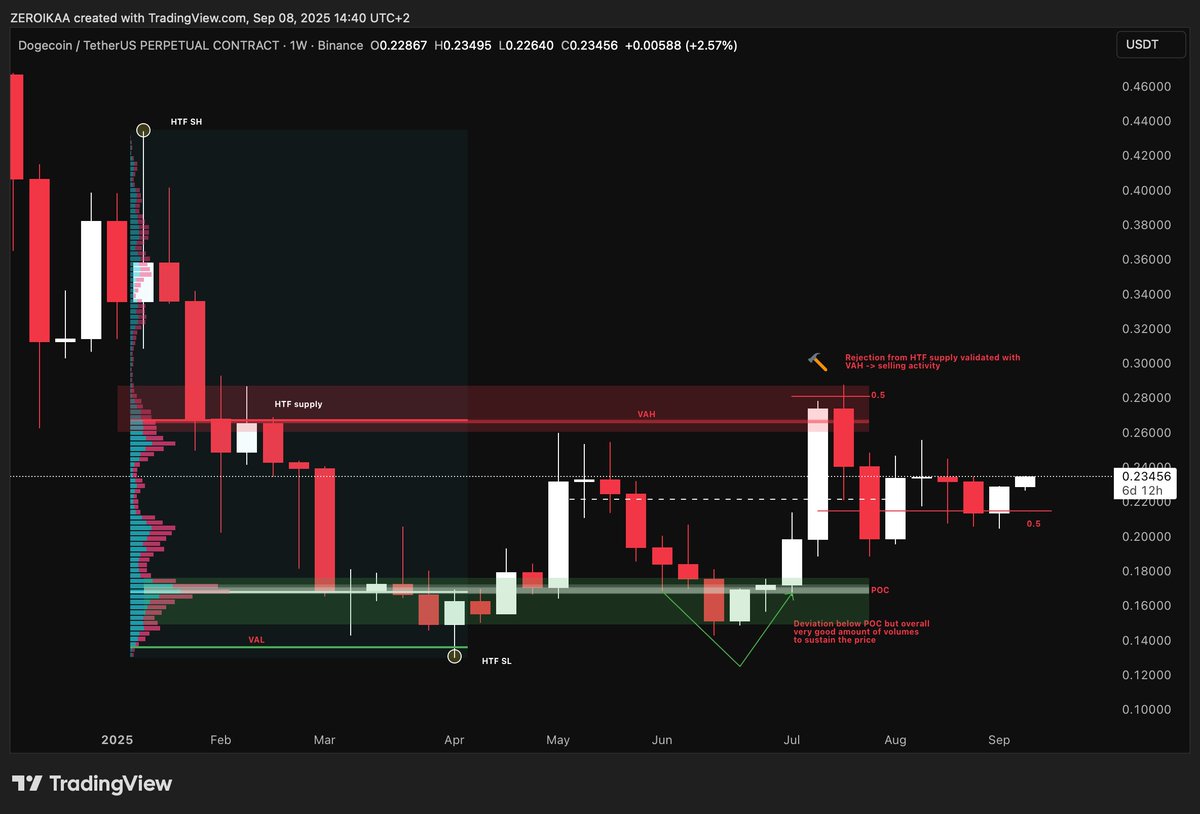
1. DOGE HTF areas validation: ("novice")
2. LTC HTF areas validation + breakers ("intermediate")
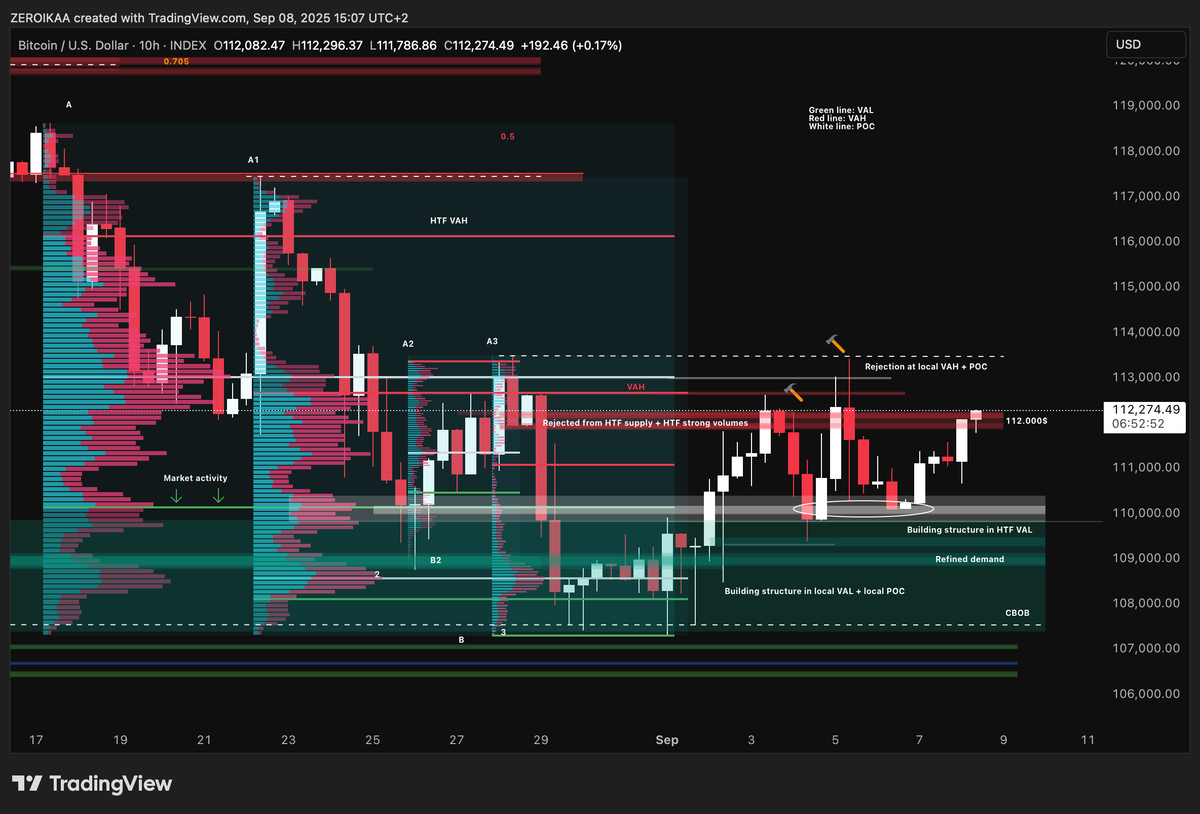
3. BTC MTF + HTF areas validation 4x VP ("advanced")
As you can see from the examples above you can overlap VPs in order to have a clean map of different VAHs/VALs/POCs based on the context and on the timeframe, giving you a fantastic and sound perspective not only on the areas, but also to build your long and short theses depending on how the price action evolves (above or below volume clusters)
こちらの内容が気に入ったら、「いいね」と「リポスト」をぜひお願いします!

English
Pay close attention.
During the last update we saw the touch of the 4.20% semi-HTF level and where, as per the post written above, I opened MTF longs and added a bit of spot.
As mentioned, it wasn't an optimal level and later on, this area has been flipped as a clean breaker that served as continuation into the 4.34%/4.40% key region, one of the best zones to reload "more heavily".
If you remember well, when the USDT D approached that zone there was a lot of fear given by the fact that it was closing above the bearish breaker, but the multi timeframe analysis i posted x.com/IamZeroIka/sta… should have clarified the situation, suggesting you to pay attention to the broader perspective instead of being focused on one single daily candle.
Result?
Fast aggressive drop into the 4.20% area due to the "rate cuts".
Price action always moves first, news comes later only to justify it.
Now, as you can see, the 4.20% has been utilized to push it back toward the 4.42% where most liquidity has been left behind and where a 3W supply has been formed.
In "symbiosis", several majors came back to test their bullish breakers: T1/T2/T3/OTHERS/ETH and for this reason, as long as they hold and the 4.49% high isn't reclaimed on HTF, I can't be bearish.
I can't be bearish especially because the BTC D. has broken below the 2M demand and this creates the assumption for continuation on altcoins and on ETH as well, retest or not retest of it.
Given the amount of liquidity absorbed during these moves and if we see continuation as I expect, I will not look for shorting the 4.06% freshly formed demand, but more on a 🔄 of it, ideally post 3.98% BOS and HTF closure.
Based on my projections, if this is the final swing, an area to pay close attention should be contained in the 3.81%/3.63% area where the 3.69% is a significant level to monitor.
Hope that this thread made you level up since, by following it, you would have been able to catch corrections and favorable accumulation zones based on a systemic approach.
Let's see what we have next and if we can complete the HTF plan.

English
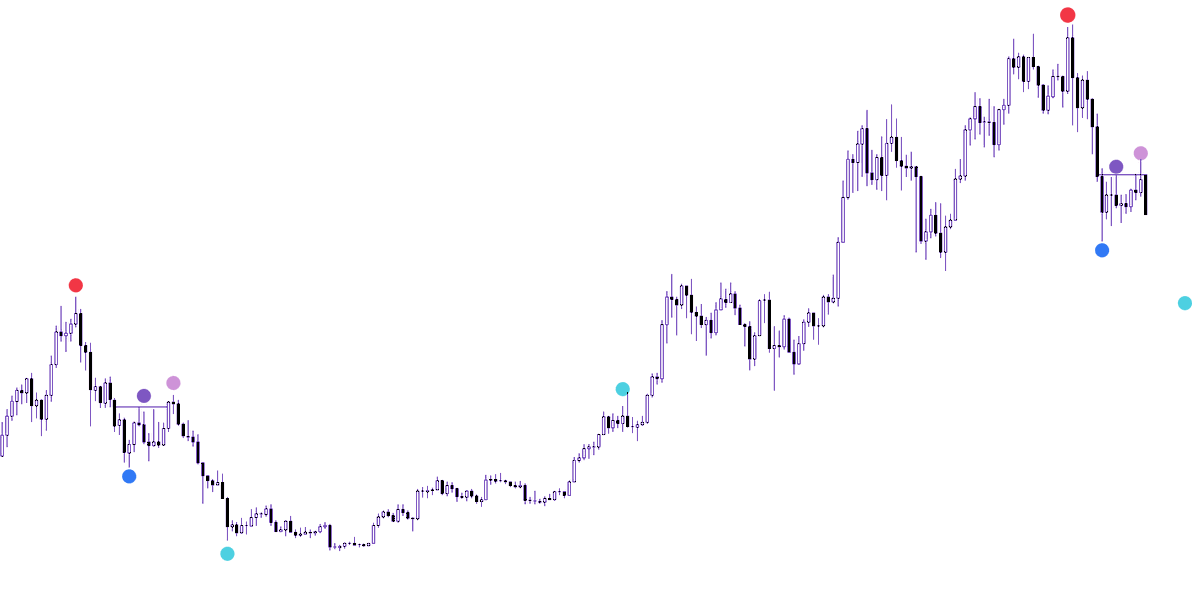
Many are wondering where BTC could go when the answers are already written.

English
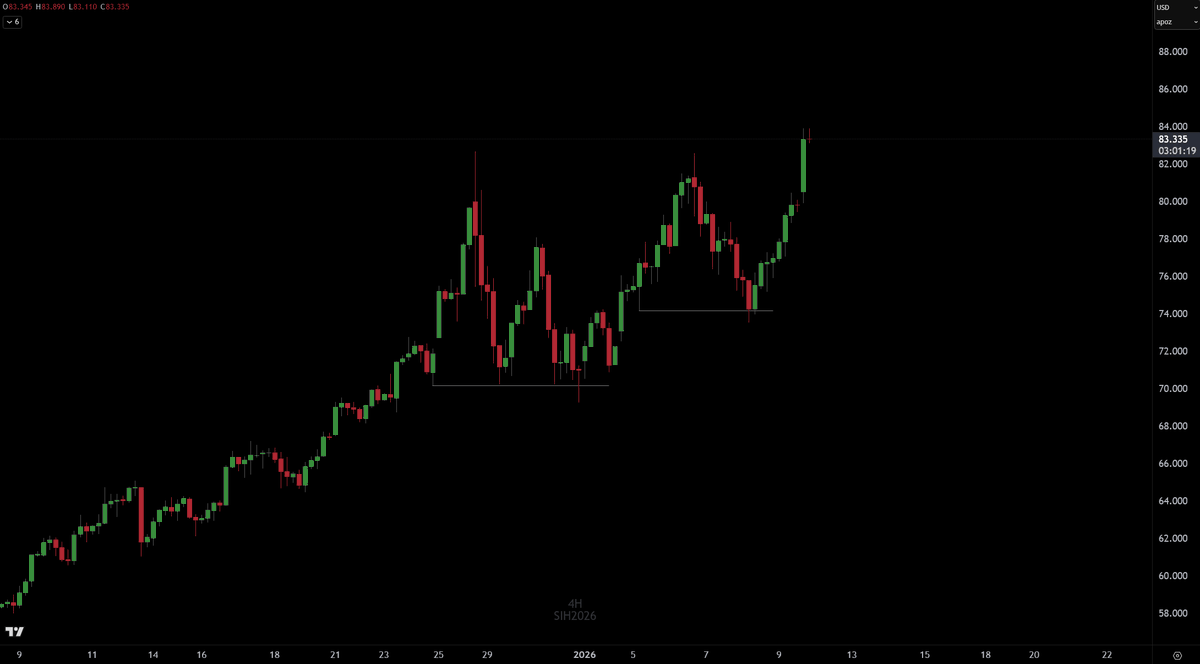
Pretty straightforward setup here. Targeting range highs. Bitcoin is also right in my downside area of interest as well so that confluence was enough for me to attempt this long.
$FARTCOIN
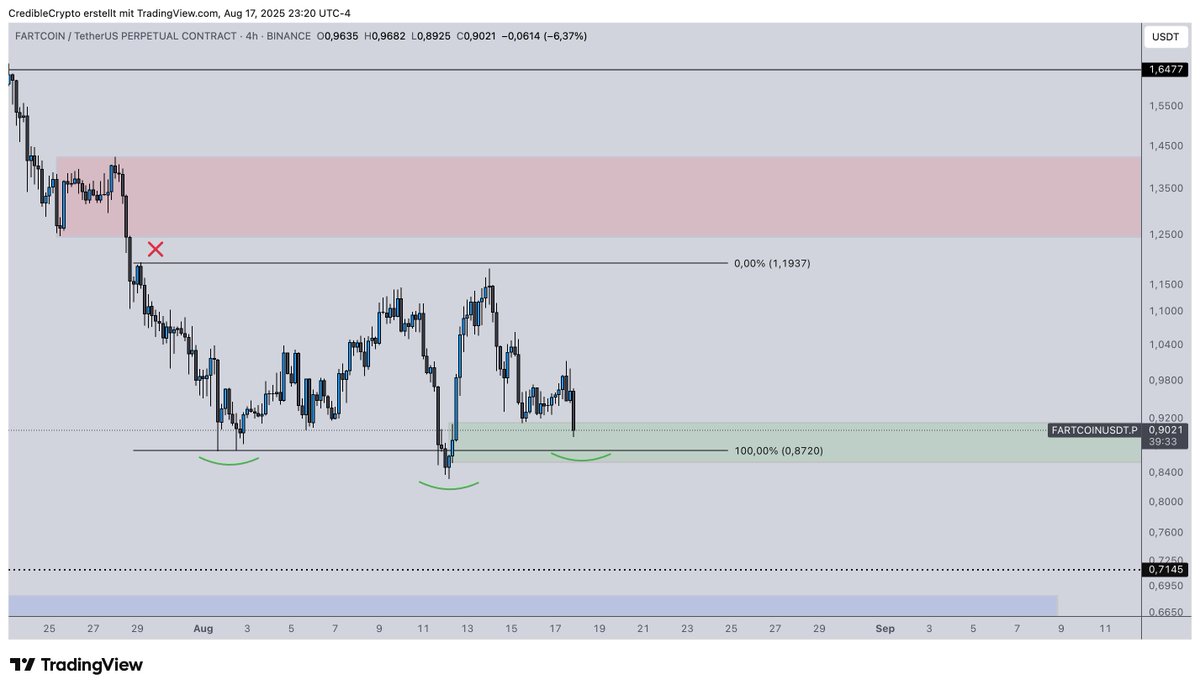
CrediBULL Crypto@CredibleCrypto
Didn’t think I’d ever tweet this but longed some $FARTCOIN.
English

@Wyckoff_Insider A lot of us appreciate and truly value your work, and it seems you’re stepping away just because someone decided to hate on your post. Damn, man, that’s not fair at all.
English

My work is done.
This is the blueprint.
Deal with it.
The account locks in 24 hours.
1.
I love you all.
But I’ll say it clearly:
This trading space is the most toxic, most clownish thing I’ve ever witnessed.
Copycats. Ego wars. Zero depth.
It’s embarrassing.
That’s not my world. Not anymore.
2.
I’ve given everything.
Price action. Liquidity. Reversals. Mindset. Cycles.
It’s all there.
Mapped.
Documented.
Complete.
If you missed it, scroll back.
If it didn’t click it’s not for you.
3.
I’ve got 3 more threads.
Will I post them? Maybe. Maybe not.
They’re only going to the ones who deserve it.
Check your DMs.
Or don’t.
You either aligned with this energy, or you didn’t.
4.
August 7.
I will return.
Briefly.
Then I will vanish for a very long time.
I’ll only be active in a private circle.
Like-minded people only.
Built different.
That’s where the future lives.
5.
Publicly?
You’ll get HTF reversals.
Tops. Bottoms. Timed moves.
And quotes.
Why quotes?
Because I like my quotes.
And if you don’t, scroll.
6.
Don’t chase my authenticity.
Don’t mimic my tone.
Don’t try to become “me.”
It won’t work.
It never will.
You’ll gain nothing.
7.
No more streams.
No more crowd-pleasing.
The deleting has started.
Everything is in motion.
And remember this:
This was just the beginning.
Don’t play with me.
Don’t try me.
See you August 7.
Adios.
English
Local demand on $CRV not offering much in terms of support, seems she wants range lows and the inefficiency below.
Will not be blind bidding below the range lows, want to see some PA develop for a potential long and will patiently wait until we get it.

CrediBULL Crypto@CredibleCrypto
On LTF $CRV has now hit the first area of interest on the downside from which we may see some relief. However, this is pretty much contingent on $BTC holding it's own local lows here as a flush down under 115k on $BTC would almost surely send $CRV below range lows and into the inefficiency just under .90. If we do hold this zone we should expect to find resistance at the range highs again. For non-traders, ignore this LTF "noise". For active traders, it's useful to watch this LTF price action to better understand key levels and how price interacts with them. Let's see how things develop.
English
@CredibleCrypto How is it possible that I have followed you for a year and reading every single of your posts and watched every single of your video, not knowing you have a Discord? Is it something form ancient times?
English
Why did I long $CRV into resistance?
Explained this in a private discord and thought it would be a good share here as well.
(Note I do not have a public discord atm, don't offer any paid services at this time, and the private discord is closed so please don't ask for access).
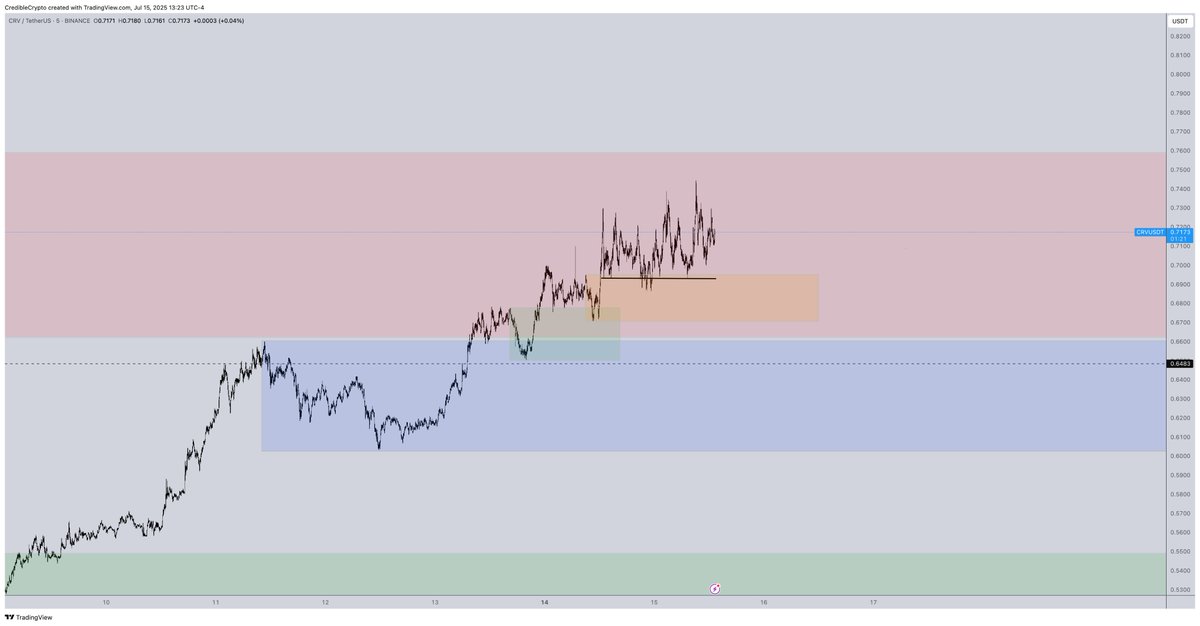

CrediBULL Crypto@CredibleCrypto
Longed some $CRV on my iPhone via the @massdotmoney app. What comes first- my liquidation or $1.50? 👀
English
@Mattertrades Why cant you show video of the loss on Bybit? Most people think that one is fake. You are really winning but the shorts are fake. None is doubting your Binance account.
English

Don’t usually make posts like this but it’s honestly disappointing how this space treats individuals who’ve found success. The constant effort to tear down those who trade with size, who have conviction, who’ve earned their position is exactly why so many like GCR, Hsaka, and others have distanced themselves from CT.
These people aren’t gone because they lost touch. They’re just done explaining themselves to those who don’t want to listen.
I personally don’t have the time or energy to FUD anyone. It’s mid-July, the sun’s out, my time is better spent enjoying it than arguing on here.
To the haters, especially @thedefivillain , and many others keep talking. Real ones see through it.
English
@Ninja_699 What happens to a long when invalidation hasnt been hit but price is below entry? You got this man!
English
On what????
Literally everything happening right now has been covered extensively in my last YouTube update lol.
GO WATCH IT.
Tahmid Shams@syedtahmidshams
@CredibleCrypto Give us a short term market update please.
English