
jhonny chihuahua
9.1K posts

jhonny chihuahua
@POPAPJONS
MURNI PEMANCING EMOSI WARGA BUKAN AKUN BUZZER
Katılım Temmuz 2023
2.5K Takip Edilen217 Takipçiler

Tammy Slaton, star of 1000-lb Sisters, is barely recognizable after extreme weight loss and skin removal surgery.

English
jhonny chihuahua retweetledi

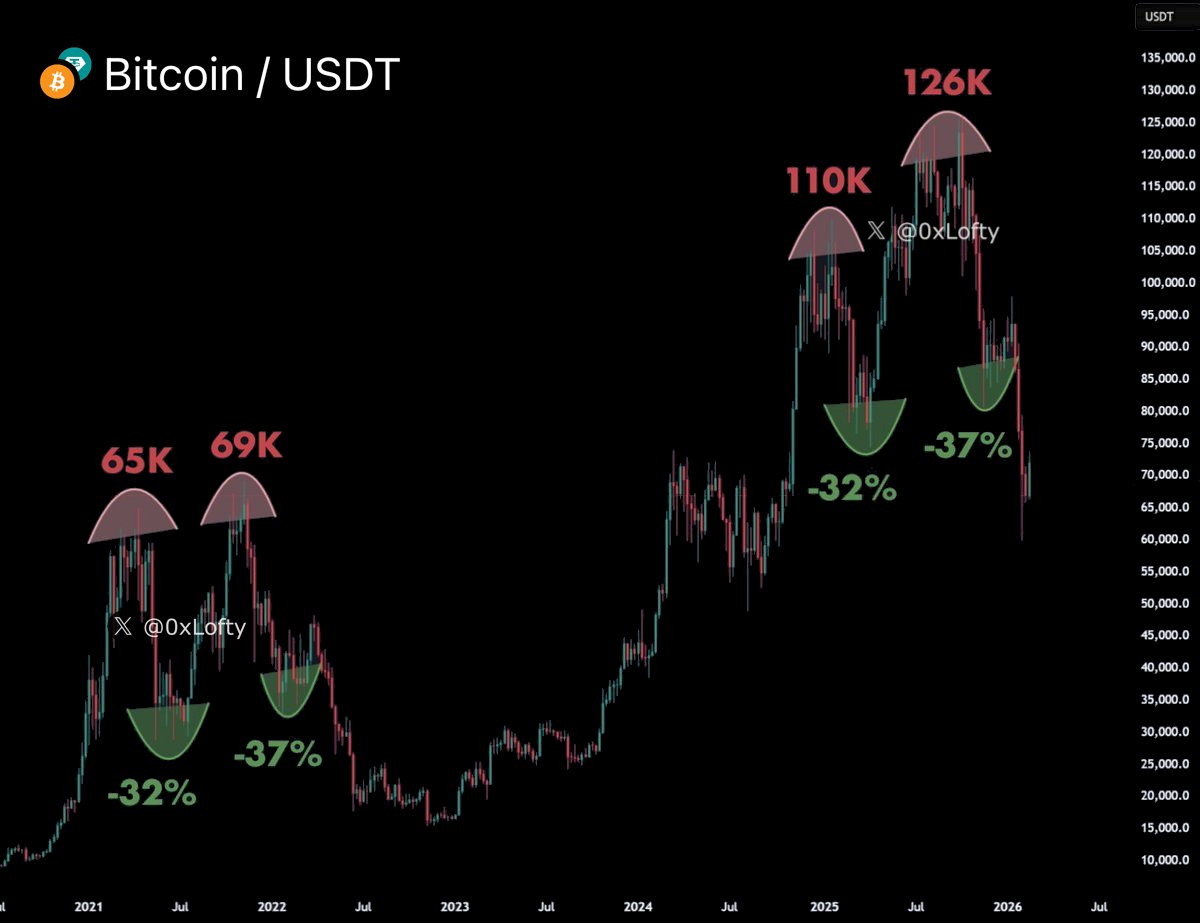
Everything is going according to the plan.
Nothing here is random.
Bitcoin cycle bottom will look exactly like this.
Remember, I was the only one publicly calling the exact bottom at $16,000 three years ago and the top at $126,000 in October.
If you missed those calls, don’t worry. I’ll call the next one too.
Turn notifications on. If you’re not following yet, you’ll understand why that was a mistake later.
Alex Mason 👁△@AlexMasonCrypto
🚨 READ THIS CAREFULLY Bitcoin’s next cycle bottom won’t be where you think. The part most people ignore: Timing. Days from market cycle top → bottom: 2012: 405 days 2016: 362 days 2020: 376 days We haven’t reached that timing zone yet in this cycle. Purely on historical timing, the highest-probability window for the real bottom is July–November 2026. That matters more than any single number on your chart. Most traders only operate on price: “I’ll buy at X.” But the zone that feels “safe” is usually the zone where people do nothing. I don’t play that game. Below $50,000 I’m a buyer. Regardless of when it happens. July–November 2026 I’m a buyer. Regardless of price. If either condition is met, I buy. No hesitation. Yes, I started accumulating as soon as we entered the $60k range last month, even though the timing window isn’t here yet. Back in October, when Bitcoin was around $120,000, I said I’d be a strong buyer near $60k. People laughed. Sentiment was euphoric: “BTC will never see $100k again.” Now we’re here. There’s one more thing most people keep ignoring: NUPL. Every generational bottom: 2018, COVID, 2022, happened when NUPL entered the blue zone. We’re not there yet. For the record, I was the only one publicly calling the exact bottom at $16,000 three years ago and the top at $126,000 in October. If you missed those calls, don’t worry. I’ll call the next one too. Turn notifications on. If you’re not following yet, you’ll understand why that was a mistake later.
English
jhonny chihuahua retweetledi

jhonny chihuahua retweetledi

Mastering hair simulation in XGen: from splines to textured cards. Adjust for a natural look, layering for depth. The illusion of fur, not cards, is key. link.infinityrising.com/steam
English
jhonny chihuahua retweetledi

jhonny chihuahua retweetledi

3 years after it's premiere, the “Dragon’s Breath” sequence in 'John Wick Chapter 4' still remains modern action filmmaking at its absolute best.
English
jhonny chihuahua retweetledi

jhonny chihuahua retweetledi

Got laid off.
Built a game instead.
Solo dev.
$0 budget.
11,000 wishlists in under 2 months.
If you like The Mandalorian, Dune, and Max Payne…
this is for you.
Wishlist on Steam
store.steampowered.com/app/4109980/Ri…
#motivationmonday
English
jhonny chihuahua retweetledi

Petar Pehchevski set up a procedural car entry system in Unreal Engine, using Control Rig and IK to handle character interactions. 🚗
See more: linkedin.com/posts/petarpeh…
#UnrealEngine
English
jhonny chihuahua retweetledi
NVIDIA's Kimodo is the release of the week 🔥
Prompt the timeline whatever your want like: "a person walks forward" → "a person starts jumping", hit Generate, and watch a 3D character do it in seconds
(700hrs of pro mocap training. Works on human + robot skeletons. Super fast + free to use on HF)
English
jhonny chihuahua retweetledi
For the record.
Powell and the Fed behave as if they stand above the U.S. Constitution, treating “independence” as a royal charter rather than a limited grant of authority from a sovereign people.
Independence and integrity do not mean being an emperor of the economy, shielded from basic questions about how public money is spent.
Yes, setting monetary policy independently is sacrosanct. No one is questioning it.
The Federal Reserve’s independence in setting monetary policy does not entitle it to independence from financial accountability, especially when it is presiding over what is plausibly the most expensive office renovation, per square foot, in modern history.
When a project runs into the billions of dollars and far exceeds normal benchmarks, asking for details, bids, and an explanation of overruns is not an attack on central banking; it is the bare minimum of constitutional oversight.
What actually endangers monetary independence is political pressure on interest rates, balance‑sheet decisions, or credit allocation—not tough questions about a wildly expensive real‑estate project. In that light, President Trump calling Jerome Powell “too late” is a far cry from President Truman branding William McChesney Martin a “traitor” for refusing to keep rates artificially low to finance government debt. Truman was demanding pliant policy; Trump is demanding transparency on a construction bill.
Independence and integrity do not mean never having to answer for basic cost overruns or explain why a central bank needs Versailles‑level marble at taxpayer risk.
The situation looks even more like constitutional inversion when Fed allies try to drag an activist judge into the middle of a grand‑jury process to pre‑empt scrutiny, as if judicial muscle could be used to insulate a powerful agency from ordinary legal exposure.
A grand jury exists to decide whether charges are warranted; rushing to shut that down while shouting “Fed independence” turns the concept on its head.
As Shakespeare put it, “the lady doth protest too much, methinks”: the louder the insistence that any inquiry is an existential threat to central banking, the more it sounds like an attempt to shield an embarrassing and possibly indefensible use of public money, rather than a principled defense of the Fed’s rightful but limited independence under the Constitution.
Federal Reserve@federalreserve
Acceptance remarks by Chair Powell at the American Society for Public Administration Annual Conference: federalreserve.gov/newsevents/spe… Learn more about Chair Powell: federalreserve.gov/aboutthefed/bi…
English


jhonny chihuahua retweetledi

I shorted:
- The Bitcoin Covid Crash
- ETH above $3000
- Dubai Real Estate Top
I am now predicting a major Bitcoin dump this week
I rarely short but when I do… it’s time to pay attention
Doubt me at your own risk
Crypto Michael@MichaelXBT
2 years ago my life changed after I shorted the top of the #Bitcoin COVID crash and turned 1 $BTC into 27 $BTC in one week at just 20 years old. This was my most legendary trade ever.
English
jhonny chihuahua retweetledi

The Easiest-to-Use VTuber App!
We have released Version 1.11.2✨
You can download the latest version for free!
#download" target="_blank" rel="nofollow noopener">webcammotioncapture.info/#download
[Key Updates]
✅Improved hand & finger tracking
✅New Camera/Light Tools in 3D Background
✅Screenshots save with transparency
...and more!
English
@MiskinTV_ tampang kek tukang anter galon masih ada percaya ?
Indonesia


@BitcoinJunkies no problemo as far from my liquidation price
English
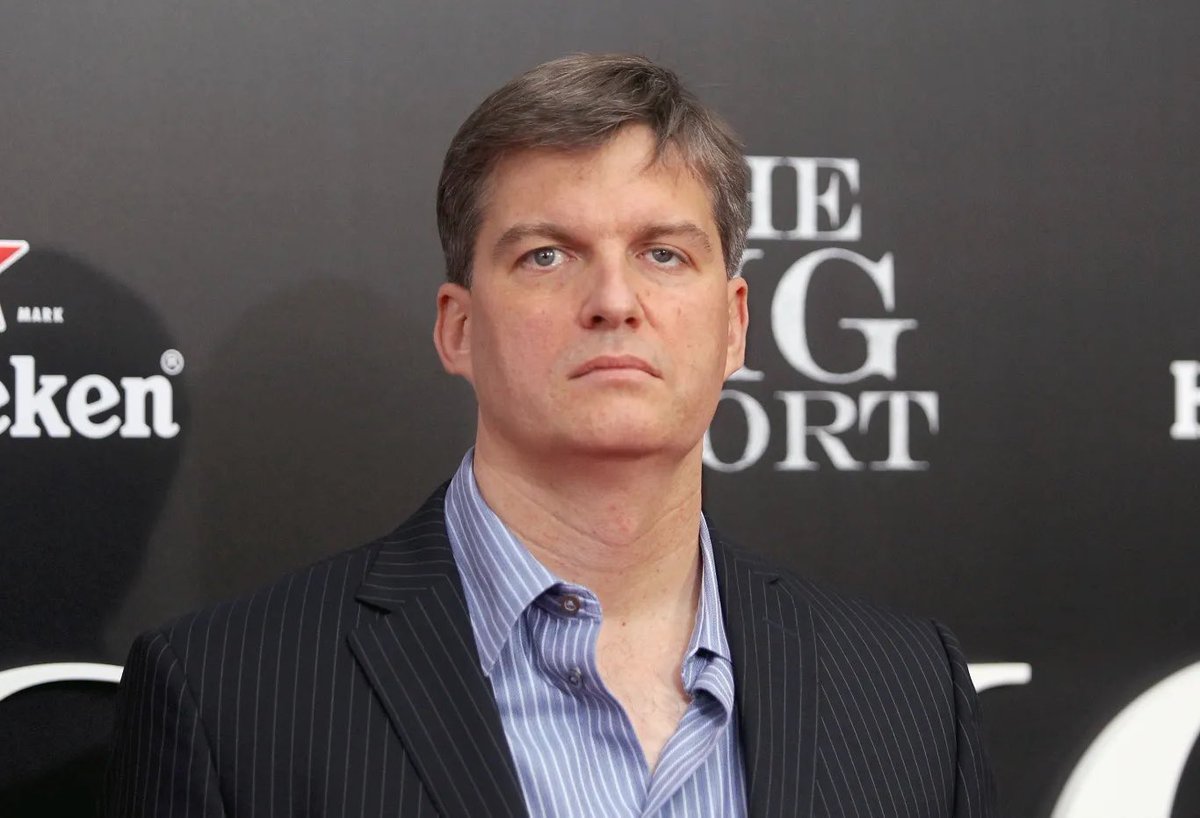
"Big Short" investor Michael Burry says Bitcoin will crash to $50,000
English
jhonny chihuahua retweetledi

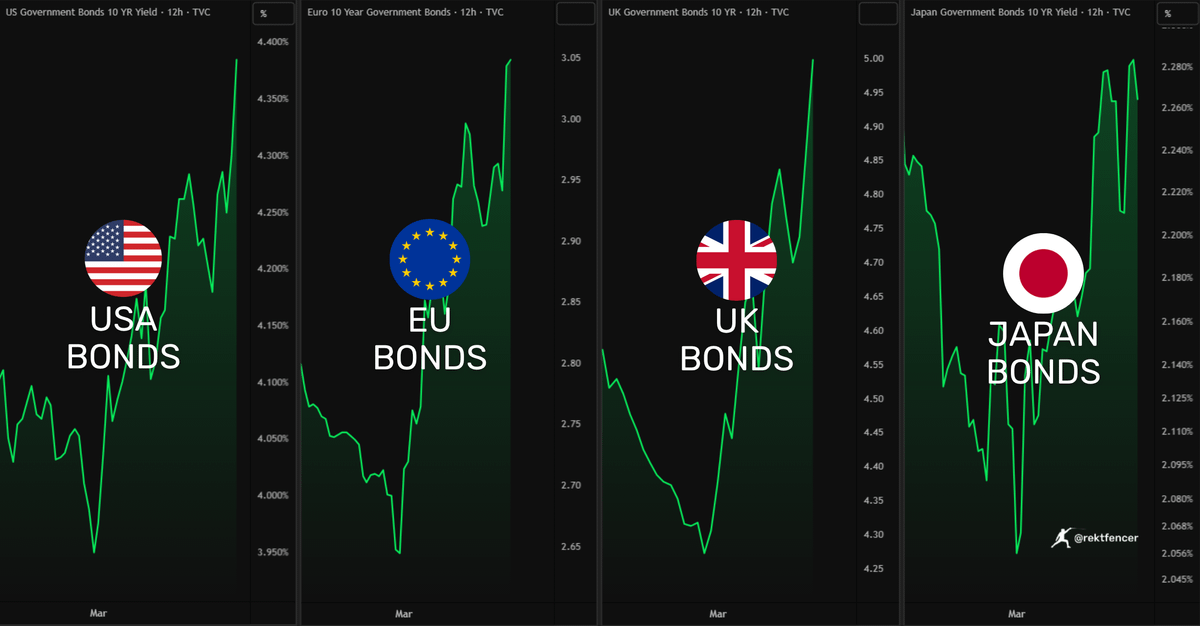
🚨 THIS IS NOT LOOKING GOOD
Global bond yields are surging too fast now
And historically, when yields move like this
It means something in the system is already broke
English
jhonny chihuahua retweetledi

IT'S ALL ABOUT OIL.
As the Iran war continues, oil prices continue to move higher.
We’re currently in the “stagflation zone”, and rapidly moving closer to the “danger zone”.
Oil rising into the danger zone ($120+) and remaining there would likely have a significant impact on the global economy.
This is the level where commentary would probably shift from “macro drag” to “heightened recession risk fears” across the world.
The Strait of Hormuz is still effectively closed as Iran continues to attack tankers in the vital trade waterway.
This means a massive chunk of the global oil supply is still choked off in the area.
US officials have talked up the prospect of reopening the Strait of Hormuz by providing military escorts for tankers.
But this doesn’t seem to be very likely anytime soon.
And so, with every day that passes, more upward pressure is being applied to the price of crude oil.
There’s simply just not enough oil for everybody.
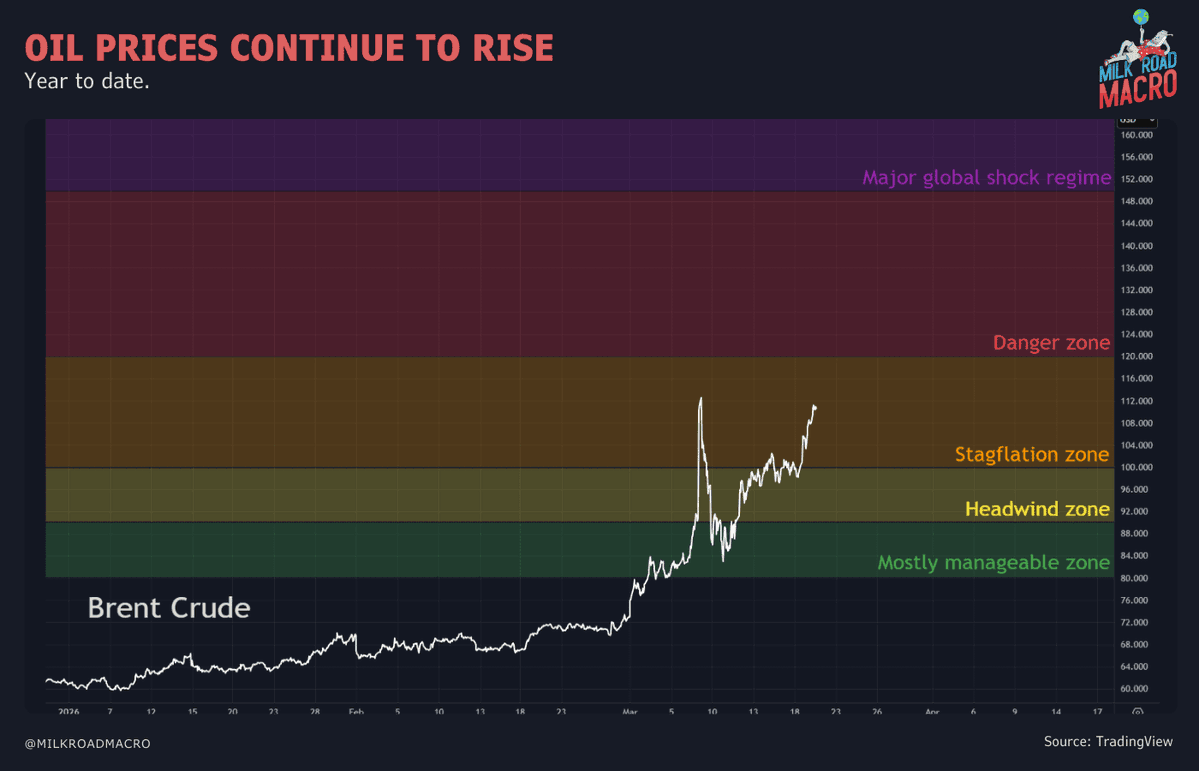
Milk Road Macro@MilkRoadMacro
BRENT CRUDE OIL HIT $119/BARREL EARLIER TODAY. But here's the bigger talking point: Before the war, oil benchmarks mostly moved together. Now they are diverging sharply. The reason is simple: The Strait of Hormuz. Here's what you need to know: ⬜ Brent (white): The world's default oil price. 🟨 WTI (yellow): The US benchmark for oil. 🟩 Murban (green): Crude from Abu Dhabi that sits outside the Strait of Hormuz. 🟪 Oman (purple): Benchmark for heavier crude sold into Asia. 🟥 Dubai (red): Widely used in the Gulf. Now here is the key insight: The oil that depends more on the Strait of Hormuz is increasing the most in price. The more a crude relies on the Strait of Hormuz, the more its price is rising. Dubai and Oman which depend heavily on the Strait have seen the largest spikes. WTI which does not pass through the Strait has seen the smallest move. Here's the conclusion: If the Strait stays disrupted, global oil prices will keep pushing higher. h/t @M_McDonough for the info & chart
English
@nikitabier @TurnerNovak common practical .. especially when near presidential election
English

@TurnerNovak I was investigating a guy running 30 accounts with Indonesian IP addresses and I was trying to figure out what tools he was using.
I found out it was AI: Actual Indonesians.
English

Just spent two hours talking to this guy about AI:
- completely changed the game
- most efficient team member
- outperformed with limited resources
- misunderstood in the court of public opinion
- always has the answer
Turns out he was actually talking about Allen Iverson.
English
jhonny chihuahua retweetledi

Can I just live in my game?
Humblets 🌱 Kickstarter Soon!@humbletsgame
Can I just live in my game?
English