
PaliCali
3.1K posts


Two updates. First – we’ve encountered technical issues with adding members to the channel in the format we initially planned. Second – as a result, access to the channel will be temporarily open to everyone interested. However, within the next month we will automate this process through @StratosphereBot, and each participant will need to complete onboarding through it. Existing Stratosphere subscribers will not be affected. Also, a reminder: regardless of how many people join now, the channel will later be limited to 50 members. If this works for you, the link is below. The link will be valid for 14 hours ↓ t.me/+bXS9TbCOvCI3Y… p.s. If the link doesn’t work in the mobile app, please use Telegram desktop or the web version.


A SNIPER APPROACH: HOW I ACTUALLY MAKE MONEY IN THE MARKET Over the first four days of this week, I’m up 23%. That already far exceeds the S&P 500’s average annual return over the past 25 years – and is likely enough to outperform its full 2026 result. The specifics of my trading system are simple: I generate ~95% of my annual profit within two to four months each year. It’s basically a sniper approach. Long stretches of waiting and patience… then one precise shot. The rest of the time, I stay in cash and take light 3-5% positions, one after another – once the previous trade moves into profit and a breakeven stop is set. I then get stopped out at breakeven or with a small profit or loss. My task is simple – find the trend and make money on it. The rest is routine work, with no need for constant trading. If someone thinks you need to trade every day to make good money, that’s a serious misconception. At the same time, it’s important to understand: I mainly trade indices, sectors and megacaps. Sometimes I add big caps. I don’t need excessive volatility – it’s the second enemy after the constant urge to trade / FOMO. And then everything is simple: Want 1:1 index exposure? Buy $SPY. You’ll already outperform the index over time – with better drawdown recovery and higher Sortino and Sharpe ratios. Want 2x? $SPUU, $SSO. 3x? $SPXL, $UPRO. 5-10x? Options on $SPY. 20x? Options on $SPUU, $SSO. 30x? Options on $SPXL, $UPRO. 50-100-500-1000x? Options (which I won’t specify). Everything depends on your choice and risk tolerance. There’s no need to trade random junk, gamble on earnings or try to predict one-off events. The edge is in working with the trend – not the noise. If everything is so simple, why is my 7-year CAGR only a “miserable” 44.7%? And why was last year “only” 70% in my public portfolio? Simple – that’s enough for me. That’s my risk profile. I make money while staying comfortable. Every year. I don’t waste time watching who made 1000% last year, or who went from $10k to $300k… and back to $10k. You can fool others. You can fool yourself. But you can’t fool math or probability.


DELIBERATE AGGRESSION: FEWER INDICATORS, MORE CONTROL Starting in the new year, my trading system (the “TS”) will undergo significant changes. This is not a cosmetic tweak and not an evolution of individual components – it is a deliberate change in configuration. Why now? Because my three-year contract is coming to an end and a new one begins on Jan 1, 2026. This gives me the ability to rebuild the system from the ground up – without compromises or external constraints. 1. REDUCING THE NUMBER OF TRACKED INDICATORS The TS was put into full operation in late 2018 with 600 tracked indicators. Each year, I gradually and carefully reduced their total number, and over seven years it declined to 250 – roughly a 58% reduction. As of today, about 100 of them are core indicators and around 150 are auxiliary. The reduction came from eliminating the least effective, low-weight indicators, developing proprietary and more efficient solutions and fully discarding obsolete ones. Now the system will go from 250 down to 100 – another 60% cut, executed in a single step. This change is not evolutionary – it is revolutionary. Objective: to simplify the TS as much as possible. 2. MOVING THE TS FROM SEMI-AUTOMATED / AUTOMATED MODE TO FULLY MANUAL Objective: to retain absolute control amid such a sharp change in inputs and to smooth the impact of negative factors if something goes wrong. This is a temporary manual mode until the system stabilizes after the reconfiguration. 3. ELIMINATING POSITIONAL TRADES Positional trades based on a deep understanding of macroeconomic and geopolitical processes have never been part of my trading system. In the current stable configuration of 250 indicators, I used them deliberately as part of my personal trading approach, knowing they could enhance the results of an already successful system: ▫️ bonds $IEF & $TLT (currently); 
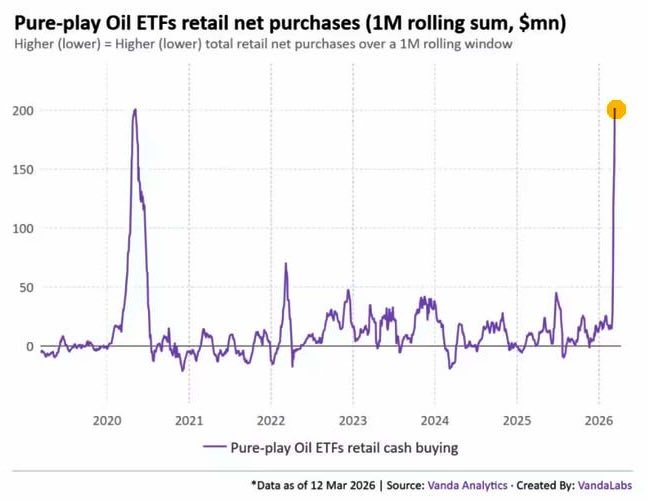
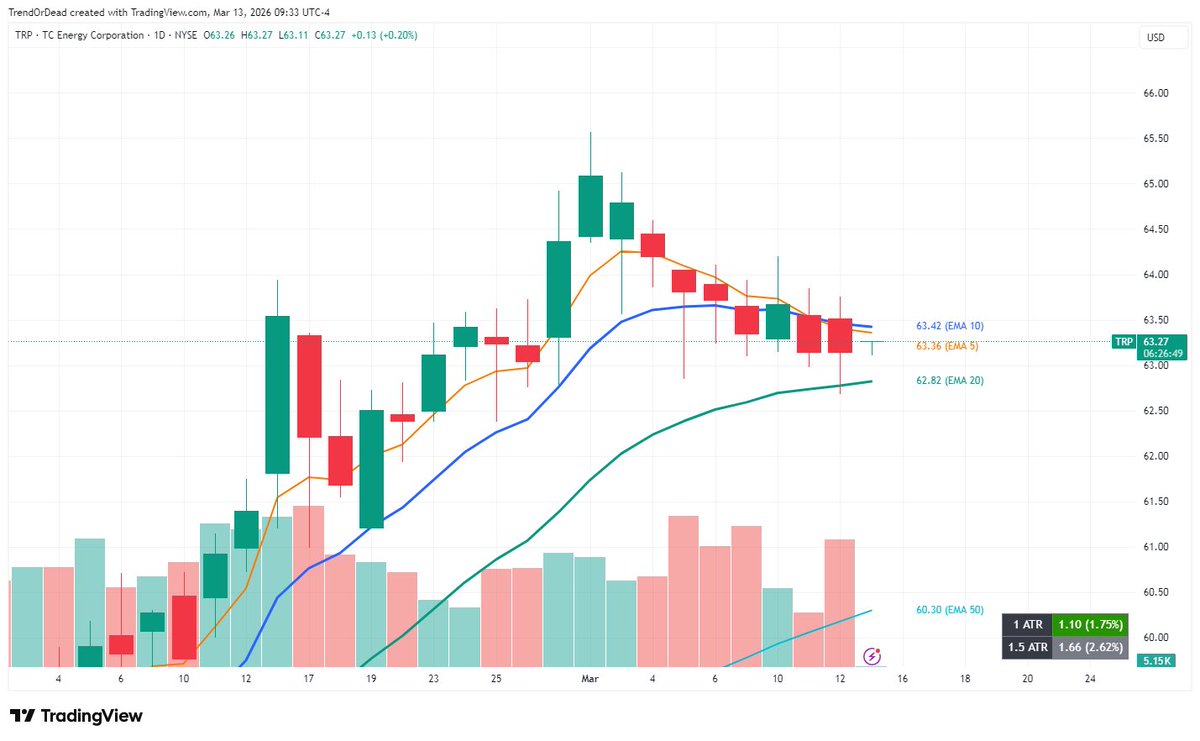
▫️ oil $XLE & $OIH (planned for next year); ▫️ less frequently gold $GLD, silver $SLV and uranium $URA & $URNM (all three were held at the start of this year); ▫️ as well as copper $CPER, platinum $PPLT, palladium $PALL, lithium $LIT and other commodity-related assets. Objective: to remove this last subjective component and rely solely on the math, algo foundation of the system, while regaining the ability to close all positions instantly if needed. Why – see point 5. 4. MAXIMIZING THE SHARE OF INDEX AND SECTOR ETFs AND MINIMIZING INDIVIDUAL STOCKS $SPY $QQQ $SMH $MAGS $XLK $XLC $DIA Objective: to reduce portfolio beta by reducing exposure to potential but uncontrollable volatility and the impact of external factors – news, insider and fund activity, earnings, forward guidance and similar influences. 5. SHIFTING THE TS INTO A HIGHER-AGGRESSION MODE Portfolio risk will change from the standard: 0.25% of capital (5% on a 5% position without moving the stop to breakeven), and a maximum of 1% (5% on a 20% position), to 5% per total portfolio – a fivefold increase. Objective: to compensate for the loss of beta from individual stocks. New year, new system reconfiguration. With a new employer and a new contract in place, I can now leverage the work of the past three years to fully rebuild the system. This is yet another step to further tighten control and improve performance.


Announcement. This Saturday at 9:00 AM NY time, an invitation post will be published for a FREE private channel, where weekly market analysis will be posted on Sundays. Over time, situational market analysis and additional observations will be added. What will be required to receive an invitation: 1. Be subscribed to @denistratos and @StratosphereBot 2. Follow the instructions in Saturday’s post before the deadline Who gets in first (50 spots): 1. Stratosphere Live Portfolio Access service subscribers (no conditions – kindly DM @StratosphereBot) 2. Those who treated my work/content with respect and appreciation – whose likes and comments I regularly saw under my posts 3. Then – depending on available spots What if you want to get into the private channel but don’t get in this time? 1. If someone in the private channel breaks the rules or is removed for any other reason – you’ll have a chance to take their spot 2. Wait for the next spot release About my content. Will the content on @X change? No, it won’t. I have more to say and more to show – I’ve shown this more than once, and you know you won’t find this anywhere else. But I have no interest in doing this for an indifferent audience, especially on a regular basis. About the private channel. Why create it? 1. I am not a blogger and the size of the audience and the potential income from it do not matter to me. I prefer to share my unique experience and knowledge with a limited group of people – those who have earned it through their attitude – rather than with tens of thousands of random subscribers. 2. Will there be information on trades in the private channel? No, that’s what the Stratosphere Live Portfolio Access service is for. 3. What is the catch? How are you going to monetize the private channel? There will be no monetization – it’s completely free to be in the channel.


Oil prices are up 28% in Brent and 37% in WTI crude in just one week (and that’s even after today’s sharp drop). U.S. and European oil majors? Flat. If you haven’t been watching them, here’s the surprise – they’re going nowhere. Why did this happen? Those who were positioned for geopolitical escalation in Venezuela and Iran have been accumulating these stocks since late last year – even while oil prices were stable and the market was in surplus. So why didn’t prices react now, when retail investors were piling into the obvious trade? Because someone is taking profits. #BZ #CL $XOM $CVX $SHEL $TTE


My team and I are launching the public portfolio service STRATOSPHERE. • AUM size – $150k • trade structure – so that trades fit almost any account size • underlying assets – indices, economic sectors, large-capitalization companies • main instruments – call options and leveraged ETFs • trading time – regular trading session from 9:30 to 16:00 NY time Every action in the portfolio – you’ll receive an individual notification shortly. Portfolio viewing will be available online every trading day from 9:00 to 16:30 NY time. Who is this service for? That is a question each of you will have to answer for yourself – only you can assess your experience, your approach to trading, your discipline, your trading strategy or its absence, and only you know your trading history and its real results. What can be said for sure: if you • close every year in profit, year after year outperforming $SPX • are a committed supporter of holding positions through red • are convinced that you can consistently make money with a portfolio consisting entirely of “undervalued” companies like $MSTR, $PYPL, $JD, $EL, $SMCI, $SNAP, $PATH, $DUOL, $HIMS, $OPEN, etc. • trade earnings, news, IPOs, SPACs and other random events • are a fan of shorts, hedging and other strategies with a low probability of success over long periods of time • firmly believe that you can perform the work of an open-heart cardiac surgeon after studying information on @X written by a theatre student This service is definitely not for you. p.s. The service is anonymous. Neither we nor other clients will be able to know that you use it unless you disclose this information yourself. Want to know more? Go to @StratosphereBot What are the principles behind the strategy? Posts below show how I think and trade. 🟢 Must reads 🔵 Good to know THE BASIS OF MY STRATEGY 🟢 Deliberate Aggression → Absolute Control x.com/sojustfollowme… 🟢 How I differ from 99.99% of traders x.com/sojustfollowme… 🟢 How I structure my portfolio x.com/sojustfollowme… 🟢 Predict Indicator: Red or Green Days Ahead x.com/sojustfollowme… 🟢 My Trading Evolution: From Imitation to Independence x.com/sojustfollowme… 🟢 Why I Trade Only the U.S. Market x.com/sojustfollowme… 🟢 Why I Don’t Hedge (and Stanley Druckenmiller too) x.com/sojustfollowme… 🟢 Why I Rarely Use Short Positions x.com/sojustfollowme… 🟢 Answers to questions about my trading strategy. Part one x.com/sojustfollowme… 🟢 Answers to questions about my trading strategy. Part two x.com/sojustfollowme… 🟢 Important note x.com/sojustfollowme… WHY I TRACK TRADING ALGOS 🟢 Power, Media, Money: Algos Against You x.com/sojustfollowme… 🟢 Brokers in suits are out – AI runs Wall Street now x.com/sojustfollowme… 🟢 News and “accidents”… not so accidental after all? x.com/sojustfollowme… 🟢 Jeffrey Epstein on Wall Street x.com/sojustfollowme… 🟢 Visible trading algos shifts from New Year x.com/sojustfollowme… WALL STREET: BRUTAL REALITY 🟢 All you need to know about Wall Street hedge funds. Q4 2025 x.com/sojustfollowme… 🟢 Mutual & Hedge Funds: 2025 Disaster, Déjà Vu x.com/sojustfollowme… 🟢 All you need to know about Wall Street hedge funds. Q3 2025 x.com/sojustfollowme… 🟢 All you need to know about Wall Street hedge funds. Q2 2025 x.com/sojustfollowme… 🟢 Everything You Need to Know About U.S. Hedge Funds – in a Single Brutal Chart. Q1 2025 x.com/sojustfollowme… WHY I THINK WE’RE MORE LIKELY HEADING FOR THE COLLAPSE OF THE AI BUBBLE 🟢 The collapse of the AI bubble. Part one SPX/M2SL x.com/sojustfollowme… 🟢 The collapse of the AI bubble. Part two SPX/M2SL x.com/sojustfollowme… 🟢 The collapse of the AI bubble. Part three QQQ/M2SL x.com/sojustfollowme… 🟢 $MSTR: SEC, fraud, crash -62% in one day x.com/sojustfollowme… 🟢 IMF in panic? Reading between the lines x.com/sojustfollowme… Continued ↓


Today’s stock – $AVGO. Six touches of the daily 200 EMA in 18 months, five prior swings: • Aug 5, 2024 → 32% • Sep 9, 2024 → 85% • Mar 4, 2025 → 10% • One was the Trump tariff-driven selloff in April 2025 – understandable. After 20 days below the moving average → 125% • Feb 4, 2026 → 32% I opened a position yesterday at $312.00 after the sixth touch of the daily 200 EMA. Size: 5% AUM | Stop: 1 ATR | R/R: 1/3.75 Next ticker? When this hits 150 likes. Stay tuned. ⚠️ NFA | General info only | Personal view


USA has OpenAI and ChatGPT USA has $GOOGL and Gemini USA has xAI and Grok USA has Anthropic and Claude USA has $META and Llama USA has $MSFT and Copilot China has DeepSeek China has $BABA and Qwen China has $BIDU and Ernie China has Zhipu AI and GLM China has Moonshot AI and Kimi China has MiniMax Europe has @vonderleyen Europe has @kajakallas Europe has @MinPres Europe has @EmmanuelMacron Europe has @_FriedrichMerz Europe has @sanchezcastejon Innovation 🆚 regulation


🚨 A HARBINGER OF BROAD STRESS FOR THE FINANCIAL SYSTEM The private credit sector is under mounting stress. After a string of defaults in subprime and factoring, Blue Owl $OWL (AUM $295 billion), a major player in private credit, is now in the spotlight. The fund faced a flood of redemption requests far beyond its limits. It halted withdrawals and merged its troubled closed fund with a public one, masking losses and locking investors into an asset at roughly a 20% discount to Net Asset Value. Officially an operational tweak, but in reality, an attempt to stop a run. Only about 6% of redemptions were fulfilled, showing the portfolio is weaker than reported. The main problem isn’t the losses – it’s the collapse of trust. When investors can’t see inside portfolios and managers hide risks behind structural reshuffles, the market runs like a late-cycle system: outflows fuel stress, stress fuels outflows. The Blue Owl case shows cracks in private credit are widening. With liquidity tight and delinquencies rising, such episodes could be the start of a much broader stress test for the entire financial system. The clock is ticking.


Portfolio Allocation (as of Feb 27, 2026) $HOOD – 1.16% $IEF – 46.81% $IGV – 21.98% $MSFT – 18.76% $NKE – 2.97% $ORCL – 2.78% $PLTR – 3.67% $SOFI – 1.87% Portfolio Structure: Allocation: $5.23m – $2.78m equity, $2.45m bonds. Leverage: 1.87x. Free cash: 73.7%. - - - - - - - - - - - - - - - - - - - - - - - - - - - - - - - - Part for those who want to dig into the details. What is important to understand when looking at the weekly data: 1️⃣ AUM ≠ allocation Example on S&P 500 instruments: 1% AUM in $SPY = 1% allocation 1% AUM in $SSO (2x $SPY) = 2% allocation 1% AUM in $UPRO (3x $SPY) = 3% allocation 1% AUM in LEAPS options on $SPY, ITM, ~80% delta = 4-5% allocation And so on. 2️⃣ You see the actual allocation of positions Example in 4 steps: 1. The first position is opened at 1% of AUM → you will see it with a 100% allocation. 2. A second position is opened at 1% of AUM → you will see two positions at 50% each. 3. A third position is opened at 2% of AUM → you will see one position at 50% and two at 25% each. 4. A fourth position is opened at 1% of AUM → you will see one position at 40% and three at 20% each. At the same time, remaining cash is 95%. - - - - - - - - - - - - - - - - - - - - - - - - - - - - - - - - At first, this may seem complex. But once you understand the logic and follow it over time, it becomes clear why professionals use this approach. Eventually, you will start looking at the weekly portfolio updates through their lens.

