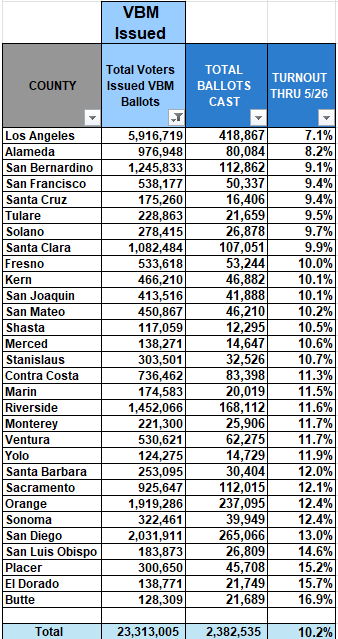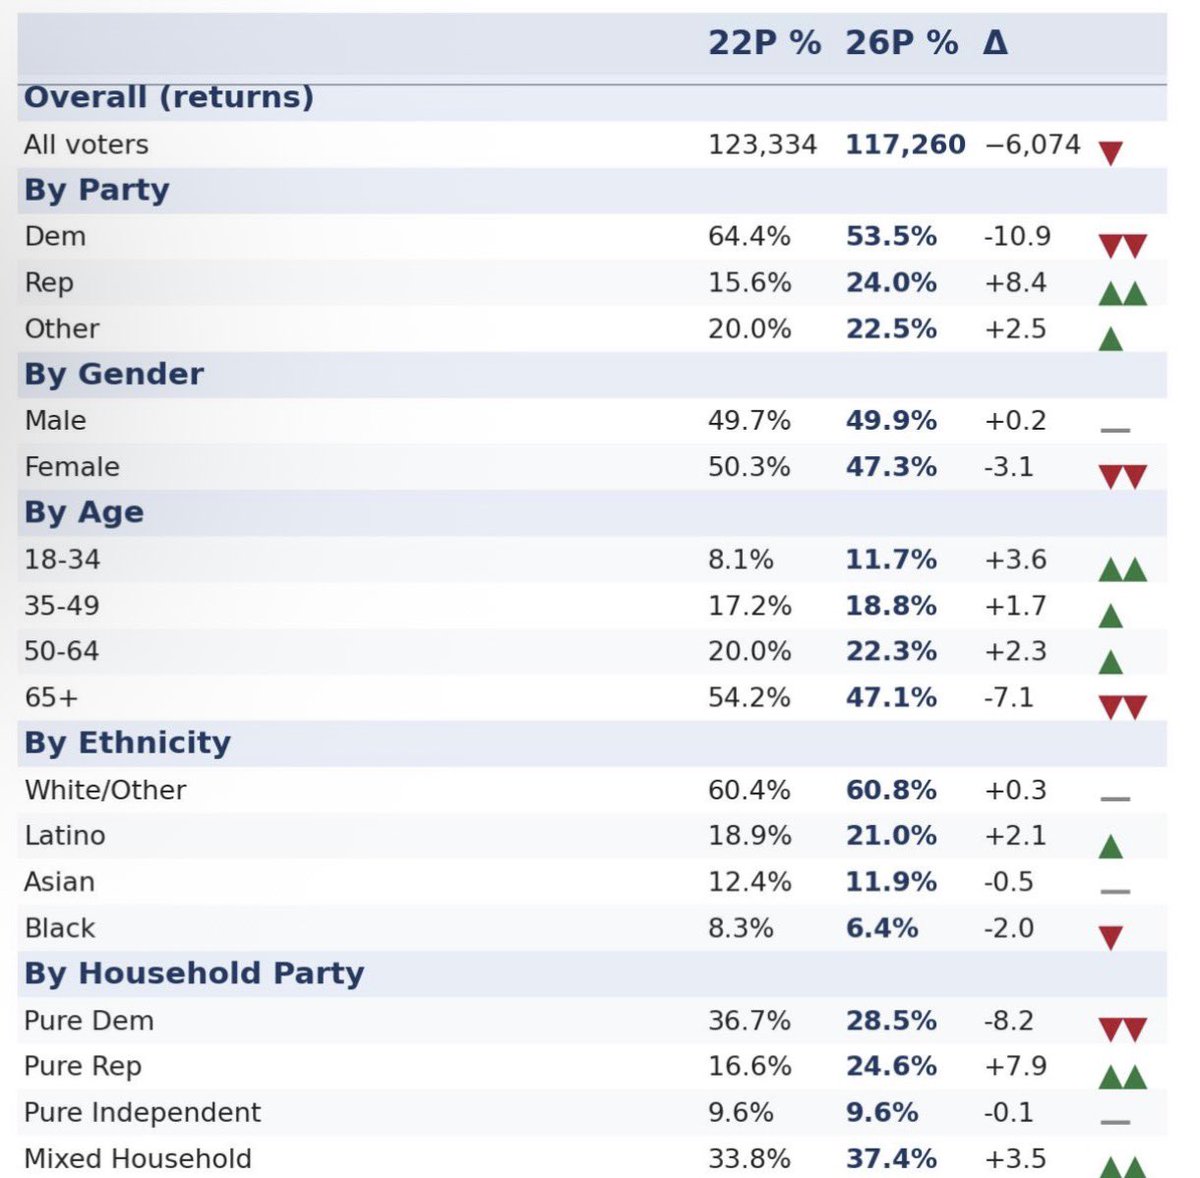

Folks who have signed up for the ballot tracker today got a detailed comparison to 2022 Primary.
As an example, in the LA Mayoral race, Dem share of vote is down 11pts and Rep turnout is up 8.5%.
But you can see the real drop is Seniors and Dem seniors specifically.
When an election reform like the Top Two has more impact on voter’s choices than each candidate’s positions on issues…
and voters resort to “strategic voting” to overcome or to take advantage of the reform…
then that reform has failed.
capitolweekly.net/ca120-californ…
@AlterEgon75@WinWithJMC Dem wave comes when Reps overperform in early votes and Dems overperform in late. I think this is going to be a big blue shift in the late votes since a lot of older Dems are holding on to their ballots.
CALIFORNIA EARLY VOTING TURNOUT
(Data from @Political_Data)
As of tonight: 1455K (41-37-22% D/R/I)
As this point in 2022, 1210K voted (54-26-20% D/R/I)
These percentage have been steady for the past two weeks.
This am 1,500 of CA’s top politicos and electeds got their latest free Early vote update texted or emailed to them.
900k returns statewide and you can get this for any political geography in CA.
Check out: tracker.politicaldata.com
Get updates: tracker.politicaldata.com/subscribe
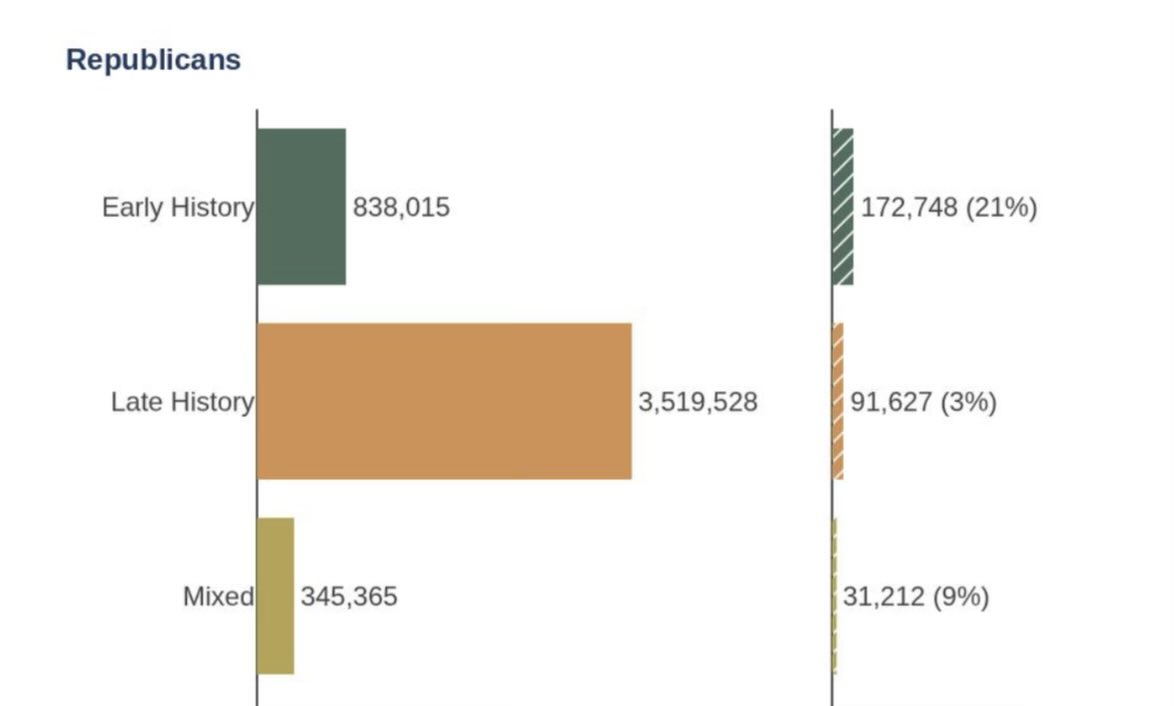
The big number is from Republicans who regularly vote early, they are already at 21% turnout!
This shows the power of this data. For weeks @Political_Data clients have been mailing and phoning these early voters… it can make the difference on Election Day
2/2
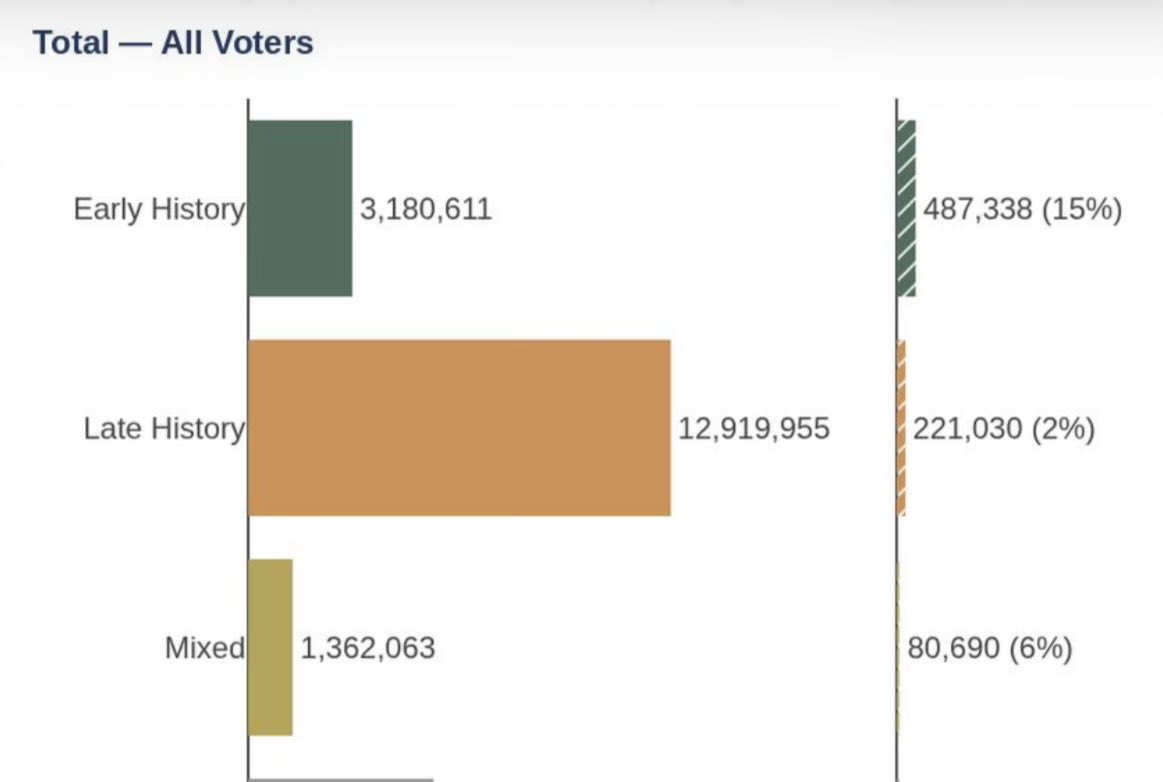
For those who are getting the PDI Ballot Tracker you’ll see a new page showing the return rates by ballot return scores, which breaks out the 3% turnout by prior voting behavior.
Among those who regularly vote early, turnout is already 15%. 1/2
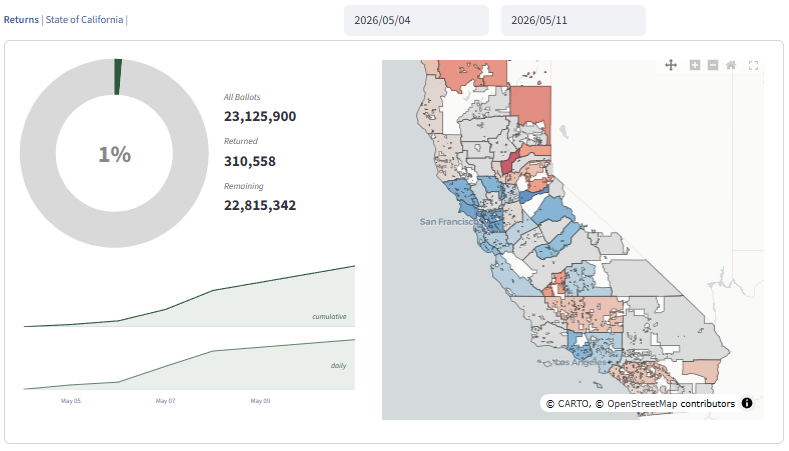
Latest CA Ballot Returns — State of California via @political_data
Total 1% returned, 310,558 of 23,125,900
Dem 1%, 127,867 of 10,384,760
Rep 1%, 111,959 of 5,780,571
Ind/Oth 1%, 70,731 of 6,960,569 tracker.politicaldata.com/?type=statewide
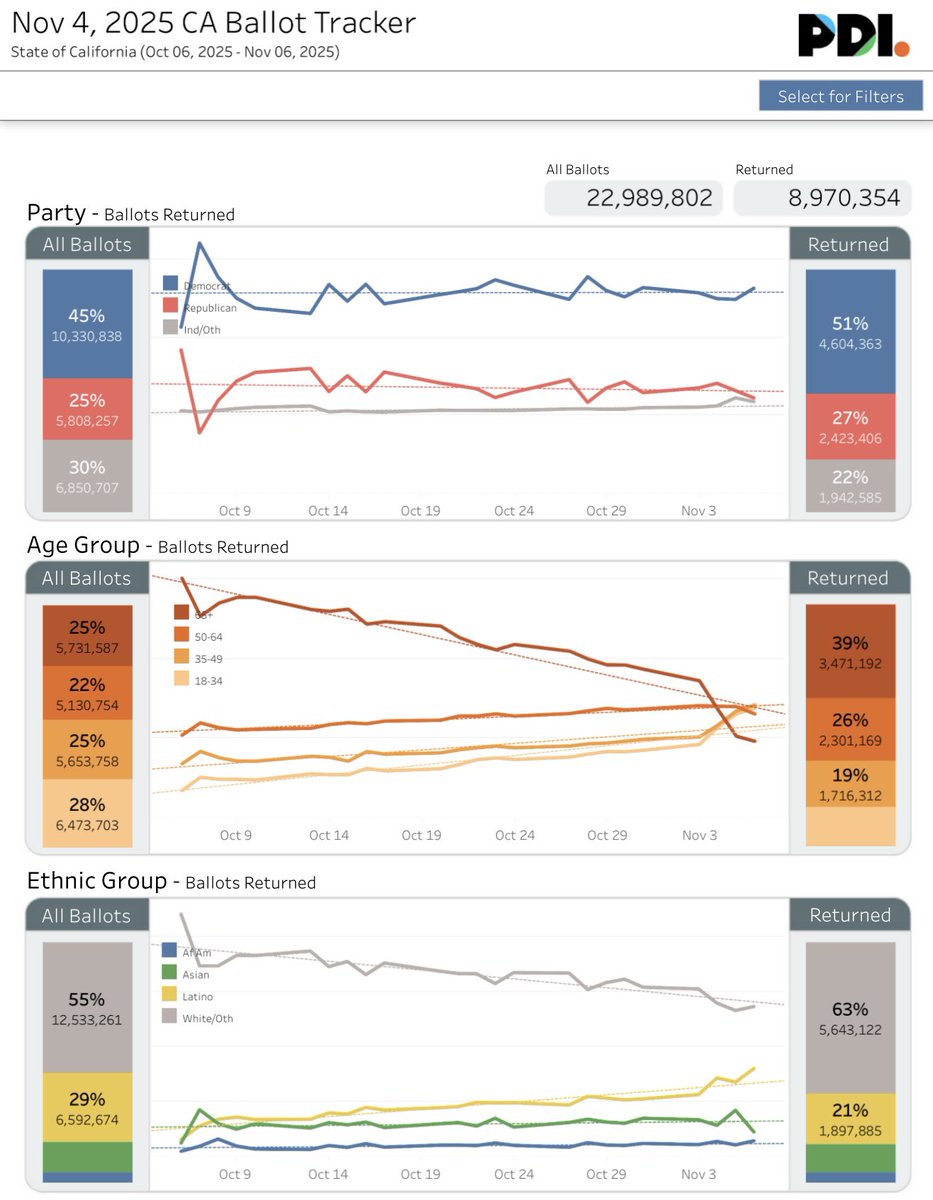
The data from @Political_Data shows almost 9 million ballots in as of yesterday, and @CASOSVote shows nearly 9m votes totaled.
If you presume Reps were 90%+ no, Dems 90% yes, then math would suggest Independents were like 55% yes, 45% no. Exactly what polling was showing.
Who got more press in CA over the past month - Dems running for Governor OR the guy who I heard drew the maps for #Prop50 (I heard this might have been @paulmitche11)…
According to latest data from PDI young Latinos, our single largest demographic category, are not being targeted by Yes on Prop 50 to turn in their ballots. Yet in a recent poll by @LatinoCommFdn they have the strongest support for prop 50 at + 41. I don't know what the Yes on Prop 50 young Latino strategy is, but I know it's not good... 👇🏽
The emailed tracker is getting a couple more pages!
P3 - Rate of returns for voters who are either flagged as regular early or late voters, or no early voting history.
P4 - A fulller breakdown and mapping or returns by Eth/Race
Signup here: docs.google.com/forms/u/3/d/e/…
@Political_Data Not to be pedantic but it literally says 4 percent in what you circled. Also I see someone else already alerted you to the issue with the Asian and Latino totals matching, which they correctly identified as the Asian totals being off.
On Nov 4 Voters will decide if California should go forward with new Congressional district maps in response to Texas and other Red states' mid-decade redistricting plans. We spoke with @paulmitche11, who drew the proposed maps, about the process
capitolweekly.net/mapmaker-paul-…
She blathered on @NewsHour at start of race how it could be close, big money, Arnold blah blah blah
I suggested speaking to actual voters in California, where Democratic majority, led by grassroots organizers, hasn’t had chance for a say in national politics in years
Hence…
☮️