JYT
21 posts


JYT
@PyckoffChart
Wyckoffian Trader. Dev of Pyckoff Chart (Point & Figure Chart, Volume Figure Chart) and Tradeboxer. https://t.co/5E7DrSAMx5


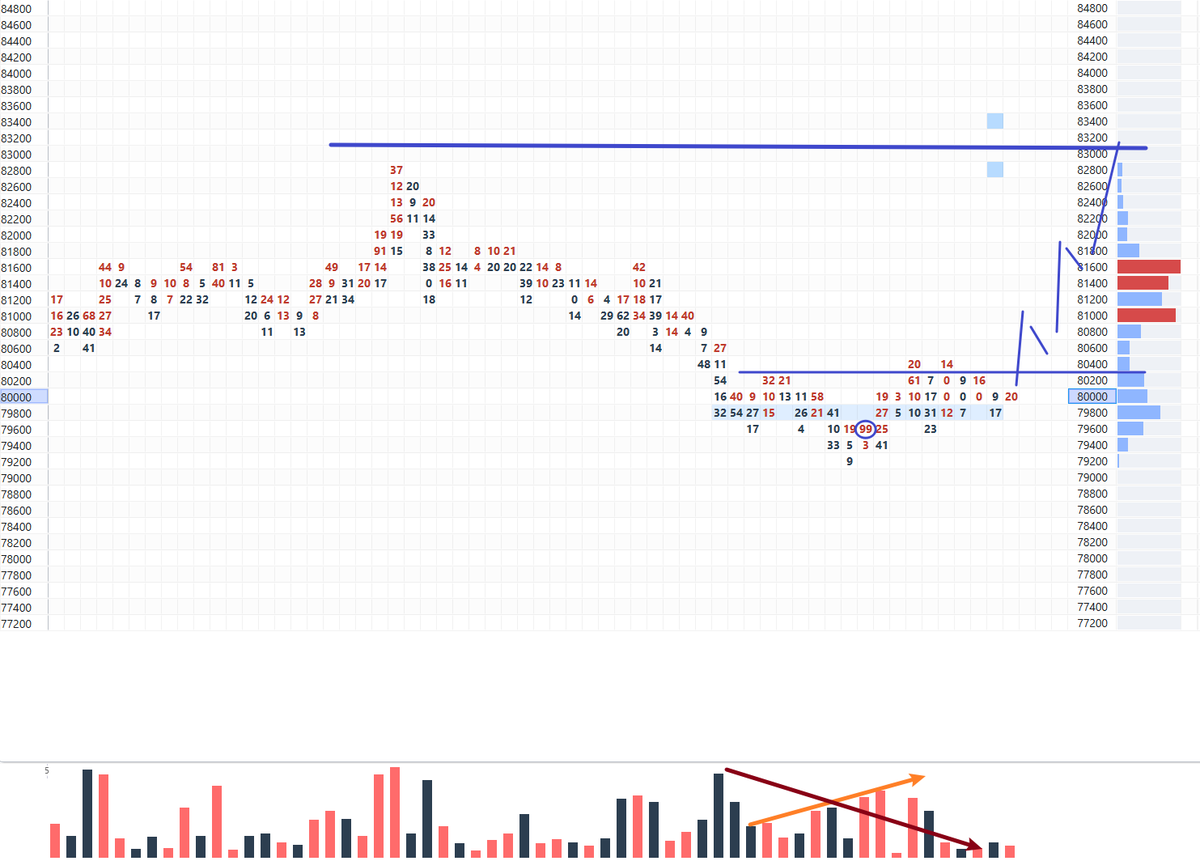


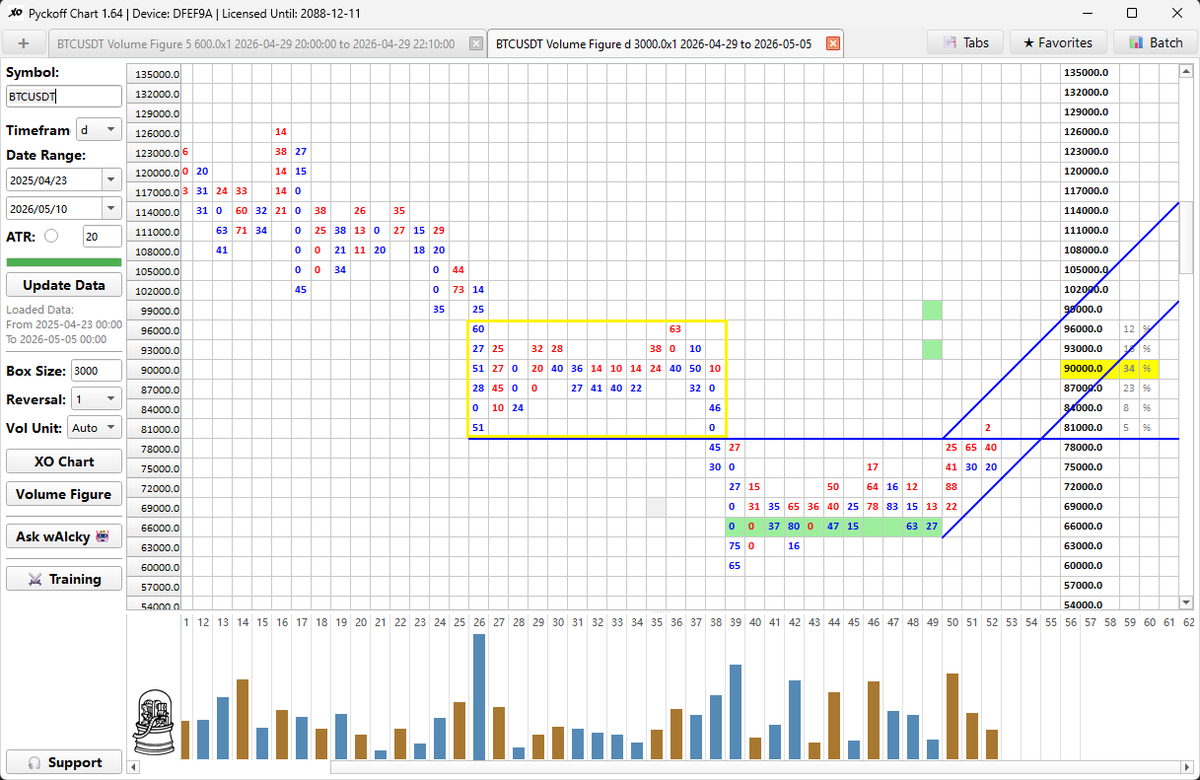
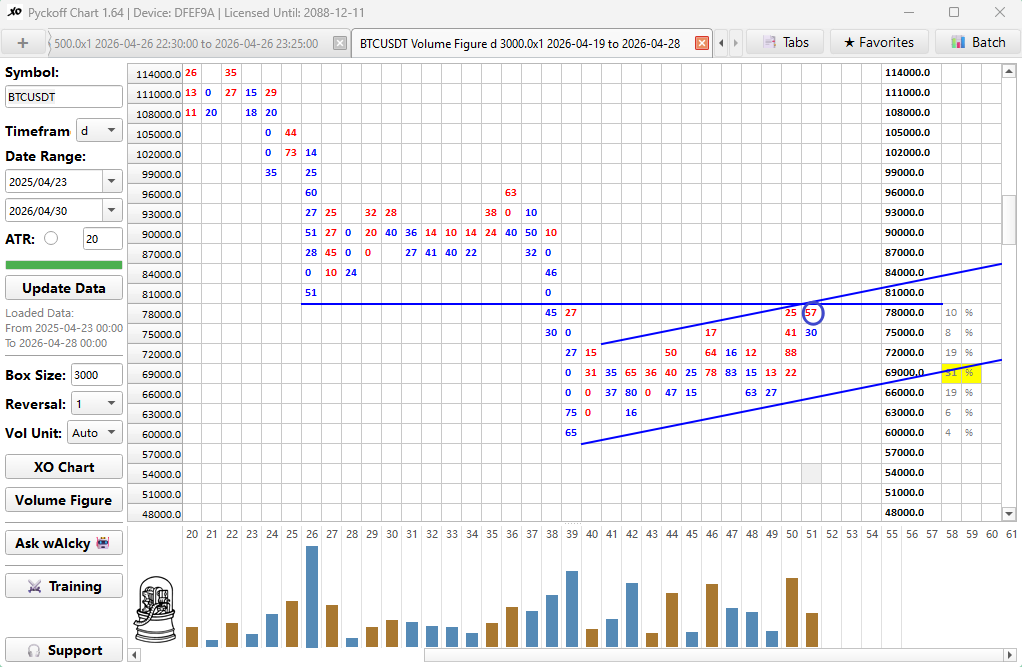
The number 57 shows supply is getting in, which is normal considering where it is under the structure of supply confluence. However, from the 600*1 chart we find out that the buyers are retreating, the small trading range under 80K would be a distribution area, which depicts a retracing to 75K, but for the bigger picture of 3000*1 chart, back to 75k wouldn't sabotage the structure of an mid-term accumulation, as long as the 75k holds, everything is fine for bulls.


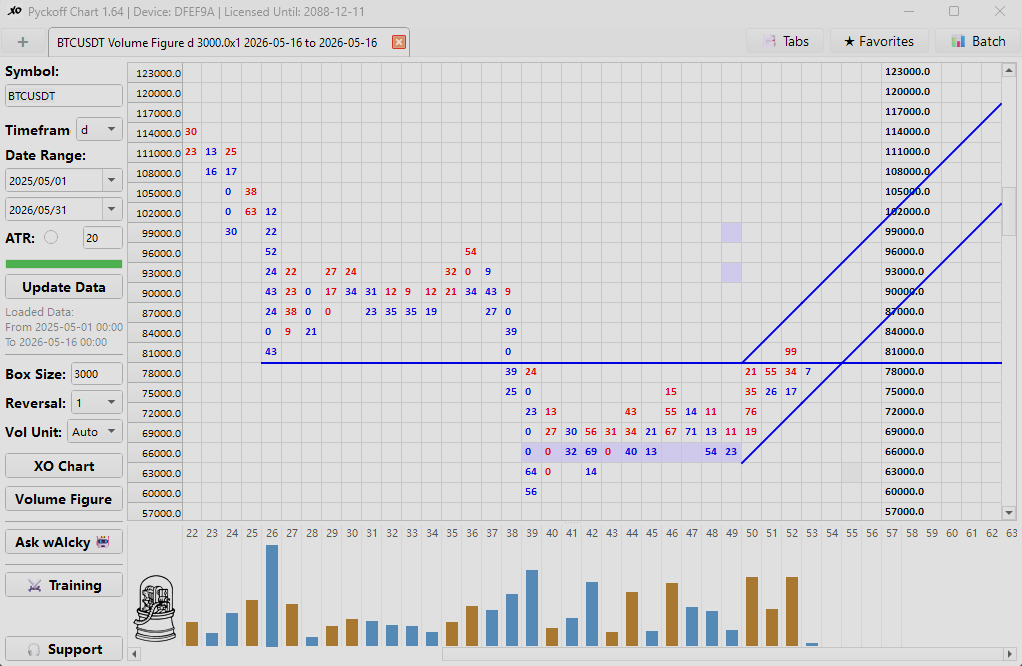
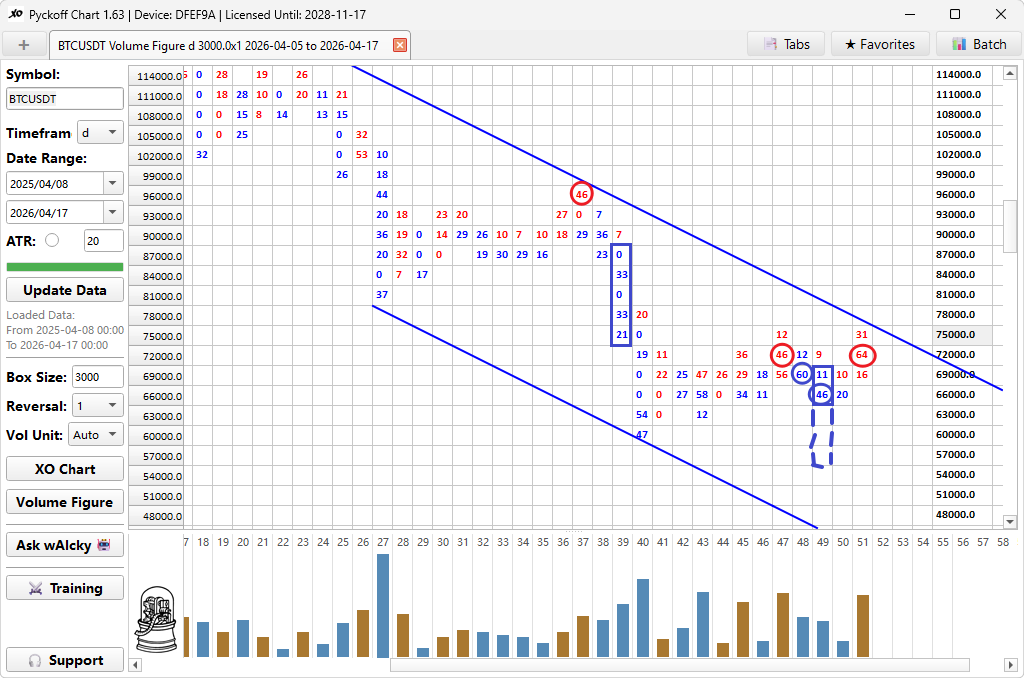
By comparing the recently completed Column 51 with the previous Columns 45 and 47, we observe that volume has been steadily increasing. In Column 51, demand achieved a 4-box upward progression, with the highest number in this column (64) appearing at the bottom. This indicates that the most intense battle with supply has ended, and demand has now gained the upper hand, and structurally, the price has broken through the horizontal resistance level and the upper boundary of the trend channel. The scenario that would continue to favor the bulls is as follows: the price pulls back at most to 72K and then reverses back toward 75K. If a small number (ideally less than 10) is recorded in the 72K box, this would be a very clear sign of supply exhaustion. This would constitute a successful backup test and present an excellent opportunity for long entry. If, the reaction just stayed in the 75K, then pulls back 78K, leave either a small or a big number in the 75K box, it's an even better one.
By comparing the recently completed Column 51 with the previous Columns 45 and 47, we observe that volume has been steadily increasing. In Column 51, demand achieved a 4-box upward progression, with the highest number in this column (64) appearing at the bottom. This indicates that the most intense battle with supply has ended, and demand has now gained the upper hand, and structurally, the price has broken through the horizontal resistance level and the upper boundary of the trend channel. The scenario that would continue to favor the bulls is as follows: the price pulls back at most to 72K and then reverses back toward 75K. If a small number (ideally less than 10) is recorded in the 72K box, this would be a very clear sign of supply exhaustion. This would constitute a successful backup test and present an excellent opportunity for long entry. If, the reaction just stayed in the 75K, then pulls back 78K, leave either a small or a big number in the 75K box, it's an even better one.
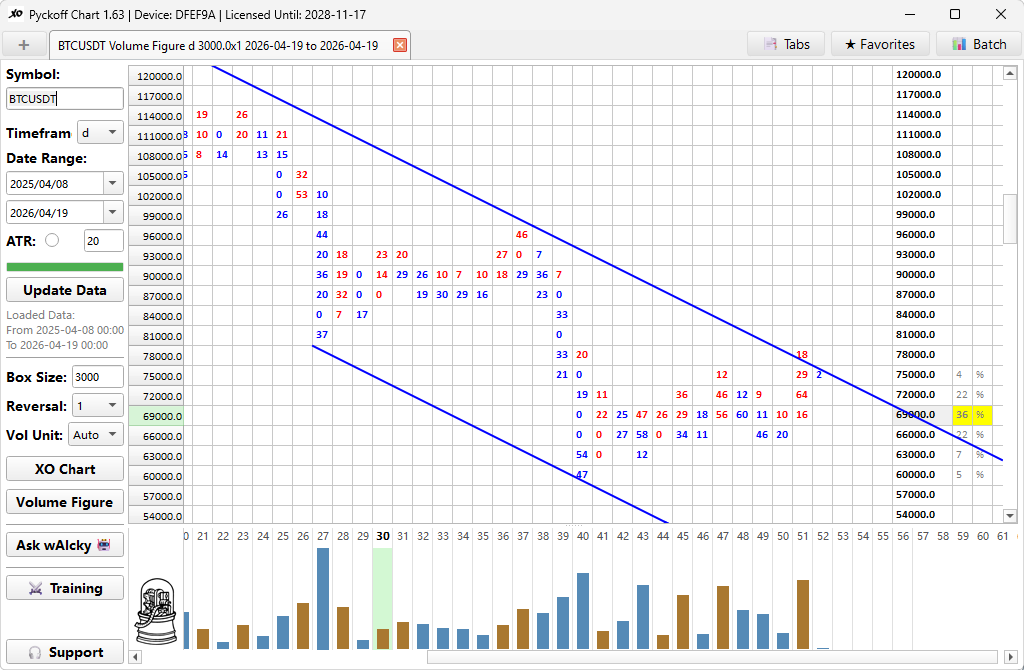
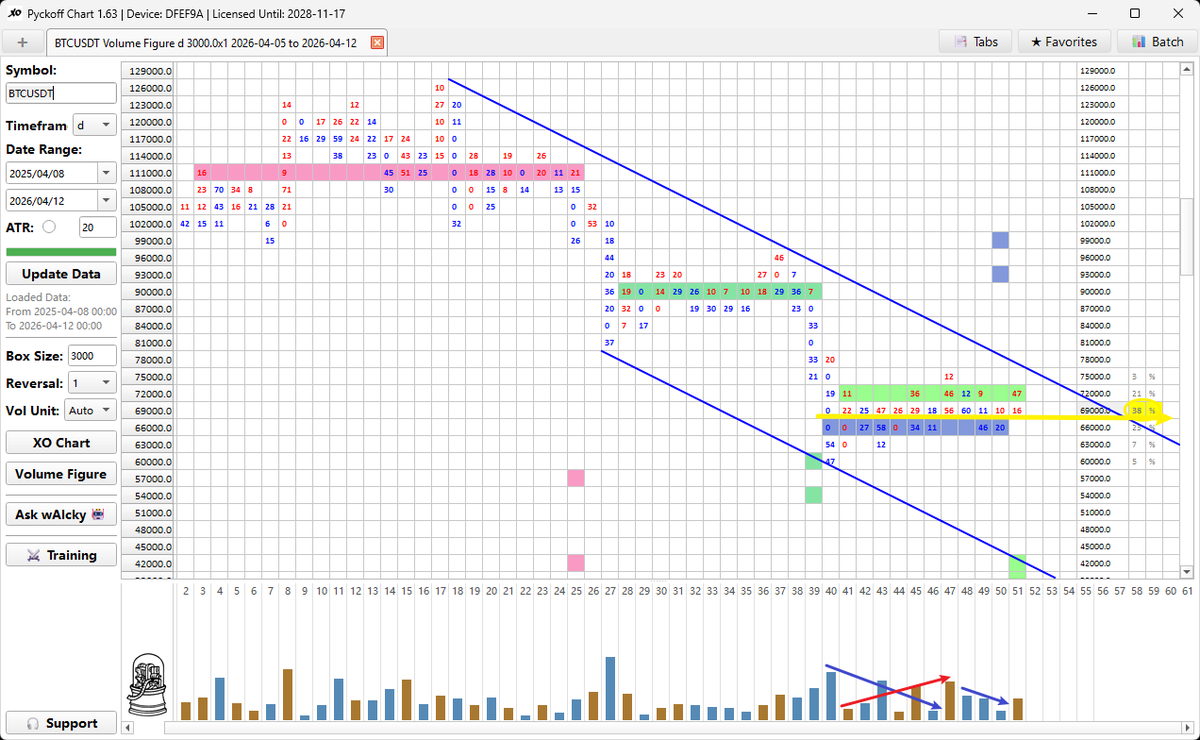
Facts can be read from the Chart: 1. In the current trading range, supply is dying out, demand is getting stronger; 2. Price now is above the 69k where the most trades happened; 3. Targets of the distribution of the top and the continuation had reached; 4. The accumulation has got enough power for pushing it to 96k-10k area; 5. Now we are in 72K box, encountered a lot of supply(that 47 implies), which is normal, because 75K is the confluence of supply area combined with down trend channel and trading range upper boundary. I assume that 75k will be breached base on above 1,2,3,4, yet according to 5, we need to observe if the supply dies out when price react to the 69k box. If the supply dies out at 69Kish, it's an opportunity to entry, aiming to 96K.
Facts can be read from the Chart: 1. In the current trading range, supply is dying out, demand is getting stronger; 2. Price now is above the 69k where the most trades happened; 3. Targets of the distribution of the top and the continuation had reached; 4. The accumulation has got enough power for pushing it to 96k-10k area; 5. Now we are in 72K box, encountered a lot of supply(that 47 implies), which is normal, because 75K is the confluence of supply area combined with down trend channel and trading range upper boundary. I assume that 75k will be breached base on above 1,2,3,4, yet according to 5, we need to observe if the supply dies out when price react to the 69k box. If the supply dies out at 69Kish, it's an opportunity to entry, aiming to 96K.
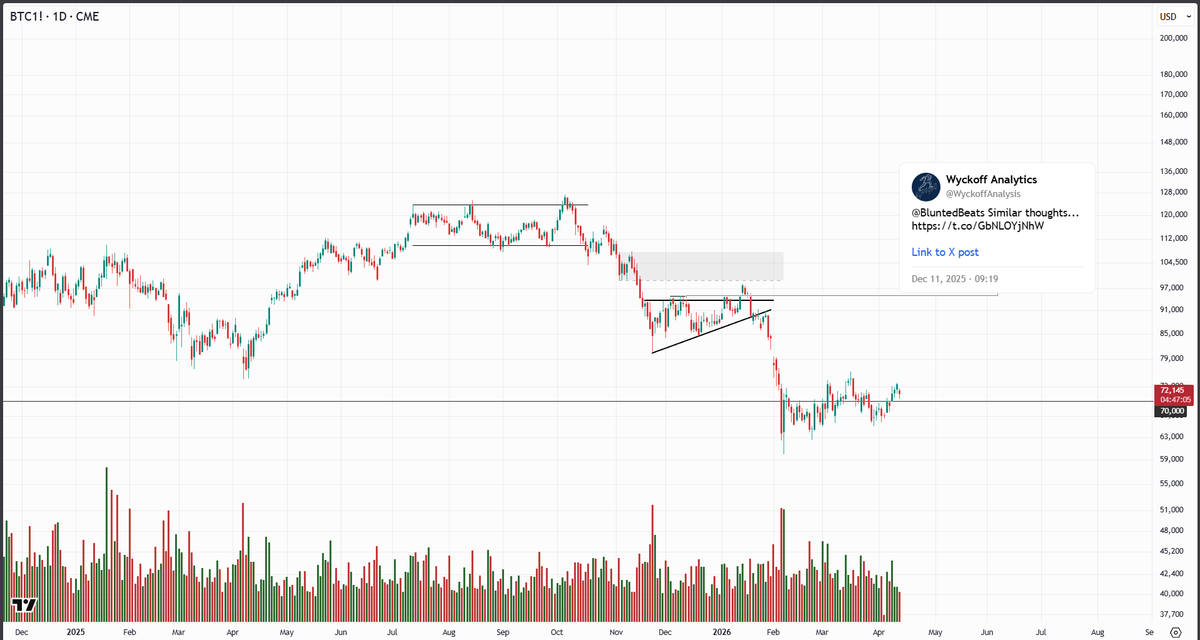
@BluntedBeats Similar thoughts...

Facts can be read from the Chart: 1. In the current trading range, supply is dying out, demand is getting stronger; 2. Price now is above the 69k where the most trades happened; 3. Targets of the distribution of the top and the continuation had reached; 4. The accumulation has got enough power for pushing it to 96k-10k area; 5. Now we are in 72K box, encountered a lot of supply(that 47 implies), which is normal, because 75K is the confluence of supply area combined with down trend channel and trading range upper boundary. I assume that 75k will be breached base on above 1,2,3,4, yet according to 5, we need to observe if the supply dies out when price react to the 69k box. If the supply dies out at 69Kish, it's an opportunity to entry, aiming to 96K.


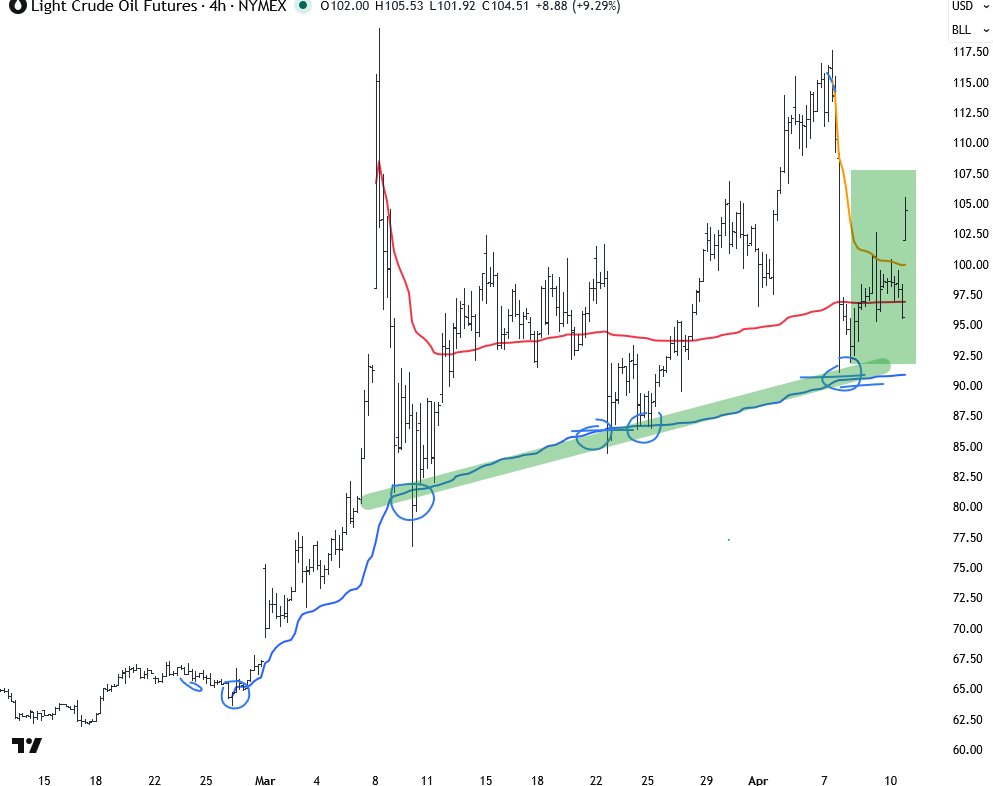
Oil is coming into a level of interest that has been support since the conflict began. $CL_F $USO It would not surprise me to see it find buyers in this area again as the conflict has not been solved just a 2 week cooling off.