
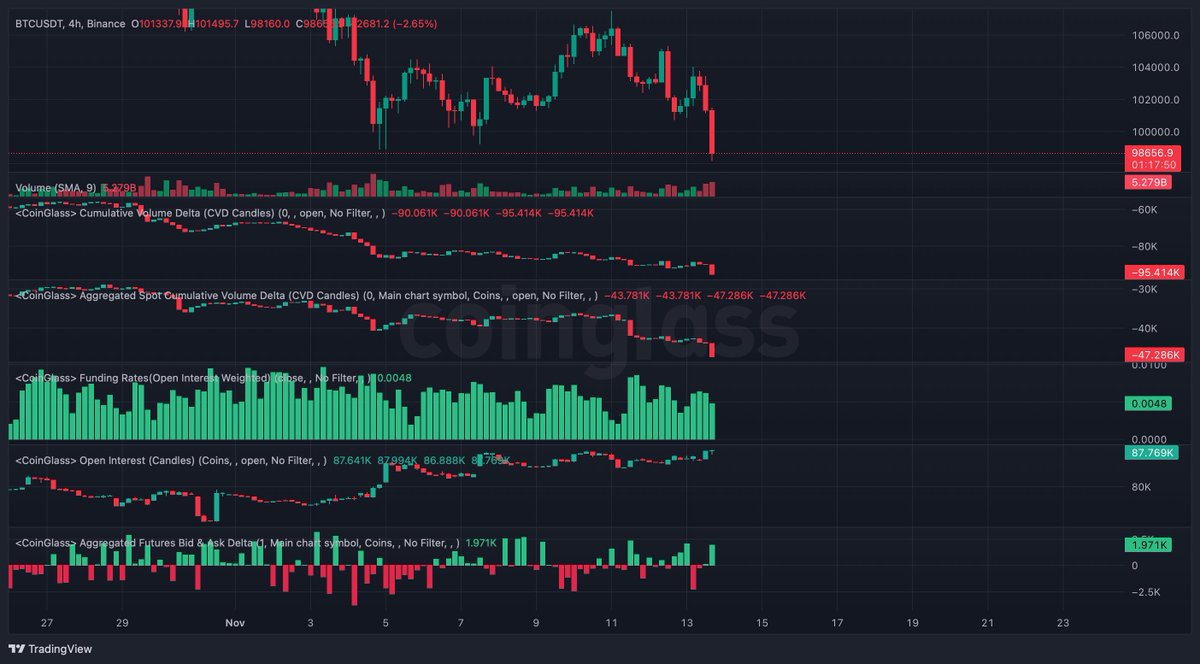
$BTC Update – November 12, 2025 Another successful BTC analysis for the books ✅ This is why 99% of traders fail and the next plan: I saw a lot of people earlier longing the flip of the so, called support and resistance zone. The reality is this: your S/R zone means nothing if your higher-timeframe bias isn’t aligned. You need the weekly and monthly charts flowing in the same direction, otherwise, you’ll end up longing a daily wick, mistaking it for a reversal, just because lower-timeframe noise threw you off. The plans were clear, and we had multiple chances to enter, so what’s next? Current Market State Price: $101,770 Previous Local High: $105,297 Pullback: ~3.3% from peak 1. Cumulative Volume Delta (CVD) General CVD: -397K (red line declining) Spot Aggregated CVD: -361K (red line declining) What this means: Sustained net selling pressure since October highs. Large players (institutions/whales) have been offloading while retail likely accumulated. This is classic distribution. 2. Funding Rates Current: 0.0054 (0.54%) Historical context: Spikes to 0.015-0.02 marked previous tops at $114K and $105K Key observation: Still positive but moderate What this means: Longs are still paying shorts, meaning most traders remain net-long despite the drop. No capitulation yet, trapped longs haven't been flushed out. 3. Open Interest (OI) Current OI: $32.5B (shown in blue box comments, bottom left) Recent trajectory: Peak: ~$37B (late October, around price top $114K) Current: $32.5B Net decline: ~$4.5B (~12% drop) ETF flows: Critical observation: Heavy institutional selling Oct 29 - Nov 7 (aligns with price drop from $114K → $101K) Strong reversal inflow Nov 11 (+$524M) – this is significant This could be: A) Smart money buying the dip B) Short-term bounce before continuation lower My Specific Recommendation for You Stage 1: Next 48 Hours (Stay Flat, me) Monitor ETF flows on Nov 12-13 Watch $100K level closely If clean break below $100K → move to Stage 2A If bounce starts → move to Stage 2B Stage 2A: Breakdown Confirmed Short retest of $100K as resistance Target $35-98K Stop above $102K Size: 50% normal position Stage 2B: Bounce Develops (Most Likely) Wait patiently for $103-106K Short on clear rejection with:Bearish H4 candle closes Resumed ETF outflows Funding spike showing renewed speculation Targets: $98K → $95K → $90K Stop: $107-108K Size: Full position (better setup) Stage 3: If Wrong (Breakout Above $110K) Wait for new setup, checkout YouTube video for the overall breakdown. Which scenario am I following, and exactly in more detail? In the comments of this post there’s a YouTube video, I upload weekly videos to my Telegram group for free.