Concrete Capital

810 posts

Concrete Capital banner
Concrete Capital

Concrete Capital

@ReWanderer1

Real estate by day. Markets after hours. Tracking the asset economy: real estate, stocks, rates, wealth. 📊 Data over narratives.

Katılım Mayıs 2022
475 Takip Edilen195 Takipçiler
Sabitlenmiş Tweet
Concrete Capital
Concrete Capital@ReWanderer1·
🏙️ GTA Real Estate Snapshot 
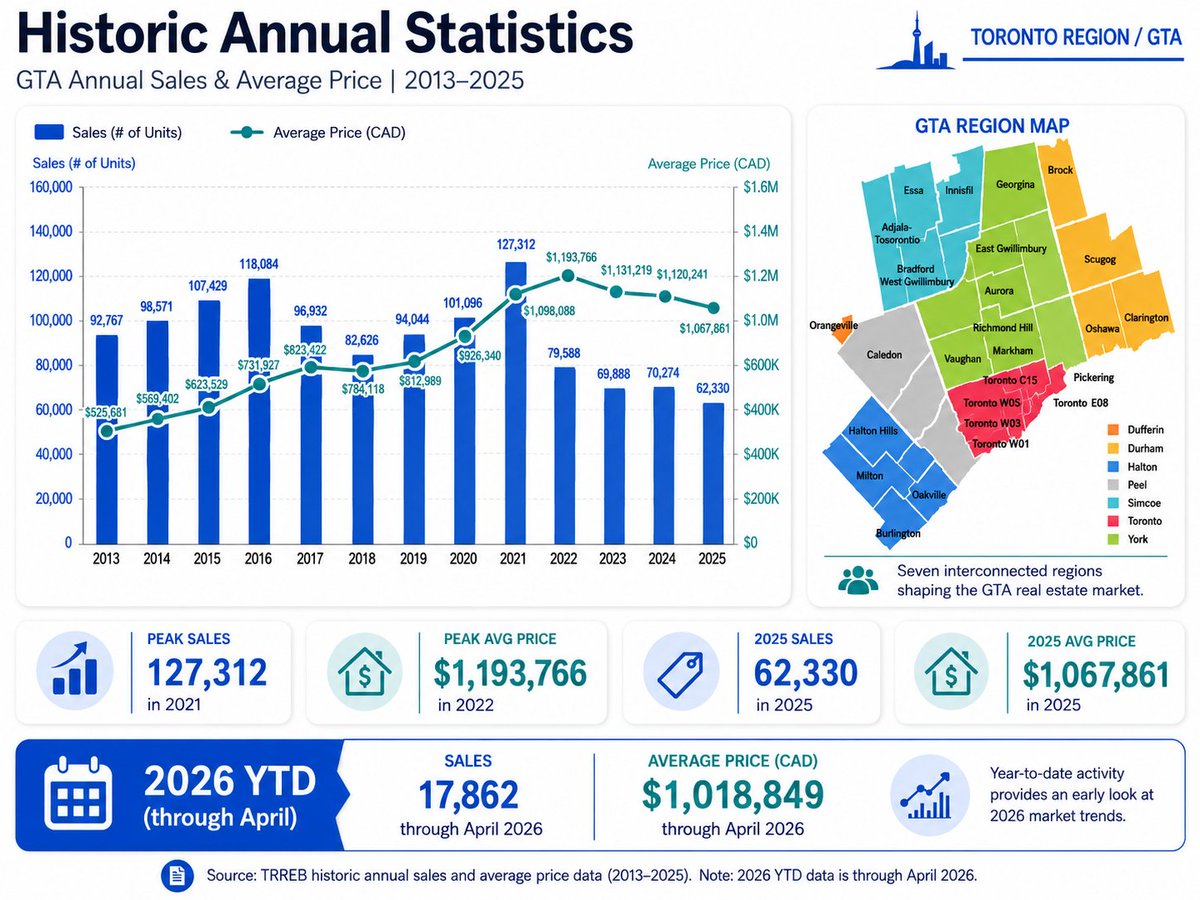
📊 2013–2025 + 2026 YTD 🏆 Peak sales: 127,312 in 2021 💰 Peak avg price: $1,193,766 in 2022 
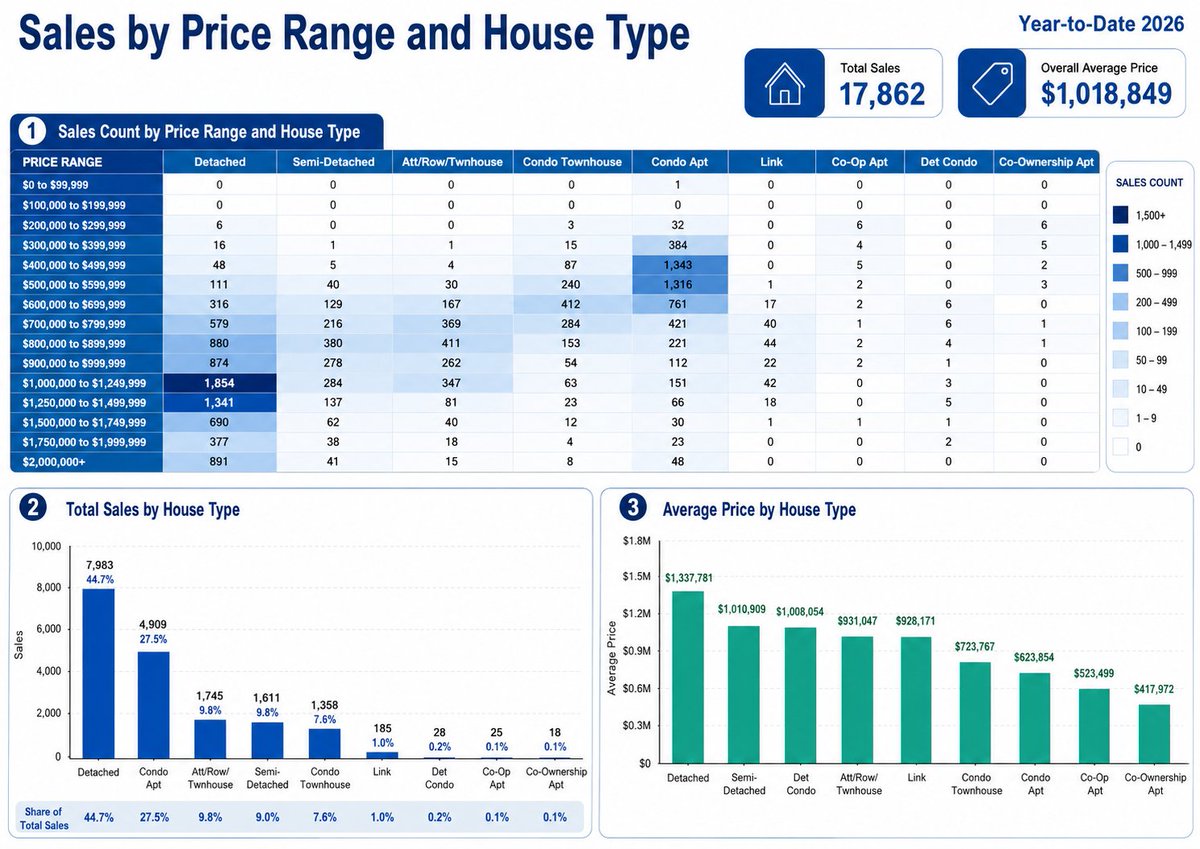
📅 2026 YTD through April 🏠 Sales: 17,862 💵 Avg price: $1,018,849 Full visual breakdown 👇 #TorontoRealEstate #GTAHousing
Concrete Capital tweet media
English
0
0
1
57
Brian Feroldi
Brian Feroldi@BrianFeroldi·
The best diet is the one you'll stick with. The best investment plan is the one you'll stick with. The best exercise routine is the one you'll stick with. Consistency & sustainability are far more important than optimization.
English
19
7
74
8.1K
Concrete Capital
Concrete Capital@ReWanderer1·
@Smartnetworth1 The problem isn’t that people buy iPhones. It’s that they skip the iPhone, save the money, and then let it sit there while everything they wanted gets more expensive. Sacrifice without allocation is just delayed frustration.
English
0
0
3
26
Nick | Dividend Investor & Educator
When you’re trying to build wealth, small sacrifices go a long way You don’t need the new car. You don’t need the new iPhone. You don’t need the fancy clothes.
English
19
8
68
2.7K
Concrete Capital
Concrete Capital@ReWanderer1·
@saylordocs 1916 version: Survive childhood Work until your body quits Enjoy 3 good summers Die from something now treated with antibiotics The scam had worse branding back then.
English
0
0
1
37
Documenting Saylor
Documenting Saylor@saylordocs·
- Study for 20 years - Work for 40 years - Free for 5-10 years - Die It's a scam.
English
8
14
74
2.7K
Concrete Capital
Concrete Capital@ReWanderer1·
🏙️ Toronto/GTA Economic Snapshot 📅 April 2026 🇨🇦 Canada-wide indicators 📊 GDP: +0.2% 🛒 Inflation: 2.4% 🏦 Overnight rate: 2.25% 💳 Prime rate: 4.45% 🏠 Posted mortgage rates: 5.49%–6.09% 📍 Toronto labour market 👷 Employment: +7,500 jobs 📌 Unemployment: 8.2% Full visual breakdown 👇 #TorontoRealEstate #GTAHousing
Concrete Capital tweet media
English
0
0
1
32
Concrete Capital
Concrete Capital@ReWanderer1·
🏙️ Toronto/GTA Market Snapshot 📅 Year-to-Date 2026 🏠 Total Sales: 17,862 💰 Avg Price: $1,018,849 Top sales by house type 👇 🏡 Detached: 7,983 | 44.7% 🏢 Condo Apt: 4,909 | 27.5% 🏘️ Att/Row/Townhouse: 1,745 | 9.8% 📊 Full price range + house type breakdown in the chart 👇 #TorontoRealEstate #GTARealEstate #TorontoHousing #RealEstateData
Concrete Capital tweet media
English
0
0
1
36
Concrete Capital
Concrete Capital@ReWanderer1·
🏙️ Toronto/GTA Housing Snapshot 📅 April 2026 📊 Sales YoY 🏠 Detached +9.2% 🏢 Condo Apt +9.1% 💰 Avg Price YoY 🏠 Detached -4.1% 🏘️ Townhouse -7.9% 🏢 Condo Apt -6.3% 📍416 vs 905 breakdown in the chart 👇 #TorontoRealEstate #GTARealEstate #TorontoHousing
Concrete Capital tweet media
English
0
0
1
28
Concrete Capital
Concrete Capital@ReWanderer1·
Directionally right, but the causal story needs one correction: the post-2020 electricity CPI surge is not only AI. It started with fuel/wholesale power shocks, inflation, utility capex, distribution/transmission upgrades, storm hardening and capacity markets. AI is the accelerant, not the only spark. The scary part is the forward curve: data centers were already ~4.4% of U.S. electricity use in 2023 and are projected to reach 6.7–12% by 2028. Grid planners are now talking about 100+ GW of new load this decade, much of it from data centers and manufacturing. So yes: electricity is becoming a strategic resource. But the policy answer is not “stop AI.” It’s: make hyperscalers bring or pay for additional firm power, storage/flexible load, grid upgrades and transmission— so households don’t subsidize the buildout through higher bills.
English
0
0
2
14
Nicholas Mugalli
Nicholas Mugalli@RealNickMugalli·
🇺🇸🤯 The US electricity CPI just hit 307. Look at the chart. From 2016 to 2020 it barely moved. Then the line went vertical after the AI buildout boom started and hasn't stopped. This is the hidden tax on everything. Every data center, every EV charge, every manufacturing facility, every home. The AI buildout requires hundreds of gigawatts of new power capacity—and the grid is being asked to supply it while demand is already outrunning supply. The price reflects that. Electricity is no longer a utility bill. It is a strategic resource…
Nicholas Mugalli tweet media
Nicholas Mugalli@RealNickMugalli

Construction spending on data centers just hit $50B annualized. In 2018 it was $6B. That curve is not AI. The first half of it — 2018 through 2022 — is cloud. AWS, Azure, Google Cloud fighting for enterprise workload migration. The line moves but it is controlled, deliberate, cyclical infrastructure investment. Then 2023 happens and the line goes vertical. What changed in 2023 was not demand — it was the visibility of demand. Every hyperscaler suddenly had a 10 year reason to build as fast as physically possible. The $1.5T combined cloud backlog did not exist in 2022. The race to 10 gigawatts of AI compute did not exist in 2021. The construction spending curve is just the physical manifestation of commitments that were made in boardrooms starting in late 2022 and are now showing up in concrete, steel, and power infrastructure. $50B annualized is not even the top yet. Every hyperscaler has guided higher capex in 2026 than 2025…maybe the sky is the limit as the old saying goes…

English
1
1
4
489
Concrete Capital
Concrete Capital@ReWanderer1·
@Tablesalt13 “Canada has never been more affordable” When insolvencies hit the highest Q1 level since 2009, it is worth asking affordable for whom.
English
0
0
3
57
Tablesalt 🇨🇦🇺🇸
NEW: More than 37,000 Canadians filed for insolvency proposals in first 3 months of 2026, highest since 2009 "Canada has never been more affordable" -Mark J. Carney
English
16
88
572
7.6K
Concrete Capital
Concrete Capital@ReWanderer1·
@NotA_Bull Cheap on P/E, expensive on future FCF. $META is guiding $125B–$145B of 2026 capex, Reality Labs is still burning ~$4B/qtr, and regulatory risk is not going away. Cheapest headline multiple? Maybe Cheapest risk-adjusted Mag 7? Probably not
English
0
0
0
759
Evan | Investments
Evan | Investments@NotA_Bull·
$META is basically flat for the last year. Is it trash, or a buying opportunity after a long consolidation?
English
26
3
93
14.5K
Concrete Capital
Concrete Capital@ReWanderer1·
@InvestingCanons Mastering emotions is easy. It’s the “not checking the portfolio after one red candle” part that needs work.
English
0
0
2
49
Investment Wisdom
Investment Wisdom@InvestingCanons·
“To master investing you need to master your emotions.” — Peter Lynch
Investment Wisdom tweet media
English
15
137
1.2K
23.8K
Concrete Capital
Concrete Capital@ReWanderer1·
Morning market read ☀️ Tech is bouncing 📈 Oil is cooling 🛢️ Dip buyers are back 💵 But this is still not a clean risk-on setup. Inflation is hot. Yields are elevated. Iran/oil risk is still alive. Credit and liquidity must stay calm. For now: tactical bounce, not full confirmation. ⚠️ #Markets #Stocks #Macro #Inflation #Oil #Bonds
English
0
0
1
31
Concrete Capital
Concrete Capital@ReWanderer1·
People keep calling this a chip race. It’s also a grid race. ⚡ China has crossed 10,000 TWh of annual power generation. The U.S. is around 4,400 TWh. The AI bottleneck is moving down the stack: chips → data centers → substations → transmission → power plants 🧠 → 🏢 → 🔌 → ⚡ → 🏭
English
0
0
0
35
Nicholas Mugalli
Nicholas Mugalli@RealNickMugalli·
🇨🇳🇺🇸 The only thing China won at against the US since 1999 is that the US generated 3× more electricity than China back then. By 2024 China generates 2.5× more than the US. The lines crossed in 2011 and never looked back. Electricity is the baseline input for everything—factories, data centers, semiconductor fabs, AI training runs. The country that can generate 10,000 TWh has a structural advantage in every technology race that runs on power. Jensen Huang said inference demand will go up a billion times. Every GPU cluster, every AI workload requires electricity. China has the grid to build at that scale. The US is scrambling to add capacity while its hyperscalers have already committed $800B+ in data center capex. Chbuilt a bigger grid. That grid is now the constraint that decides who wins the next twenty years…
Nicholas Mugalli tweet media
Nicholas Mugalli@RealNickMugalli

🇺🇸🇨🇳 As Trump heads to China, it's time for a reality check on the economy. For a decade, the narrative was that China would overtake America. Every bank had a chart. Every strategist had a date. The date kept getting pushed back. Now it's gone entirely. $28.3T vs $17.7T. The gap is $10.6 trillion — and it is getting bigger every day. - United States — $28.3T. growing - China— $17.7T. stalling - Gap— $10.6T. wider than 2015 China's GDP peaked relative to the US in 2021 at roughly 77 cents on the dollar. It has fallen every year since. The property crisis wiped out $18 trillion in household wealth. The population is shrinking. Youth unemployment hit 21%. Capital is leaving. The yuan is weak. The convergence thesis that Wall Street sold for twenty years is dead. America innovated its way out of every crisis China's boosters said would end US dominance. The 2008 financial crisis. COVID. The debt ceiling. Each time the obituary was written. Each time the US economy came back larger. The AI boom — the biggest productivity revolution since electricity — is happening in California, not Shenzhen. The semiconductor ecosystem that powers the next century is in Arizona, Texas, and Ohio. The capital markets that fund it all are in New York. Trump is in Beijing to negotiate. That's the right move — you negotiate from strength, not fear. And the chart shows exactly what kind of strength he's negotiating from. America is not in decline. America is pulling away. The data has been saying this for three years. The narrative just hasn't caught up yet.

English
2
1
8
552
Concrete Capital
Concrete Capital@ReWanderer1·
@RealNickMugalli The 800M vs 19M gap matters. Not because every consumer user is worth the same as an enterprise seat. Because defaults compound. People use ChatGPT at home, then bring that habit to work. Claude can win high-value workflows. OpenAI is winning the habit layer.
English
0
0
0
36
Nicholas Mugalli
Nicholas Mugalli@RealNickMugalli·
ChatGPT has 800 million users. Claude has 19 million. A 42× gap in consumer reach between the two most cited AI labs. Here is the thing—Anthropic has never competed on consumer distribution. Claude's revenue comes from API access, enterprise contracts, and government deployments. Dario confirmed 80× annualized revenue growth in Q1. That did not come from 19 million consumer users. Who wins OpenAI or Anthropic?
Nicholas Mugalli tweet media
Nicholas Mugalli@RealNickMugalli

86.1 million downloads in one week!!! From March 15 through April 26, Anthropic's Claude Code was the dominant AI coding agent by weekly install volume—ranging between 9.9M and 13.1M downloads per week while OpenAI Codex sat in the 3.1M–4.1M range. That was the steady state for seven weeks. Then the week of May 3 happened. Codex downloads hit 86.1M — a 21× spike in a single week. The spike is a product launch effect — OpenAI released an upgraded Codex with expanded agentic capabilities—multistep autonomous coding, full pull request workflows, direct GitHub integration. Every engineering team that had been waiting for a credible autonomous coding agent from OpenAI installed it in the same week. What you're seeing in that bar is seven weeks of accumulated latent demand, released in one day. The question is what week two looks like. A 21× spike that reverts to 10–13M is a launch. One that holds above 30–40M is a category shift. Claude Code's 7.2M in the same week Codex spiked tells you the market isn't zero sum. Both products are growing at crazy rates. The developers who downloaded Codex this week are not the same people who stopped using Claude Code. The agentic coding market is expanding faster than either company can capture it. Neither side is losing yet. The war just started… We are not bullish enough folks. Jensen saying inference gonna go by a billion X, anthropic brings in billions in ARR in the first few months of the year…massive markets to say the least.

English
1
0
5
406
Concrete Capital
Concrete Capital@ReWanderer1·
@MoS_Investing Funny how the “affordability solution” always seems to involve someone else getting liquidity. Stalled condo inventory gets absorbed. Institutions get rental supply. Developers get an exit. Buyers still get priced out. Makes you proud to be Canadian. 🇨🇦
English
1
0
2
63
Concrete Capital
Concrete Capital@ReWanderer1·
@FCNightingale The creative part isn’t just the $120M haircut. It’s the split. $450M+ build. ~$190M appraisal. Floors 1–21 were ~95% leased and got the $125M Deutsche loan. Floors 22–35 were left outside the financing as the upside bet. Banks get cash flow. Equity gets hope.
English
0
0
6
123
Nightingale Associates
Nightingale Associates@FCNightingale·
Foreign lenders take $120M haircut at Brooklyn office tower. La Caisse took a $55 million write-down on a $235 million construction loan issued in 2018. EB-5 investors absorbed approximately $65 million in losses on nearly $100 million of mezzanine debt. The recapitalization helped secure a five-year, $125 million mortgage from Deutsche Bank. Cost more than $450 million to build and is now appraised at $190 million. 1 Willoughby Square Brooklyn, New York City. -TheRealDeal #commercialrealestate
Nightingale Associates tweet media
English
9
14
85
6.2K
Concrete Capital
Concrete Capital@ReWanderer1·
@Barchart This chart needs a denominator check. USD is still ~57% of global FX reserves per IMF. The ~40% number makes more sense when gold is included. So the trend is real, but the chart is making it look more dramatic than the official FX reserve data.
English
0
0
1
81
Barchart
Barchart@Barchart·
U.S. Dollar share of global foreign currency reserves have fallen to its lowest level this century 🤯📉👀💸
Barchart tweet media
English
133
785
2.7K
215.4K
Concrete Capital
Concrete Capital@ReWanderer1·
@WOLF_Financial This is less “everything is fine” and more “the buffers are still holding.” Oil has supply offsets, but inventories are falling. Consumers have jobs, but stress is building at the bottom. When the buffers go, the story can change fast.
English
0
0
1
138
WOLF
WOLF@WOLF_Financial·
JAMIE DIMON JUST WEIGHED IN ON IRAN AND THE U.S. CONSUMER On the Middle East, he called the situation "a big deal" and said "every day it gets a little worse." But he flagged the specific oil supply math keeping things from spiraling: China reduced demand by roughly 5 million barrels a day. America increased exports by 3 million. That gap has helped offset what could have been a severe price reaction. Inventories, however, are coming down. His framing on the worst-case: "The day that can become a disaster has been pushed out quite further than we thought at the beginning." On the U.S. consumer: "Lots of money, jobs, wages going up, home prices going up, stocks up." He said the top of the income distribution is spending, buying, and traveling normally. The bottom 30% are stressed "a little bit, not a massive downturn." His signal for what could actually break the consumer: "Their wages have not gone up, but more important is that they still have jobs. The day that's going to drive consumer spending lower is going to be jobs."
English
20
14
133
39.7K