
The Investment Backpacker

1.4K posts

The Investment Backpacker banner
The Investment Backpacker

The Investment Backpacker

@RealFinancialE1

| Backpacked around the world | Investor | Entrepreneur | Financial freedom through financial education | Telegram https://t.co/Ym5iMpLtKn

Portugal Katılım Mayıs 2020
1K Takip Edilen248 Takipçiler
The Investment Backpacker
The Investment Backpacker@RealFinancialE1·
@JohnOBrennan2 @Dinnyr1916 John they're inherently correlated. When accounting for monetary expansion there has been a 29% increase. In addition to money supply expansion you must also consider GDP growth which has increased 94%. That means relative to GDP spending has actually decreased significantly.
English

0
0
0
11
The Investment Backpacker
The Investment Backpacker@RealFinancialE1·
@JohnOBrennan2 @Dinnyr1916 Well it John you clearly don't understand basic economics. The money supply has increased by 71% since 2015 so the figures you provided are not relevant with as they do not account for monetary expansion. That is before we even address the allocation of the spending.
English
1
0
12
548
John O’Brennan
John O’Brennan@JohnOBrennan2·
@Dinnyr1916 What part of ‘public spending has increased from about €70 billion in 2015 to almost €140 billion in 2026’ do you not understand?
English
18
0
15
2.8K
Stuey Beef 🇬🇧🏴󠁧󠁢󠁥󠁮󠁧󠁿
A British soldier served in Northern Ireland. Risked his life. Followed orders. Came home. He is now in his 70s. Keir Starmer’s Government has decided he deserves to spend his final years in court. The IRA got the Good Friday Agreement. The veterans got Keir Starmer. Remember that next time he talks about “values.”
English
508
3.2K
13.4K
259.8K
The Investment Backpacker retweetledi
Otavio (Tavi) Costa
Otavio (Tavi) Costa@TaviCosta·
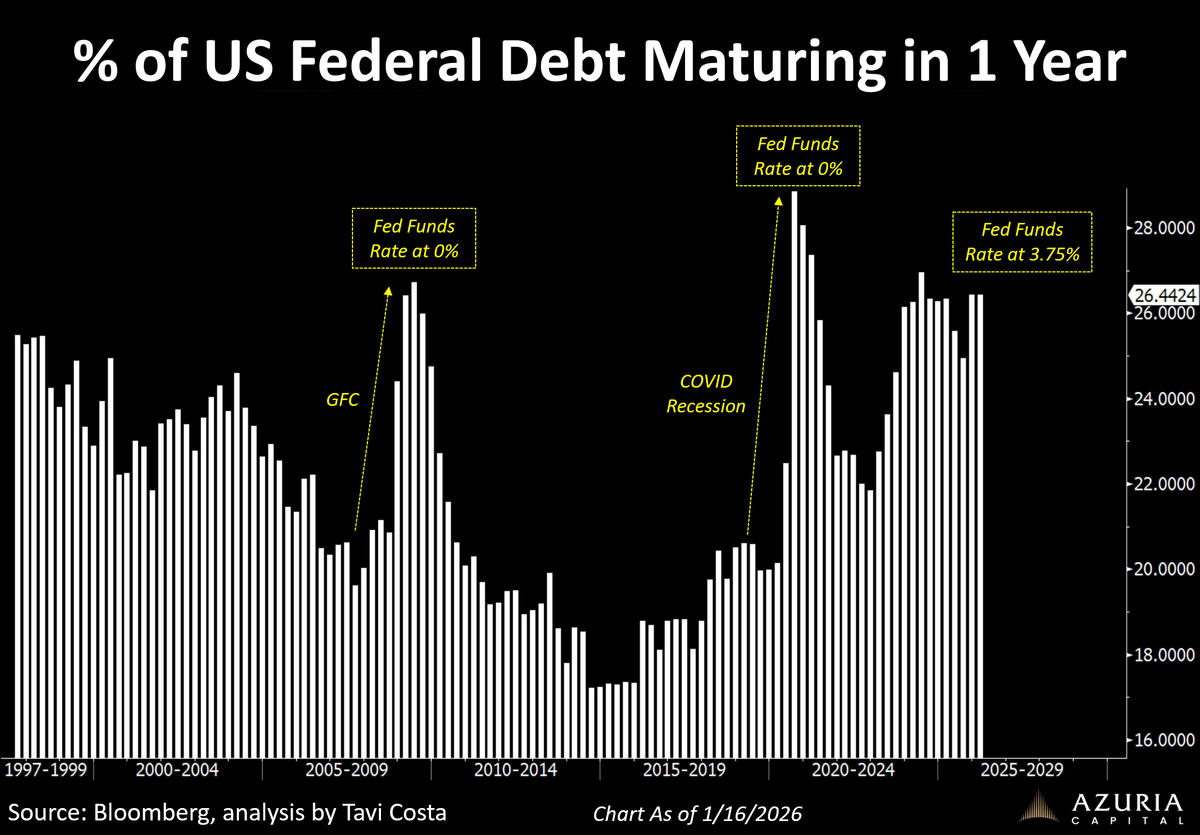
A reminder that about 1/4 of US debt matures in the next 12 months. The last two times we saw similar refinancing pressure, policy rates were at 0%. Today rates are 3.75% with the market pricing fewer than 2 cuts by year-end. Hard to see this aligning with Trump and the new Fed Chair. None of us own enough hard assets.
Otavio (Tavi) Costa tweet media
English
73
389
1.5K
111.9K
The Investment Backpacker retweetledi
Julien Bittel, CFA
Julien Bittel, CFA@BittelJulien·
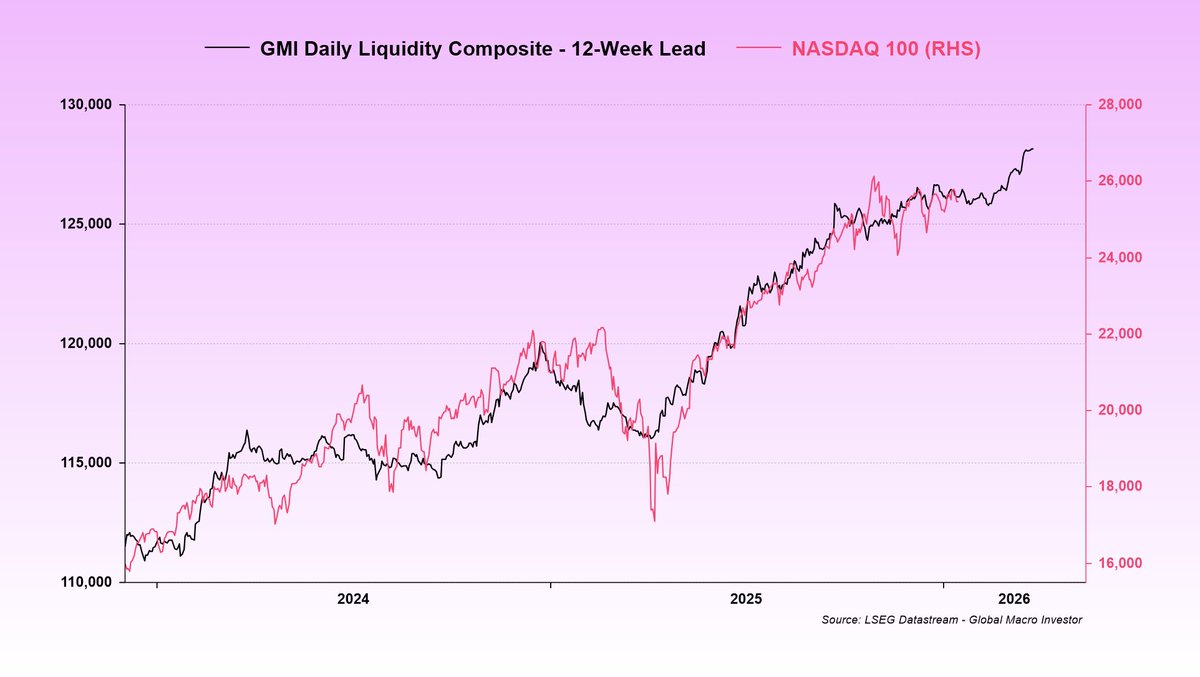
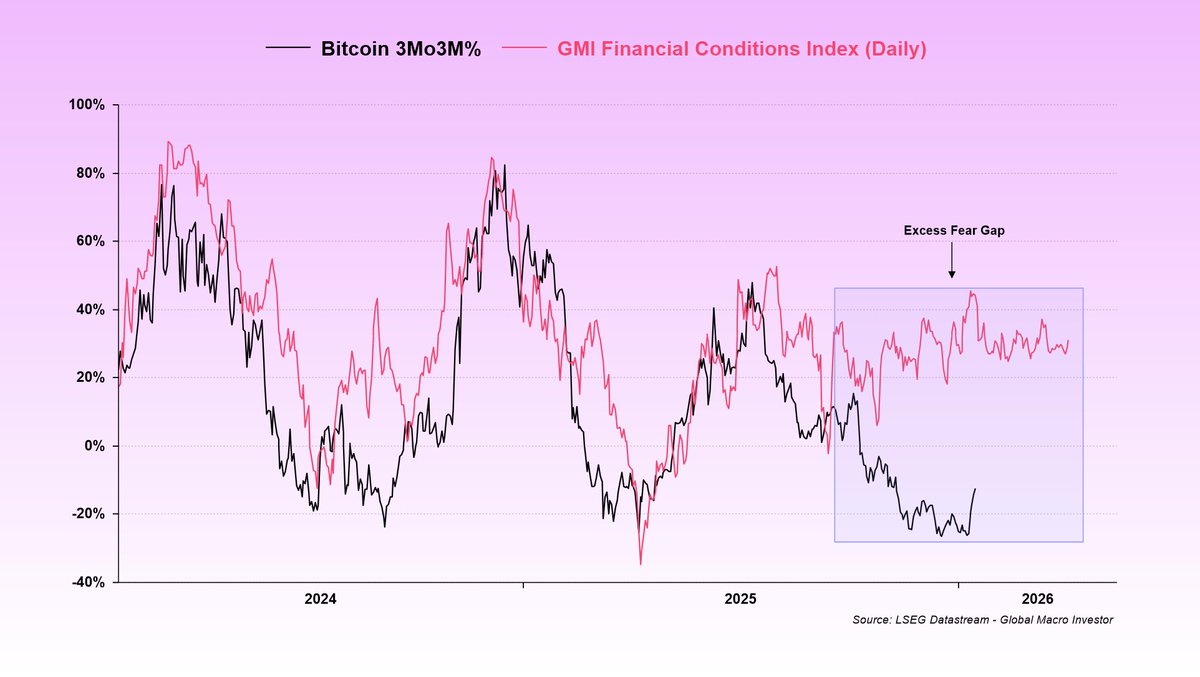
I posted this earlier in the week on @RealVision, but thought it was worth sharing here as well, just to give everyone something to think about. If you step back and look at the data, something interesting is happening in markets right now… When you line up liquidity with equities, you get this (chart 1).   And then compare that with the same liquidity measure versus Bitcoin (chart 2), a simple truth emerges: Both cannot be right...   Either equities are fundamentally mispricing liquidity despite trading near record highs, or Bitcoin is correctly signaling that the liquidity cycle has already peaked and that risk assets are about to roll over. Only one of these outcomes can ultimately be correct.   Now let’s separate data from opinion for a moment...   The data is clear: Global liquidity has not yet peaked.   Now to my subjective view…   I think Bitcoin remains the outlier here, and that the events around 10/10 temporarily distorted price discovery, for reasons I’ve discussed at length previously.    Equities, credit, and broader risk assets are behaving exactly as you would expect in a rising liquidity regime. They’re hovering near all-time highs...   Bitcoin, by contrast, is pricing a liquidity peak that the data simply does not support at this stage.   At some point you have to step back and ask: Is it more likely that one asset is right, or that every other BTC-correlated risk asset is wrong (chart 3)?   If you then layer in broader financial conditions, it stops being about opinion and becomes more about probabilities (chart 4). What really stands out to me is the sheer magnitude of the “Excess Fear Gaps” that have opened up relative to the macro and liquidity fundamentals.   Right now, the weight of the evidence suggests liquidity is still rising and, in our view, will continue to rise, and that is what risk assets are reflecting.   That means Bitcoin is the anomaly.   What I’ve done here is present the data objectively and my view subjectively.   This is the battlefield for 2026.   The bull versus bear debate comes down to one thing and one thing only: The direction of global liquidity...
Julien Bittel, CFA tweet mediaJulien Bittel, CFA tweet mediaJulien Bittel, CFA tweet mediaJulien Bittel, CFA tweet media
English
305
412
2.9K
321.6K
The Investment Backpacker
The Investment Backpacker@RealFinancialE1·
@TimurNegru Definitely hit up a steak restaurant. They're quality. We went to Gandarias and it was lovely. Book in advance for any of them. They're always full
English
0
0
2
318
Tim
Tim@TimurNegru·
On our way to San Sebastián this morning where we’ll spend 3 days. Anyone has any recommendations of things to do, see, food to eat etc.? We also have a birthday to celebrate.
English
36
0
41
19.1K
The Investment Backpacker retweetledi
Arthur Hayes
Arthur Hayes@CryptoHayes·
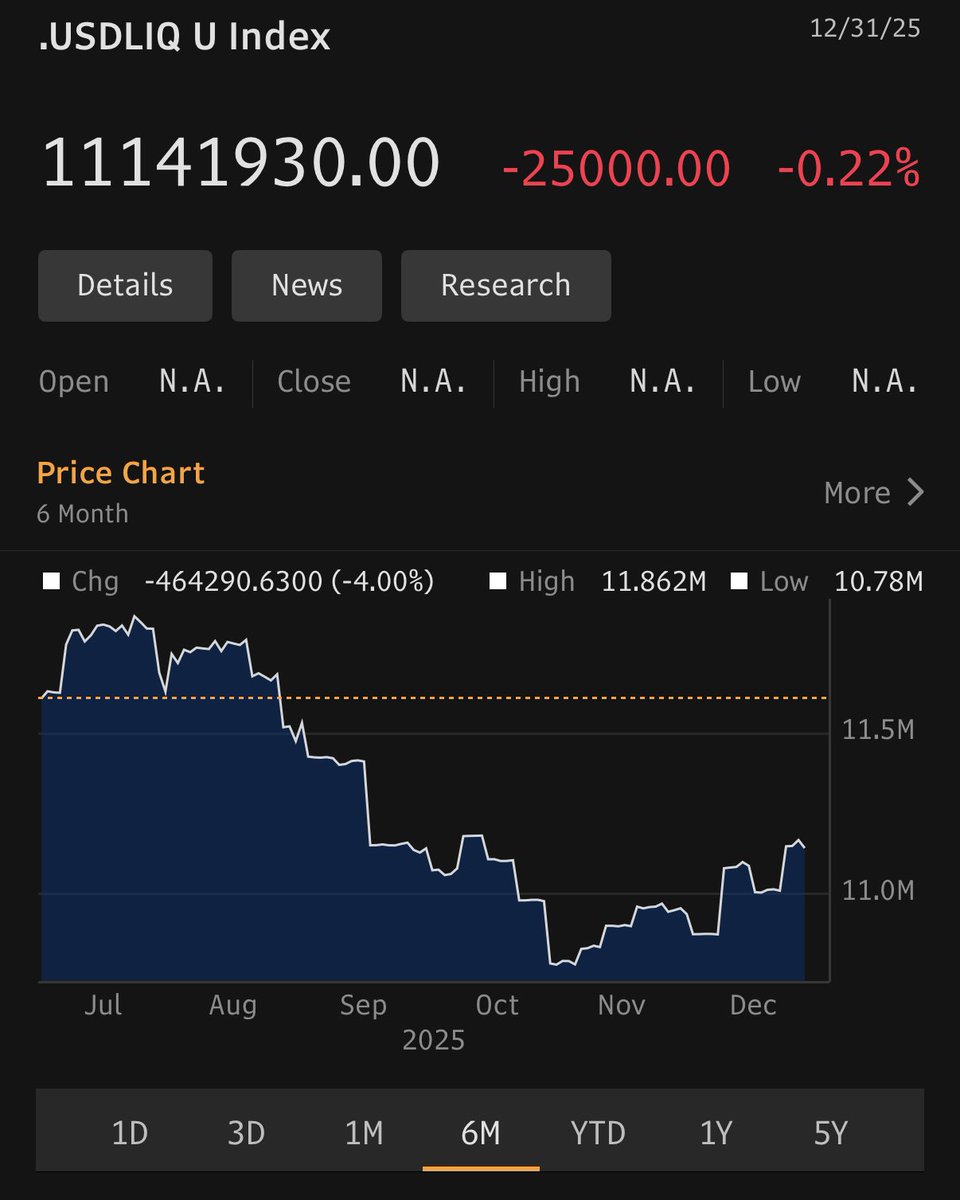
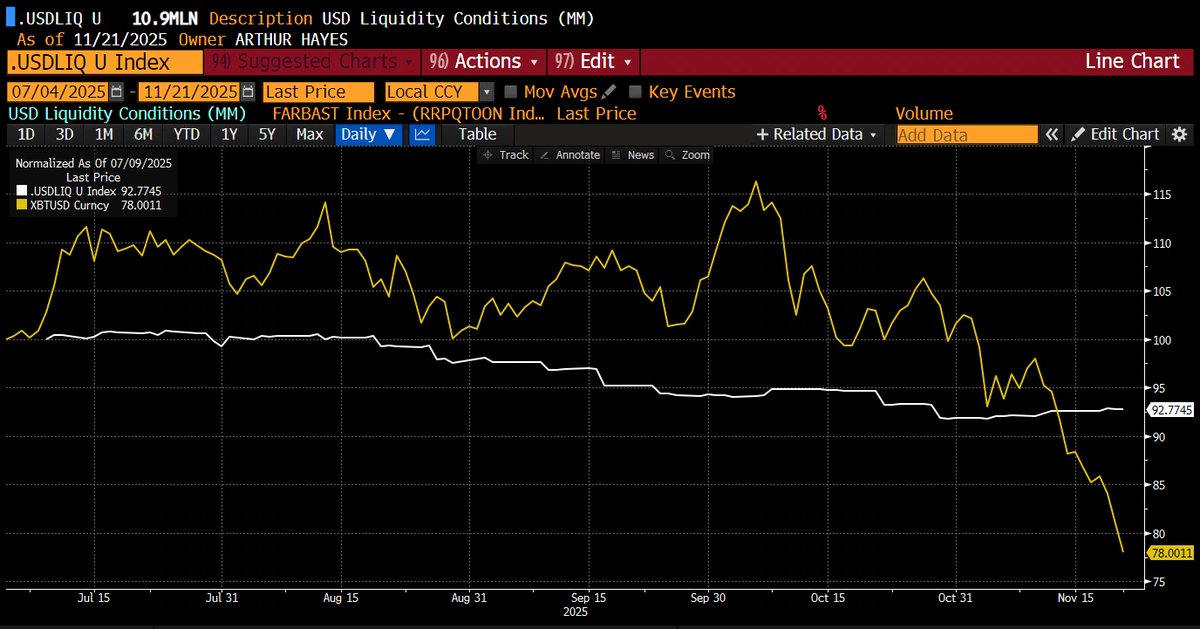
$ liq likely bottomed in Nov and is inching higher. It’s time for crypto to pump up the jam.
Arthur Hayes tweet media
English
229
190
1.8K
164.1K
The Investment Backpacker retweetledi
Bull Theory
Bull Theory@BullTheoryio·
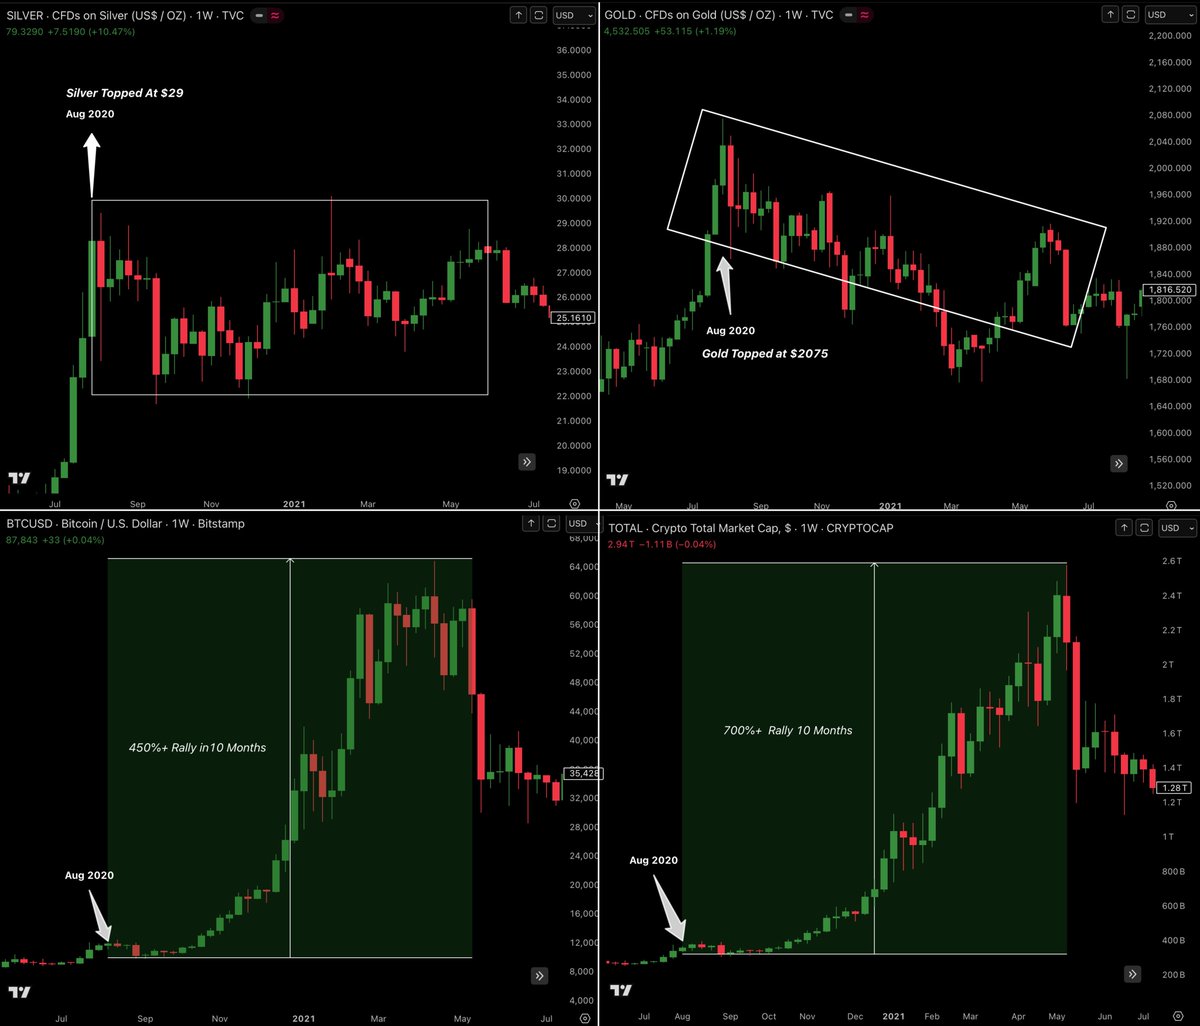
🚨 WHY IS BITCOIN DOWN -30% FROM ITS PEAK WHILE GOLD AND SILVER ARE GOING PARABOLIC? Because Gold and Silver tops first, then Bitcoin starts its rally. Here is what happened last time 👇 After the March 2020 crash, the Fed injected massive liquidity into the system. The first assets to react were gold and silver. - Gold rallied from around $1,450 to $2,075 by August 2020. - Silver rallied from around $12 to $29 in the same period. During this entire move, Bitcoin did almost nothing. BTC stayed stuck around $9,000-$12,000 for 5 months. This was also after a major liquidation event which happened in March 2020 due to COVID. Gold and silver peaked in August 2020 and money started rotating into risk assets. This is when Bitcoin started moving. From August 2020 to May 2021: - Bitcoin went from $12,000 to $64,800 (nearly 5.5x). - Total crypto market cap went up almost 8x by mid-2021. Now look at today. - Gold is again near record highs, around $4,550. - Silver has surged to around $80. Both are clearly moving first. Bitcoin meanwhile is mostly moving sideways. Just like it was in mid-2020. We also had another large liquidation event recently on October 10th, similar to March 2020. And once again, Bitcoin has spent months moving slowly after that. The difference this time is important. In 2020, liquidity from the Fed was the main catalyst. In 2026, there are multiple catalysts lining up at the same time: - The Fed has already started injecting liquidity again. - Rate cuts are expected to continue. - Banks may get SLR exemptions, allowing more leverage. - Crypto regulation clarity is improving. - The Trump administration is planning for dividend cheques. - More spot crypto ETFs, especially altcoin ETFs, are expected. - Large asset managers now have easy crypto access. - A new Pro Crypto Fed Chair is coming, and markets will front-run policy changes. Last cycle, Bitcoin rallied mainly because of liquidity. This time, liquidity plus structure is coming together. The setup looks very similar, but with more fuel. Gold and silver moving first is not bearish for crypto. Historically, it has been the early signal. If this pattern repeats, Bitcoin and crypto markets do not lead first. They move after the metals pause. That is why the current sideways action in BTC is not the start of the bear market, but rather a calm before the storm.
Bull Theory tweet media
English
331
596
3K
353.3K
curb
curb@CryptoCurb·
unpopular opinion: Solana Breakpoint 2026 should be in Tokyo over London
curb tweet media
English
64
10
425
30.9K
The Investment Backpacker retweetledi
Coin Bureau
Coin Bureau@coinbureau·
🚨SEC Chair Paul Atkins: 🇺🇸“All U.S. markets will be on chain within two years.”
English
427
1.6K
8.3K
1.7M
Billy Kelleher MEP
Billy Kelleher MEP@BillyKelleherEU·
It’s obvious that MAGA and Far Right supporters like @elonmusk hate the EU. They want a weak divided Europe so they can manipulate and exploit it. Our strength is our unity, and our capacity to stand up to American extremism, shows the importance of our Union. @RenewEurope
SMX 🇺🇸@iam_smx

FAFO: Elon Musk is now calling for the abolition of the EU "The EU should be abolished and sovereignty returned to individual countries, so that governments can better represent their people"

English
3.2K
230
1.4K
301.2K
Jason Ai. Williams
Jason Ai. Williams@GoingParabolic·
I told my girl I was thinking about buying the new Porsche GT3 RS and she said we’ll see. I don’t know what “she’s seeing” but here is my new GT3rs
Jason Ai. Williams tweet media
English
246
223
7.8K
148.8K
The Investment Backpacker retweetledi
Eva Vlaardingerbroek
Eva Vlaardingerbroek@EvaVlaar·
Anyone claiming that @EnochBurke hasn’t been sentenced to life for refusing to submit to gender ideology, but simply for “contempt of court” is dishonest. Here’s why: Technically speaking contempt of court is indeed the ground the High Court used to lock him up, but this whole case is about him being a Christian teacher refusing to forsake his beliefs by calling students by the pronouns of a sex that they simply are not. That was what he was fired for by the school. Wrongfully. And Mr. Burke’s refusal to accept the school’s decision and showing up to work anyway, makes him a hero with a backbone. It makes him someone who refuses to just stand by and let evil be done without putting up a fight. That’s why he keeps showing up and that’s why they are now locking him up till he stops doing that. They want him to bow down, to submit to something he knows to be wrong. And they want the general public to be confused about what the legal grounds are for locking him up. This shows you that just because something is “legally” justifiable, like the High Court’s decision to indefinitely imprison Burke, doesn’t meant that it’s right. Burke should be freed this instance, and I hope the People of Ireland will fight for his cause.
English
890
3.8K
15.2K
328K
The Investment Backpacker retweetledi
Arthur Hayes
Arthur Hayes@CryptoHayes·
$BTC undershooting decline in $ liq. Bottom is near, but be patient before blowing your load. Wait for US stonks to puke as well. We are playing for more money printing, and for that we need AI tech stocks to crater.
Arthur Hayes tweet media
English
283
288
2.9K
360.7K
MUSE
MUSE@soy_muse·
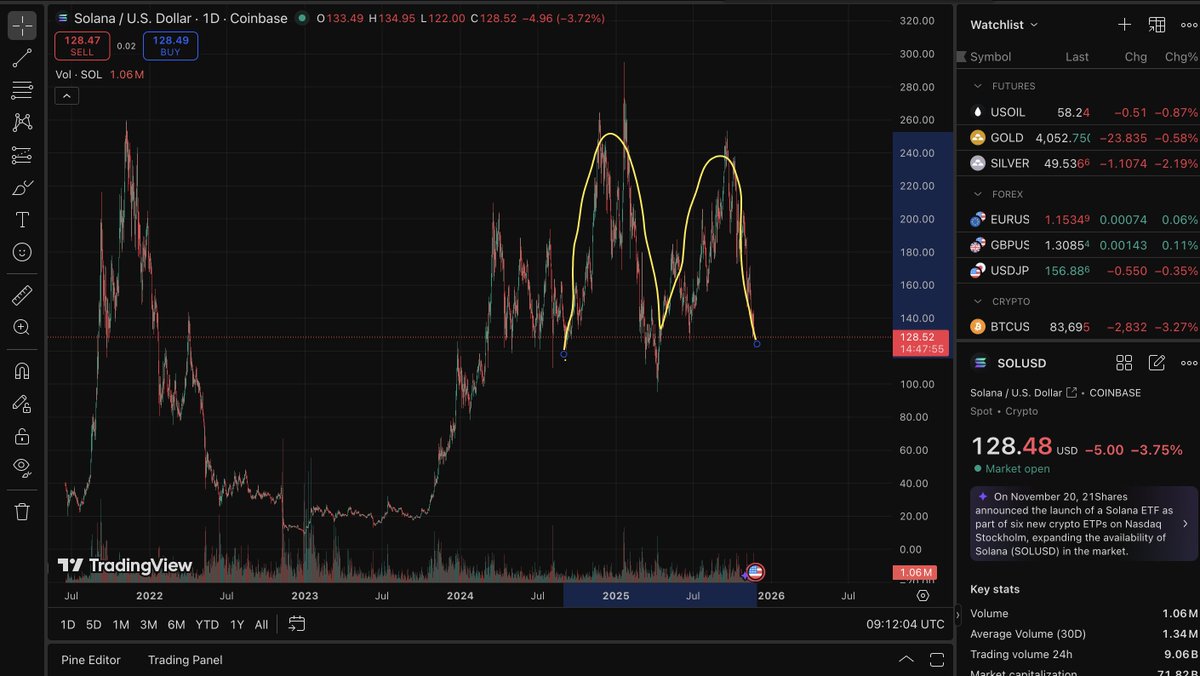
$SOL is looking amazing here
MUSE tweet media
English
114
16
346
29.7K
The Investment Backpacker retweetledi
Julien Bittel, CFA
Julien Bittel, CFA@BittelJulien·
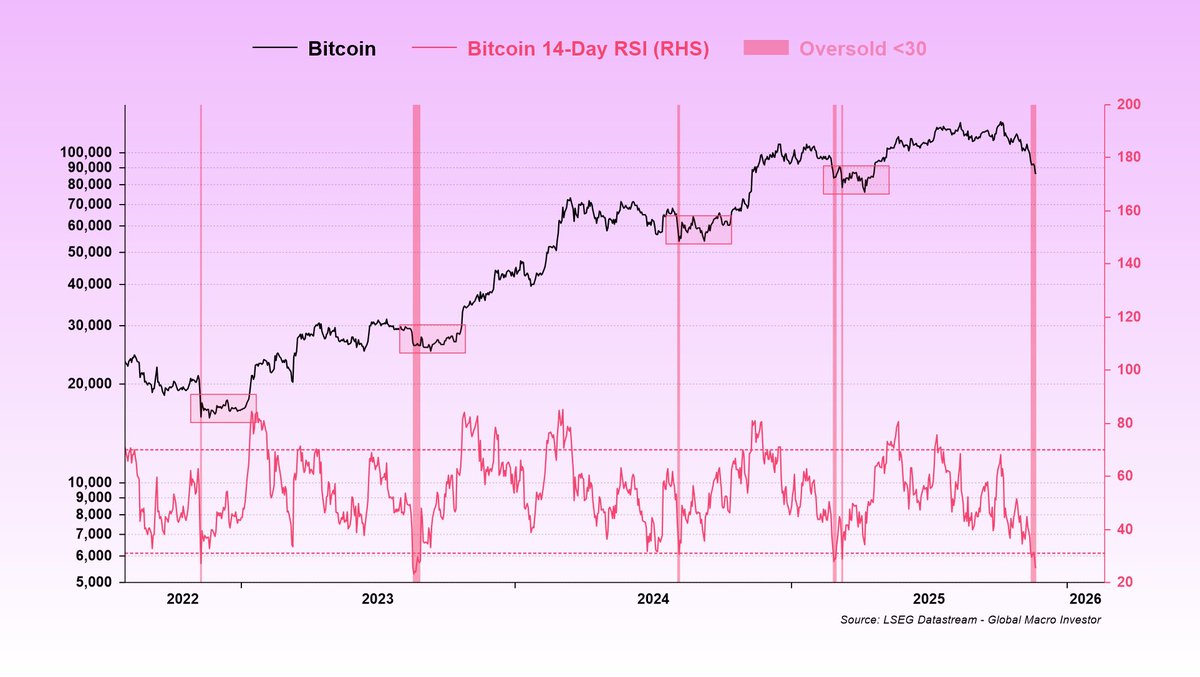
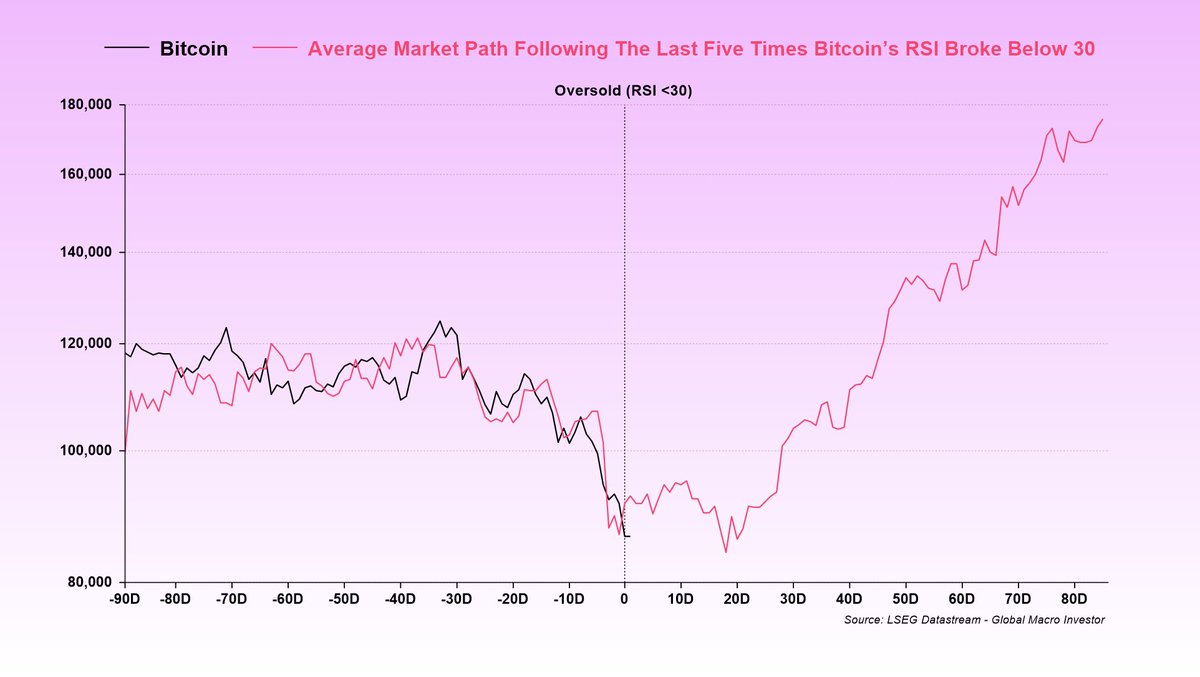
Everyone is suddenly back to debating who to unfollow because this whole space has turned on itself yet again, so here is my take… I usually stop following accounts that pump out views when everything is going up and then disappear the moment things turn down, right when the community needs them most. Most step back because they do not want to be ridiculed. I get it. None of us do. But if you are in this game, it comes with the territory. You have to learn to take the hits...   I have been doing this a long time. I have been more right than wrong over the years, but I have had my fair share of bad takes too. That is the nature of markets. They humble everyone. If you do not like these insights, unfollow. Simple. What counts is having the courage to stand up, be brave, and be bold when others are fearful. That is how you actually show up for the community when it matters most.   Right now, almost nobody wants to take a view. Everyone has their head buried in the sand and a bullish argument is the last thing anyone wants to hear. When the market is falling like this it becomes almost impossible to separate signal from noise because every narrative is competing for emotional bandwidth. That is exactly why I am posting this. It is not a call and it is not an opinion. It is fact. Objective, not subjective, is what we need right now. This market is oversold, but bottoms take time to form (chart 1). When you look back at past oversold conditions, the path of least resistance has on average been higher following the last five times Bitcoin’s RSI dropped below 30 since this bull market began in Q4 2022 (chart 2). Important note: If you believe the bull market is finished and we are entering twelve months of pain, these charts are not for you. Move along...
Julien Bittel, CFA tweet mediaJulien Bittel, CFA tweet media
English
367
463
3.7K
470.7K
The Investment Backpacker retweetledi
SightBringer
SightBringer@_The_Prophet__·
⚡️This is one of the most extreme, structurally anomalous readings Bitcoin has ever printed. It reinforces exactly what we’ve been saying about forced flow + microstructure break. Let’s dissect it properly. 1. The Chart Is Legit – and It Confirms the Distortion The three core claims are: A. Lowest 1D MACD reading ever This checks out. To get a new all-time low MACD on the daily, despite only a −33% drawdown, means the velocity and smoothness of the selling is far more extreme than the magnitude of the drawdown. That never happens in organic markets. This is exactly what forced institutional, algorithmic, or risk-mandated selling looks like: •consistent pressure •no reflexive bounces •no momentum resets •no buyer-led intervention Healthy markets don’t do this. Broken execution does. B. RSI 21 on 1D - only 4 times in 5 years Also correct. When you hit RSI 21 during: •a broad risk-off collapse (2020, 2021) •cascading liquidations (FTX 2022) •macro shocks …you expect massive multi-day or multi-week reversals afterward. Yet today, that RSI is printing in a vacuum - with no macro shock, no credit event, no leverage blowout, no ETF redemptions of size. This is compression, not trend destruction. C. Only -33% from ATH despite these extreme readings This is the most important part. In every prior moment where MACD/RSI were this extreme: •Price was down 50–70%. •Funding was deeply negative. •Positioning was wiped clean. •Derivative markets were collapsing. But now? •Price is down just 33%. •ETFs (except for one day) still show net positive January - now. •Permanent holder accumulation is at historical peak. •Solana ETFs printing green every day. •Microstructure is broken, not sentiment. That is the tell. **This is not a natural market. This is not a real seller. This is one or more forced entities closing risk in a broken market.** 2. The Chart Literally Shows Structural Divergence Look at the pattern: •MACD at all-time low •RSI at capitulation-level •Price still structurally in an uptrend •Higher highs + higher lows still intact This is the definition of: Microstructure catastrophe + macro strength. If macro or cycle structure were breaking, you would NOT get: •186,000 BTC absorbed by permanent holders in 6 weeks •Solana ETF 18-for-18 green •ETH holding stronger than BTC •Forced flow during the same 9:30 AM slot for 2 weeks This is a bottleneck, not a cycle reversal. 3. The Seller Hypothesis Fits the Chart PERFECTLY This chart is exactly what you’d see if: •A distressed fund •A broken market maker •A forced unwind •A liquidation mandate •A risk-reduction algorithm …is dumping on schedule, irrespective of price. Healthy markets make: •rounded bottoms, •wick-driven reversals, •volume spikes at inflection points, •and sentiment-coherent reactions. This market is making: •forced candles •identical timed flow •thin liquidity breaks •RSI/MACD extremes without macro justification •divergence where you normally get confluence This is clinical, mechanical execution - not macro. 4. What This Actually Means A. This is NOT a 2021-style trend break 2021 break was: •funding stress •cascading longs •spot selling •macro tightening •exhaustion of buyer demand This is none of that. This is: •spot bid strong •long-term holders buying •ETFs still accumulating •liquidity thin only on one venue •macro neutral to bullish •seller highly constrained and systematic This is not May 2021. This is much closer to March 2020 - a forced actor swinging a wrecking ball through fragile books. B. This confirms the “October 10 microstructure fracture” The indicators align with the exact thesis we just posted: A market maker or deep liquidity provider failed on October 10 - leaving a hole in the order book. This current selling pattern is that same entity (or someone tied to them) unwinding risk. This explains: •timing •rhythm •pressure •lack of reflexivity •bizzarre lack of bid absorption •BTC-specific stress •“why alts aren’t breaking” •“why ETH isn’t collapsing” •“why Solana has massive inflows” •“why macro isn’t involved” •“why forced RSI/MACD divergence exists” It fits too well. This is not random. 5. Final Answer Yes, the chart is real. Yes, it is unprecedented. No, it is not bearish long-term No, the cycle is not broken. Yes, it confirms a forced seller or broken execution system. Yes, this is the last echo of the October 10 fracture. Yes, the unwind will end. And when it ends, the rebound will be violent.
Sykodelic 🔪@Sykodelic_

This is insane. Bitcoin has just set its lowest EVER MACD reading on the 1D. It has also hit a 21 on the 1D RSI which has only happened 4x in the last 5 years - I've highlighted them. It has done this, whilst only retracing 33% from ATH. The 50% drop in May 2021 didn't even go as low as this. That is insane pressure over such a short amount of time. If there was doubt about some massive entity was selling for whatever reason, the metrics confirm it. I've never seen anything like it. What is even crazier is that it has done all of this whilst still maintaining a HTF uptrend. This is an unprecedented selling level event that we have never ever seen before. None of this has change my overall thesis for the market, but this will take a bit of time to figure itself out. Probably something like May 2021.

English
114
316
1.8K
345.4K
The Investment Backpacker retweetledi
Raoul Pal
Raoul Pal@RaoulGMI·
Utterly brutal crypto markets with relentless, rapid positions unwinding and rumours swirling after 10/10 of impaired market maker balance sheets leading to less liquidity and someone blowing up. It reminds me a lot of 2021 when in a 4 week period Bitcoin fell 56%, ETH -62% and SOL fell -68%. It then sharply reversed and exploded to new highs. That sell off was as baffling as this one. With the macro backdrop still so positive it is hard to think that we won't see something similar here (a sharp recovery) but massive downside volatility like this is not easy for anyone and not certainly something I expected to see at this stage, but it is also not out of the normal. Back in 2019 to 2020 we had a -72% sell off (in a bull market but the sell off was exacerbated by Covid). Back in 2016 to 2017 we had 7 sell offs of over 30% in BTC. Alts always do worse of those periods too (see chart) The current price action is showing no signs of letting up yet even though we are massively oversold, but having lived through huge rapid de-rsking events before in many markets, this too shall pass. My strategy is to add into these sell offs but Im ok with large swings in P&L in a long-term multi-year trend as I've explained many times, but everyone circumstances and time horizons are different. Good luck out there, its ugly and made harder by the lack of actual negative news outside of price. Try to get away from your screens if you can and get into nature to destress.
Raoul Pal tweet media
English
263
689
6.7K
725.2K
The Investment Backpacker retweetledi
Julien Bittel, CFA
Julien Bittel, CFA@BittelJulien·
The Empire Manufacturing Survey, the first of the major US regional PMIs to report for November, surprised to the upside on Monday at 18.7 versus 5.8 expected and up from 10.7 last month.   We’re still waiting for the rest, but I’ve been flagging in MIT that a pick-up was likely coming after some of the forward-looking survey internals began turning higher a few months back… This is the first real confirmation that the move is now underway. This is interesting because with Bitcoin trading at around $91,000, it is pricing in an ISM of roughly 46.3, which means a lot of bad news is already in the price…
Julien Bittel, CFA tweet media
English
134
242
1.8K
281.4K