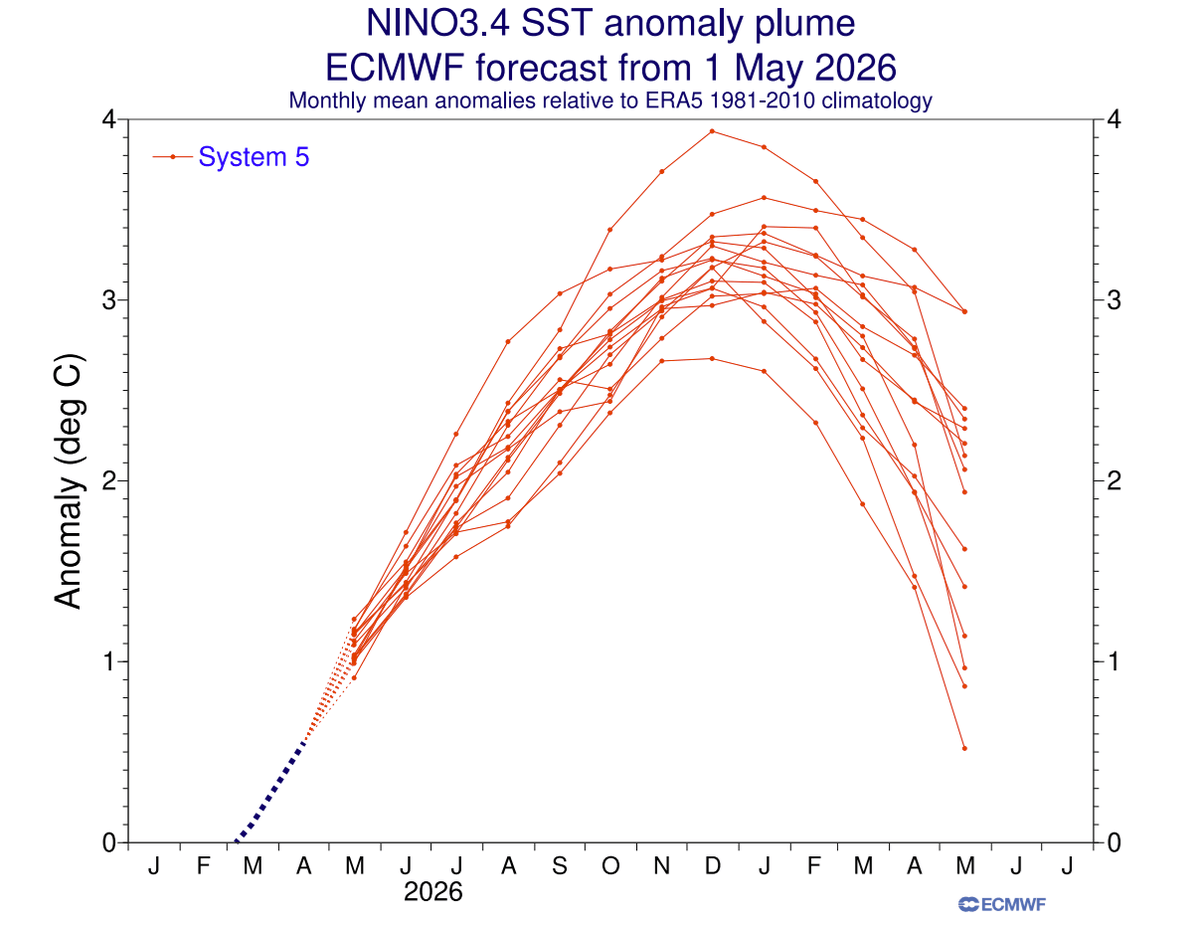
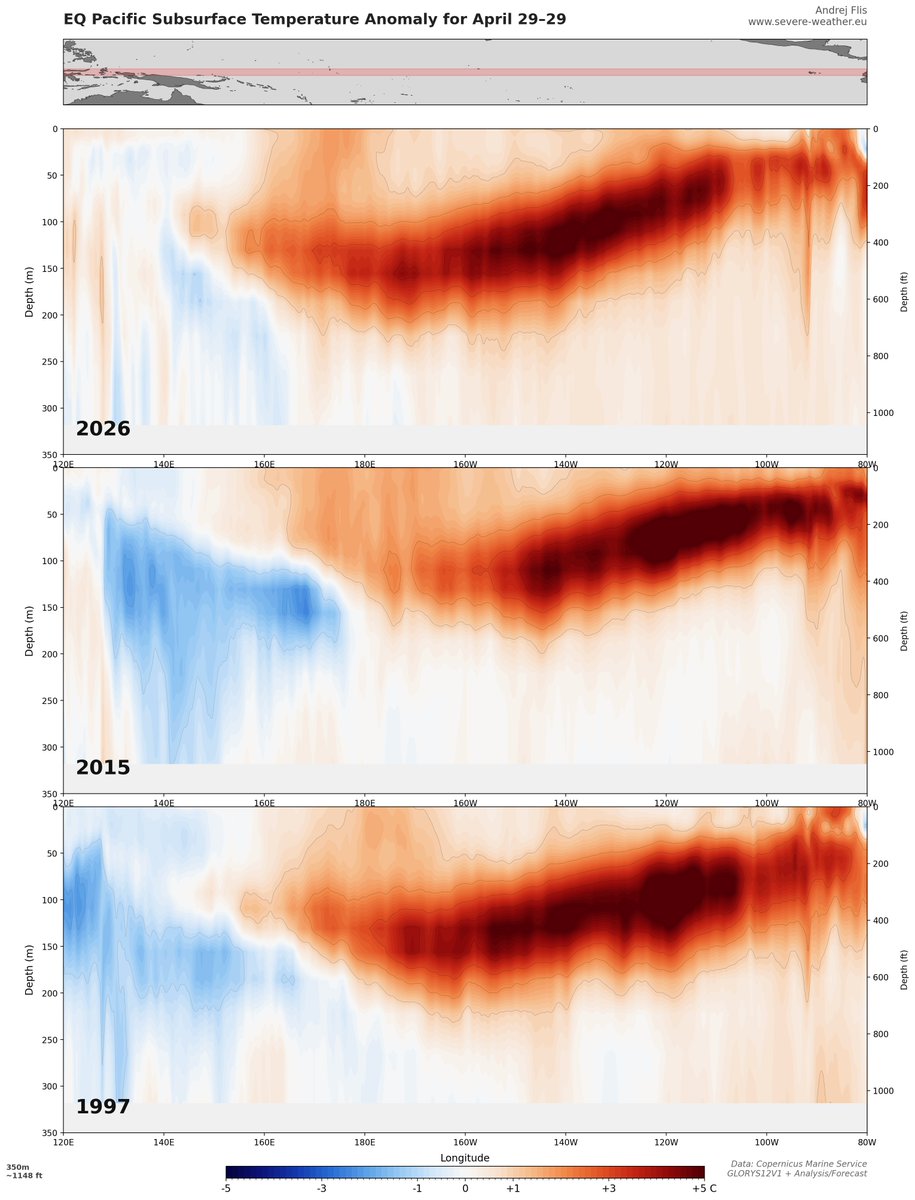
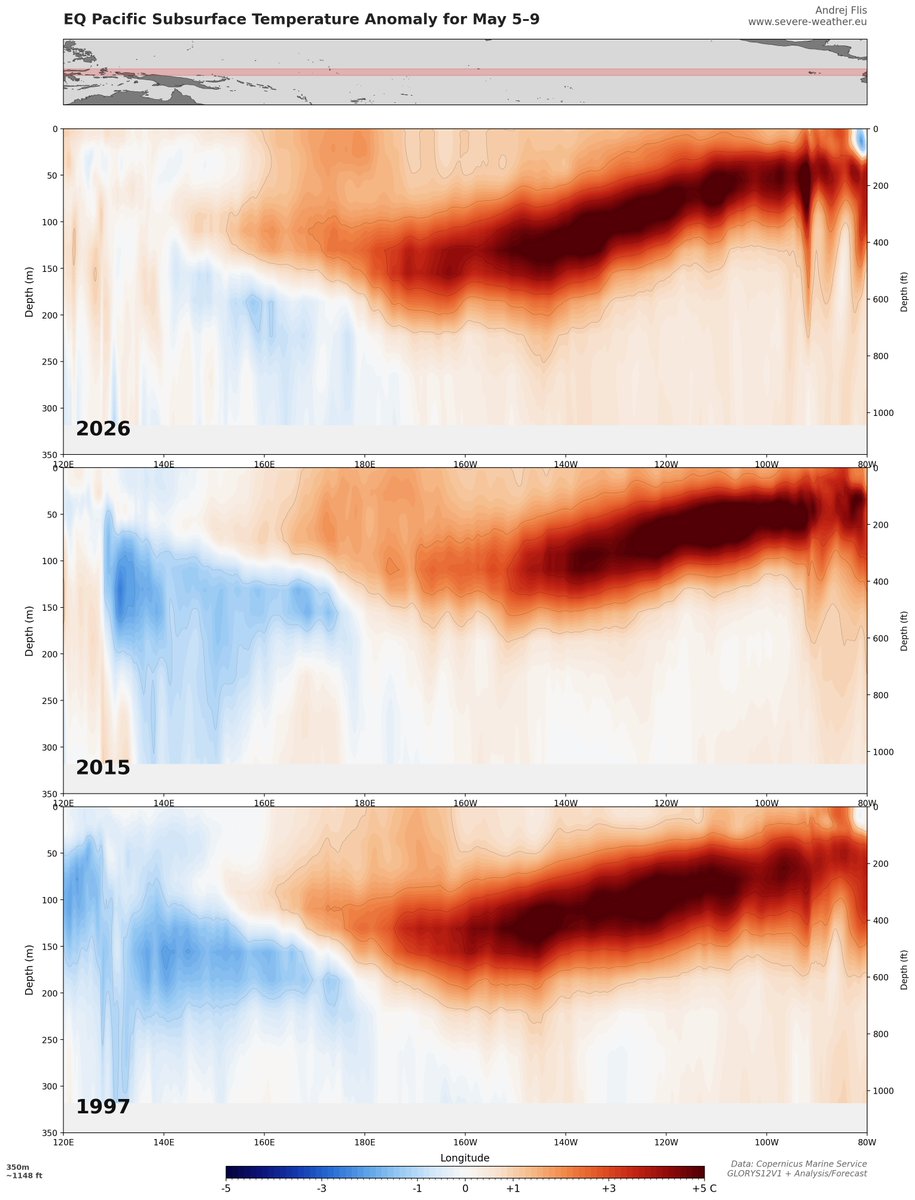
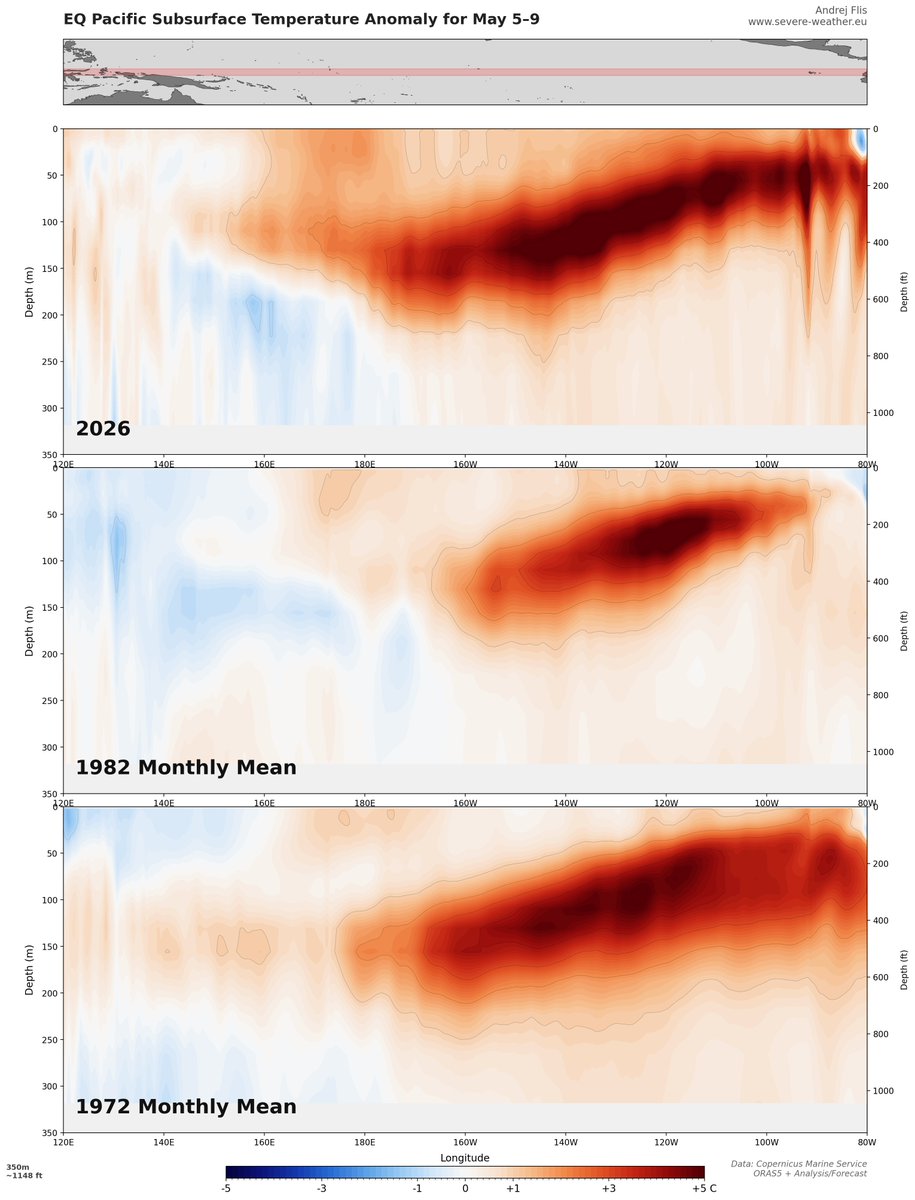
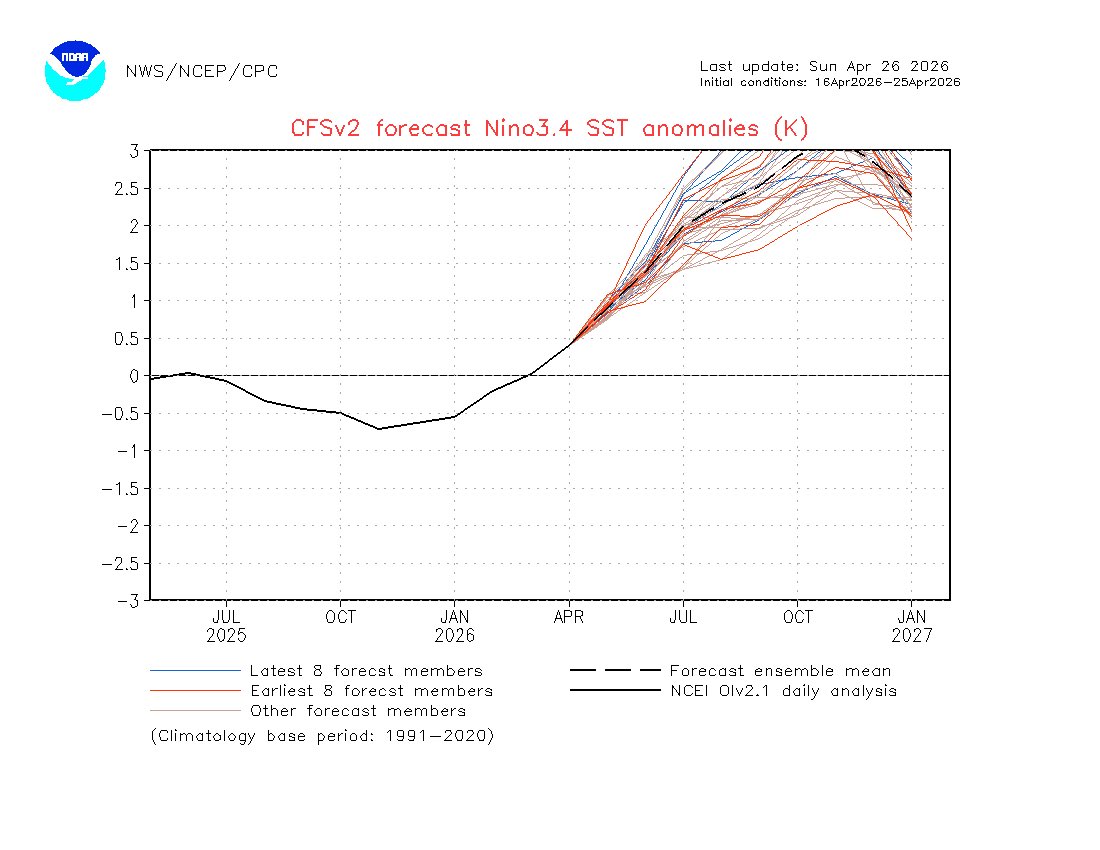
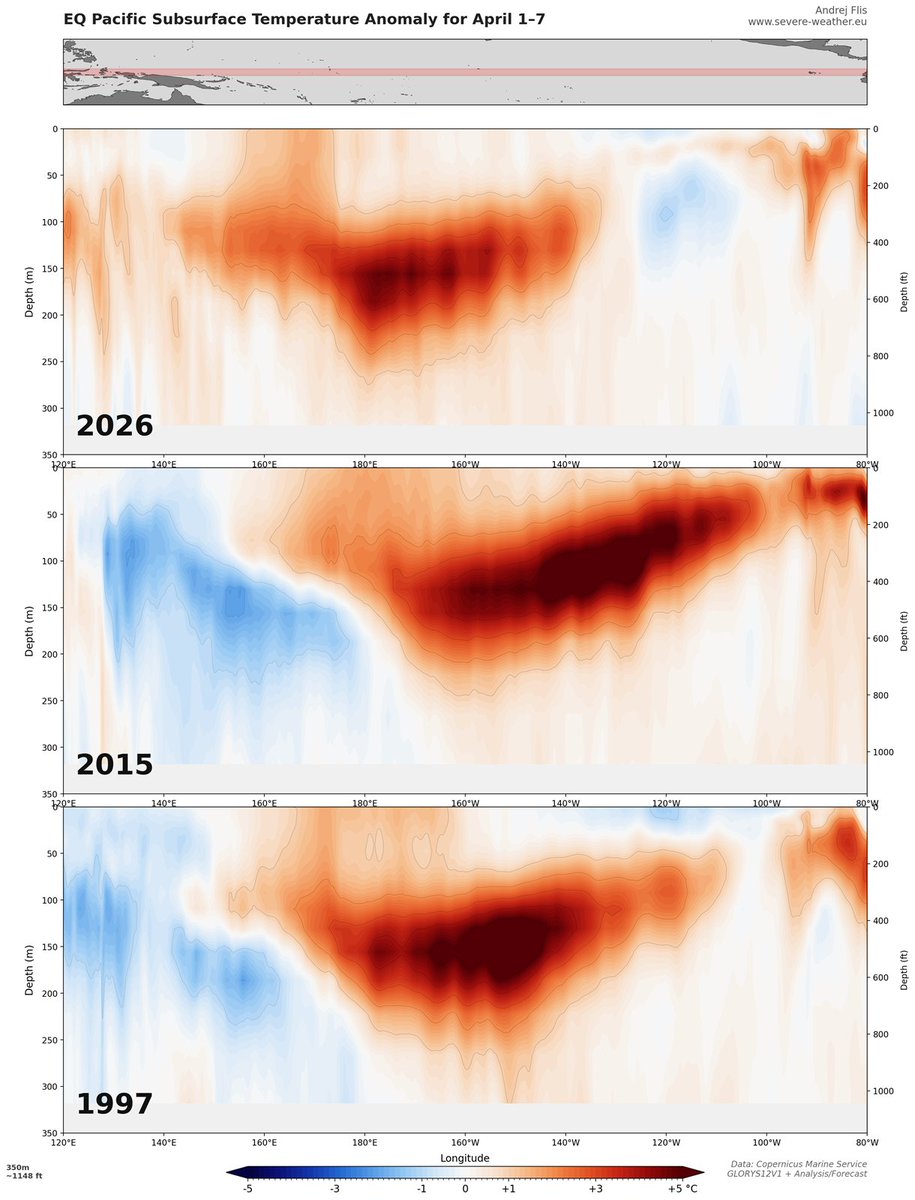
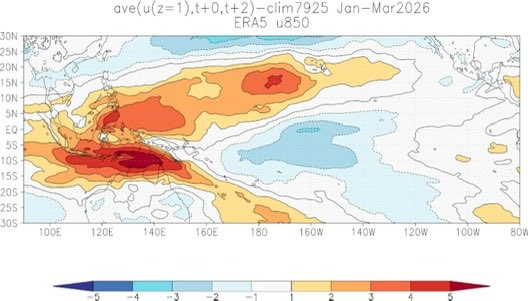
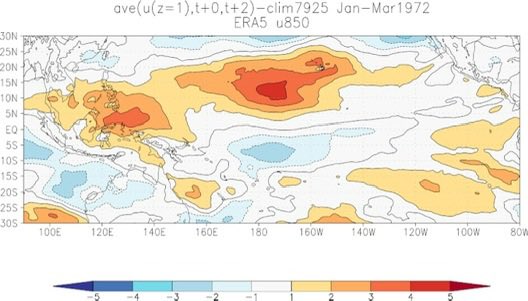
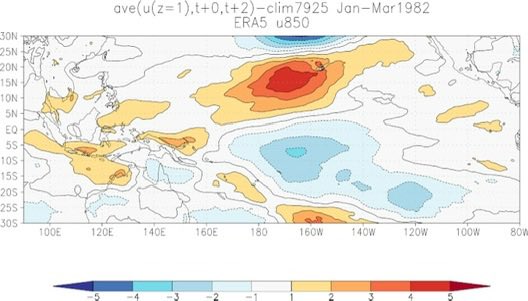
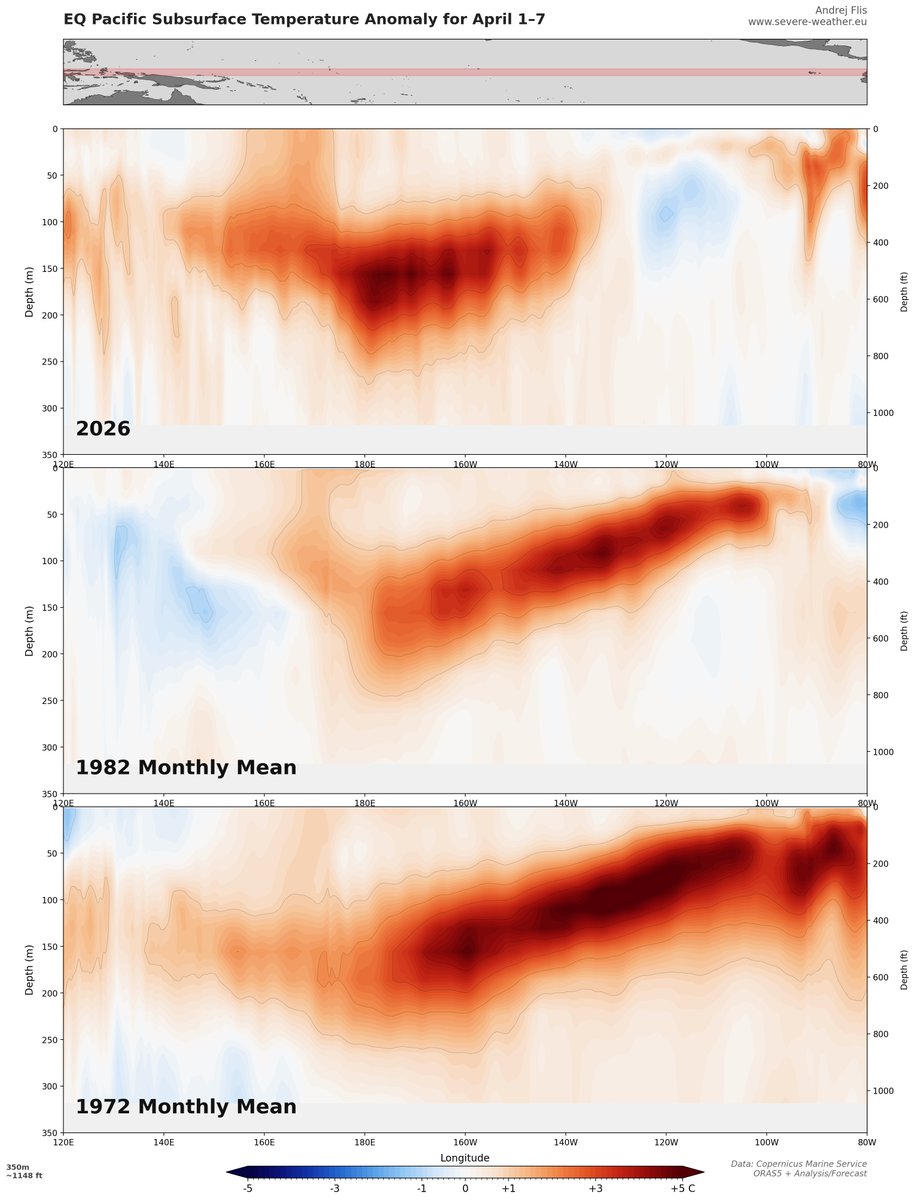
Andrej / severe-weather.eu

2.9K posts

Andrej / severe-weather.eu banner
Andrej / severe-weather.eu

Andrej / severe-weather.eu

@Recretos

Weather/climate enthusiast and forecaster. Info on global weather models, weather patterns, winter, stratosphere, polar vortex, custom graphics, and more...

Slovenia Katılım Temmuz 2010
216 Takip Edilen1.7K Takipçiler
DC
DC@novasufferer134·
@Recretos @AndyHazelton I saw the euro roni is 2.2, would that put it at like 3rd all time?
English
1
0
0
24
DC
DC@novasufferer134·
@Recretos @AndyHazelton Also are the previous El Niños on the graph in roni or oni?
Español
1
0
0
31
Andrej / severe-weather.eu
@AndyHazelton Also, comparing the latest ECMWF run to the previous run for July and September, we can see a stronger El Niño, but also a bit more intensity in the "+PDO" signature
Andrej / severe-weather.eu tweet mediaAndrej / severe-weather.eu tweet media
English
0
1
10
732
Todd Crawford
Todd Crawford@tcrawf_nh·
Nice analysis! I wonder if we’re needlessly splitting hairs at this point. Model forecasts have been consistent and trending more impressive with time, and recent observations are following along nicely with previous big Nino events. Will it really make significant differences in atmospheric impacts whether Nino 3.4 maxes out with SST anoms or relative SST anoms at 2.5 or 2.8?
English
1
0
1
285
Andrej / severe-weather.eu
This is now also the revised plot for the older two Super events, comparing the late April 2026 data to April monthly means, and the second graphic is the forecast for May 5-9, 2026, compared to the May monthly mean for past events. The forecast comes from the Mercator Ocean International system, forced by ECMWF IFS.
Andrej / severe-weather.eu tweet mediaAndrej / severe-weather.eu tweet media
English
1
1
4
724
Jeff Berardelli
Jeff Berardelli@WeatherProf·
The latest CFS forecasts for El Niño need no hyperbole or exaggeration. The traditional Nino 3.4 region might actually be +3.4°C lol - I can’t tell because some of the members and also the mean are literally off the chart. The RONI.. newer “relative” index - which takes our warmed climate into account - is like 2.7 which would be close to a record (if averaged over 3 months). The current record is +2.5°C in 1982-83. The original index is good to look at for comparison sake. But the Relative index will give us a better idea of the impacts of the event. That’s because El Niño is most impactful when its anomalies are the highest compared to other adjacent regions/ basins. In 2023 there was a strong-ish El Niño but the Atlantic was also warm, diluting the El Niño impacts and allowing major hurricane Idalia to form in the Gulf.
Jeff Berardelli tweet mediaJeff Berardelli tweet media
English
10
75
281
16.5K
Andrej / severe-weather.eu
I decided to also load the zonal flow data for depth, and overlay the 2026 with the latest mean, and also do a comparison where/how the 2026 shows stronger/weaker zonal flow compared to past events. Will be really interesting to see the 2026 analysis plot in a week or two after the upcoming round of WWBs. But overall, stronger westerlies in the west are evident versus all years.
Andrej / severe-weather.eu tweet mediaAndrej / severe-weather.eu tweet media
English
0
1
6
571
Andrej / severe-weather.eu
@PaulRoundy1 @AndyHazelton @webberweather @tcrawf_nh Yes, the 1997 subsurface maxima was further east, which is why the negative delta between 180-100W. It looks like main difference could be just the time delta between the WWB events and the Kelvin Wave progression. Will revise these graphics weekly to see the progression.
English
1
0
2
122
Will
Will@PROLIFICSHlTTER·
@Recretos @webberweather But but but models busted in 2017 that means we can ignore the reality in observational data right before us now!!
English
1
0
2
63
Eric Webb
Eric Webb@webberweather·
The sheer amount of blatant wishcasting I’ve seen on this platform lately that ignorantly downplays this El Niño even existing in the first place is honestly alarming. A lot of people are about to find out the hard way.
English
11
5
177
19.6K