Sabitlenmiş Tweet

BTC key posts summary since Jul 2025. I cannot clarify individually so putting all together.
- never talked about a new high since Jul 2025.
- highlighted weakness since Jul 2025.
- not said cycle is over because it didn't break the monthly support.
Jul 2025 at $116k:
👉"Sudden sign of weakness in BTC weekly! .... I'm on high alert!"
x.com/RhythmicAnalys…
Oct 2025 at $106k
👉"Currently, BTC’s trend is showing weakness. It will need to break above $116K to escape the downside pressure otherwise a risk of trend reversal."
x.com/RhythmicAnalys…
Nov 2025 at $102k:
👉"A negative divergence is observed on the oscillator, signaling weakness in the trend"
x.com/RhythmicAnalys…
Dec 2025 at $87k:
👉 "it’s weak but not dead. It’s still in an uptrend."
x.com/RhythmicAnalys…
1st Feb 2026 at $76k
👉"For the BTC uptrend, I’m tracking the April 2025 low ($74k) as the last support. A weekly close will tell us whether this is a breakdown or a bounce. I'm with the happy path simply because the last support is not broken yet."
x.com/RhythmicAnalys…
👉 5th Feb 2026 at $63k with support at $60k
"The current retracement is the deepest so far. The last hope for the bulls is the $60k–$62k support range."
x.com/RhythmicAnalys…
👉4th Jun 2026 near $60k - retest of Feb low
x.com/RhythmicAnalys…
#BTC $BTC #Bitcoin #Crypto
Mihir@RhythmicAnalyst
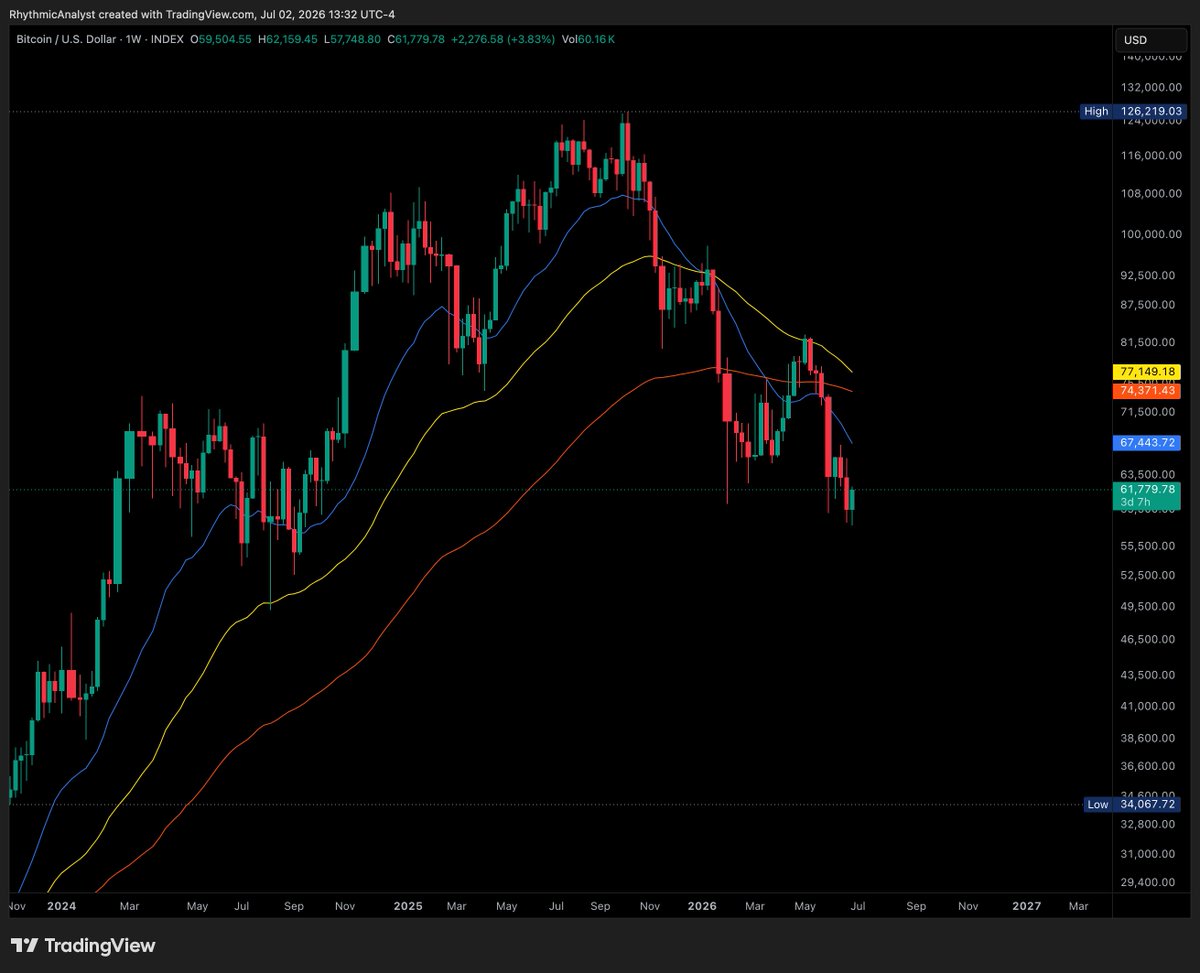
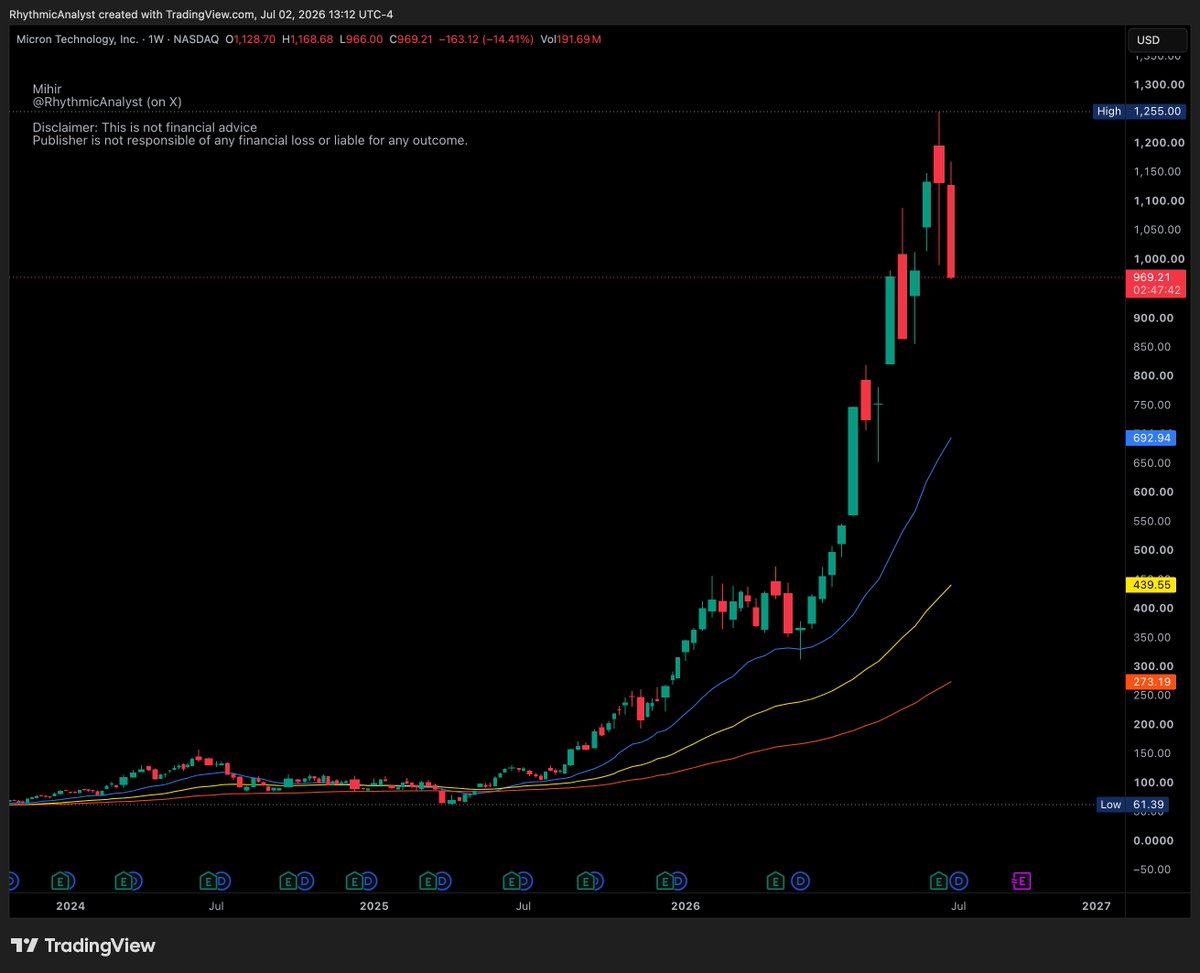
BTC was dropping yesterday, so I shared a quick update with my Discord group (first chart). Latest view in the second chart: BTC has now paused right at a major support level. #BTC $BTC #Bitcoin
English