Aiphetlea
59 posts



SPY OPEN | Monday July 13 $754.62. Up 0.14%. The first full session since the falling wedge confirmed. The breakout level became the floor. Tomorrow is the biggest data day of the month. THE BREAKOUT HELD: Friday SPY closed above $751.72 and confirmed the falling wedge. Today the structure tells you it's holding. The floor (where the shock absorber flips from cushion to amplification) sits at $751. The breakout level was $751.72. Those numbers just converged. The pattern breakout and the structural floor are the same zone. In plain terms: the level we watched for two weeks as a ceiling just became the floor. Price is above it. The shock absorber protects it. If SPY dips, $751 catches it. That's the breakout doing its job. THE STRUCTURE: The shock absorber rebuilt to +$327M after Friday's weekly strip. Positive. Cushioning dips. Not as thick as Thursday's record +$1.63B but healthy and growing. The rebuild follows the same 2-3 session pattern we've documented six times. The engine is at +93.2M. Approaching 100M again. The autopilot that buys every dip is running at 55% power. Twelve consecutive sessions positive. The longest run of the cycle. Seven of ten top levels are magnets pulling price up: $755: +$145M (at price) $756: +$78M $757: +$123M $758: +$95M $760: +$228M (largest, 0.7% above) $770: +$62M $800: +$96M $827M of magnets pulling toward $760. The next pattern target is the Reverse Head and Shoulders breakout at $756.68. That's $2 above price. The magnets are pulling price directly toward it. The bull flag breakout at $755.42 is $0.80 above. If price pushes through today, that's a fifth pattern confirming with a 93% success rate. IV: 13.3%. Near all-time lows heading into CPI and bank earnings tomorrow. The market is not hedging heavily for tomorrow's data. This either means the market expects a benign CPI print or it means the reaction could be outsized if there's a surprise because nobody is positioned for it. TOMORROW: THE BIGGEST DAY OF JULY Two major catalysts arrive simultaneously: CPI inflation data (8:30 AM). The last CPI on June 10 came in cold and SPY still sold off because the quarter-end rebalancing overwhelmed the good news. This time there's no rebalancing. The shock absorber is positive. The engine is running. If CPI comes in cold again, the structure can actually rally on the news this time. Bank earnings (before and after market). The major banks kick off Q3 earnings season. The financials stress test in June showed all 32 banks absorbing $708B in projected losses. The setup is clean. Beats here confirm the fundamental picture and give the market permission to push toward $760. HOW THE STRUCTURE HANDLES EACH SCENARIO: Cold CPI + bank beats: the best case. IV compresses further. The shock absorber strengthens. Price pushes through $755-$760 and approaches the $789 target. The bull flag, Reverse H&S, and falling wedge all accelerate. Hot CPI + bank beats: mixed. IV spikes on CPI but bank earnings provide a floor. The shock absorber at +$327M absorbs the initial CPI reaction. The $751 floor catches any dip. Cold CPI + bank misses: mixed in the other direction. Good inflation data but earnings concern. The shock absorber absorbs the bank reaction. IV stays low from CPI. Hot CPI + bank misses: the stress test for the structure. The $751 floor and +$327M shock absorber are tested. The accelerators at $748, $740, and $735 are the downside chain if $751 breaks. The structure enters tomorrow positive with a floor at $751, magnets at $755-$760, and the engine at 55% power. It can absorb a normal surprise in either direction. A double miss (hot CPI + bank misses) is the scenario that tests the floor. THE LEVELS: $755.42: bull flag breakout. Fifth pattern. $0.80 above. $756.68: Reverse H&S breakout. $2 above. $754.62: at price. $751: the floor. The breakout level that became support. $748: first accelerator below the floor. $760 is the magnet. $755 is at price. $751 is the floor. Tomorrow is the catalyst. $SPY $QQQ $IWM
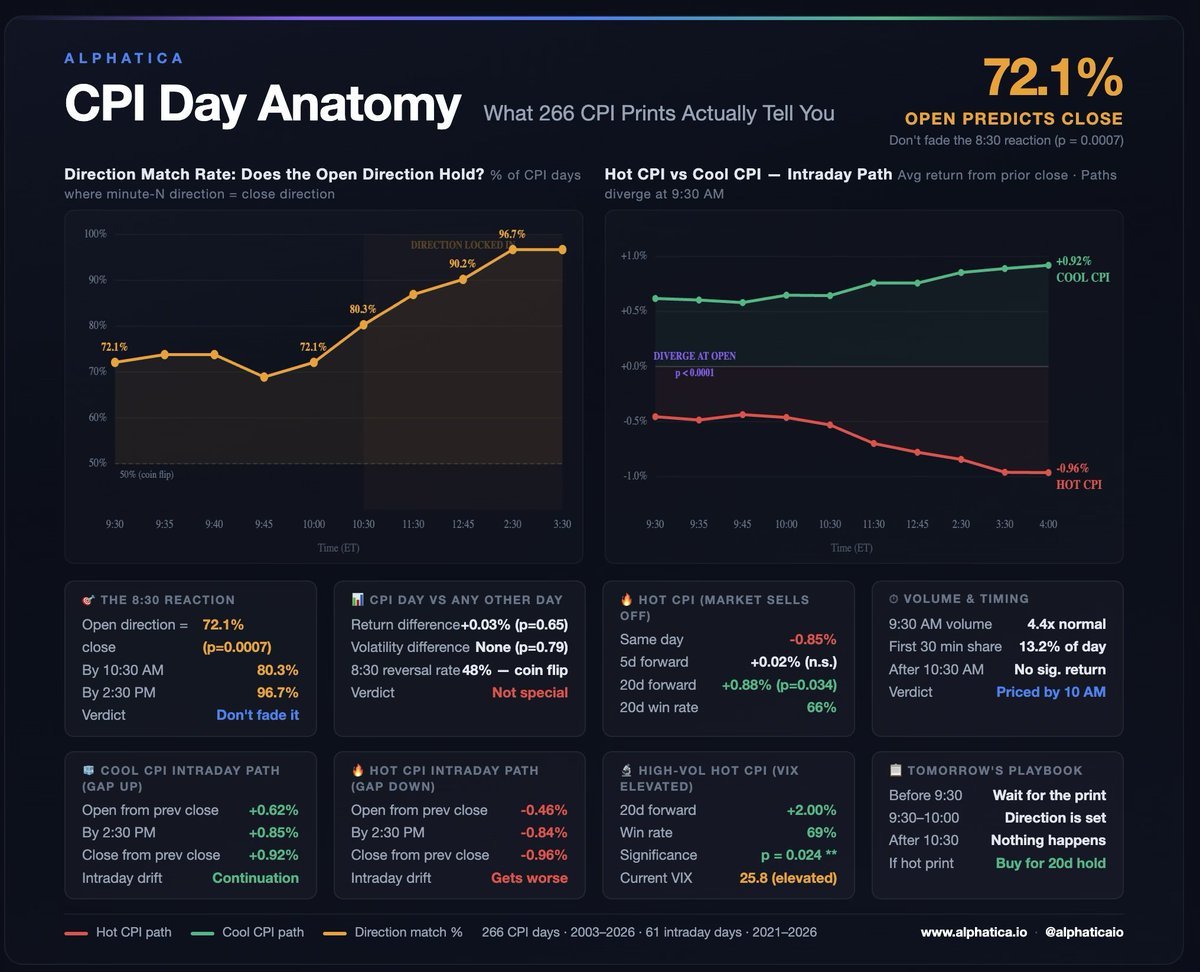
CPI drops at 8:30 AM tomorrow. More than half of FinTwit is positioned right now. We studied 266 CPI releases over 22 years. Here's what the data actually says: CPI day is statistically indistinguishable from any other day. Return difference vs non-CPI days: +0.03% (p = 0.65). Volatility difference: none (p = 0.79). All that positioning is for a day that is no different from a random Tuesday. But here's what does matter. The direction at the open predicts the close 72% of the time (p = 0.0007). By 10:30 AM, it's 80%. By 2:30 PM, 97%. The market prices CPI in the first hour. Everything after that is noise. Don't fade the 8:30 reaction. If it gaps down, it closes down. If it gaps up, it closes up. The data is clear. We also split 61 CPI days into hot prints (market sells off) and cool prints (market rallies). The paths diverge at the open and never converge. Hot CPI days drift lower all day, closing at -0.96%. Cool CPI days drift higher, closing at +0.92%. There is no intraday reversal. The one edge that exists: after a hot CPI, 20-day forward returns are +0.88% with a 66% win rate (p = 0.034). In high-vol regimes like right now (VIX at 25.8), it's +2.00% with 69% win rate. If the print is hot tomorrow and the market sells off the data says buy it for a 20-day hold. Three rules for tomorrow: Before 9:30 — wait for the print 9:30 to 10:00 — direction is set After 10:30 — nothing happens $SPX $SPY $QQQ #CPI #Inflation