@BoringBiz_ Just buy a home with an assumable mortgage. Problem solved
English
G-HardMoney
1.7K posts

@RoamingOptions
Options Trader, Investor and Strategy Developer. Bitcoiner. Opinions are my own and should not be treated as a recommendation.


BREAKING: 30-year mortgage rates have hit 6.75%, per Mortgage Daily News


Florida gulf beaches > California beaches Not even close


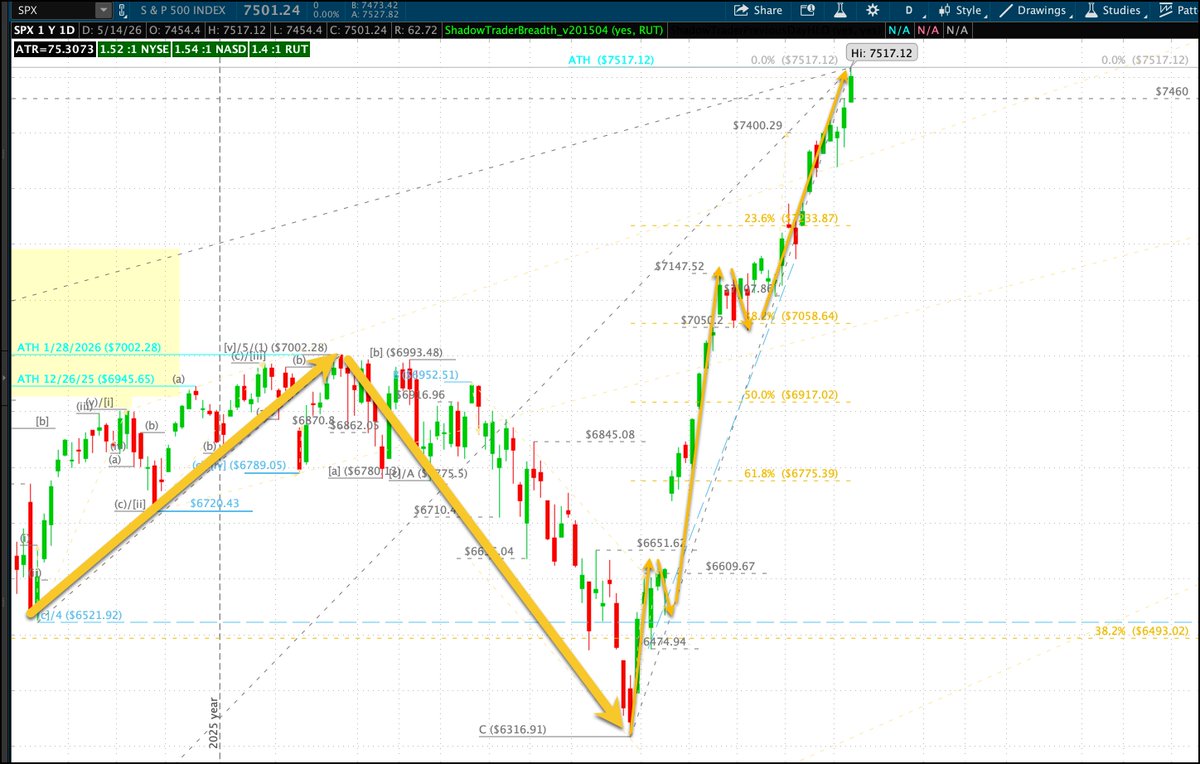
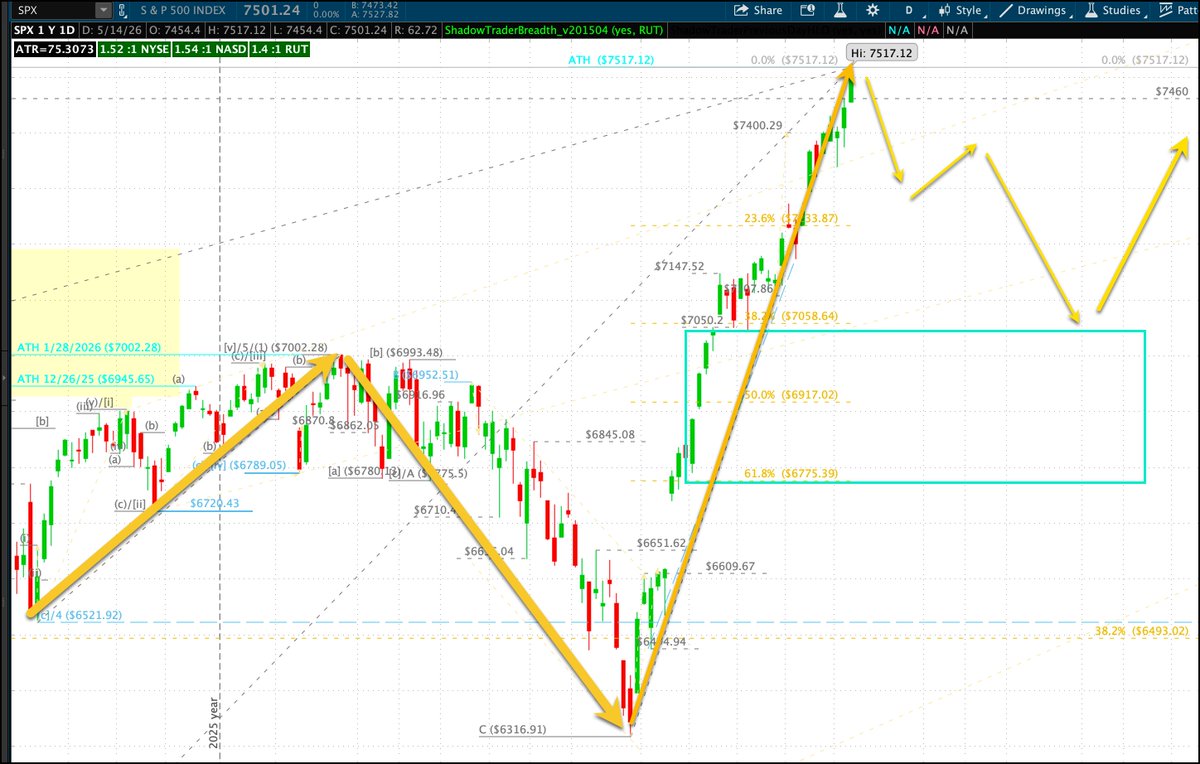
A New Long-Term Projection On March 31st, the day after what we now know to be the Intermediate (2) Correction Low, I wrote: "While 2nd waves typically correct a 1st wave by retracing 38-61% of that 1st wave, they can be shallower (retracing less than 38%) or deeper (retracing as much as the entire 1st wave)." The shallower 2nd wave scenario proved to be the case here, and we can now use Intermediate (1) (which ran from April'25-Jan'26) and Intermediate (2) (which ran from Jan'26-March'26) to project Intermediate (3): More than likely, Intermediate (3) is targeting $SPX 8484-9823 as it will likely extend 100-161% of the length of Intermediate (1) (which was 2167pts). A break of 6609.67 would raise doubts about this projection, and a break of 6316.91 would invalidate it altogether.


SELL. Prepare for at least two rate hikes within the next 6 months. Sticky inflation, war-driven energy risks, and extreme AI bubble valuations are a dangerous mix. The market is still not pricing reality. $SPY $QQQ $NVDA $AMD $MU $INTC $TSLA $MSFT $SMCI $ARM

They are STILLL slapping $SOXS with semis at all time highs again. This is the third largest volume ever on this ticker.


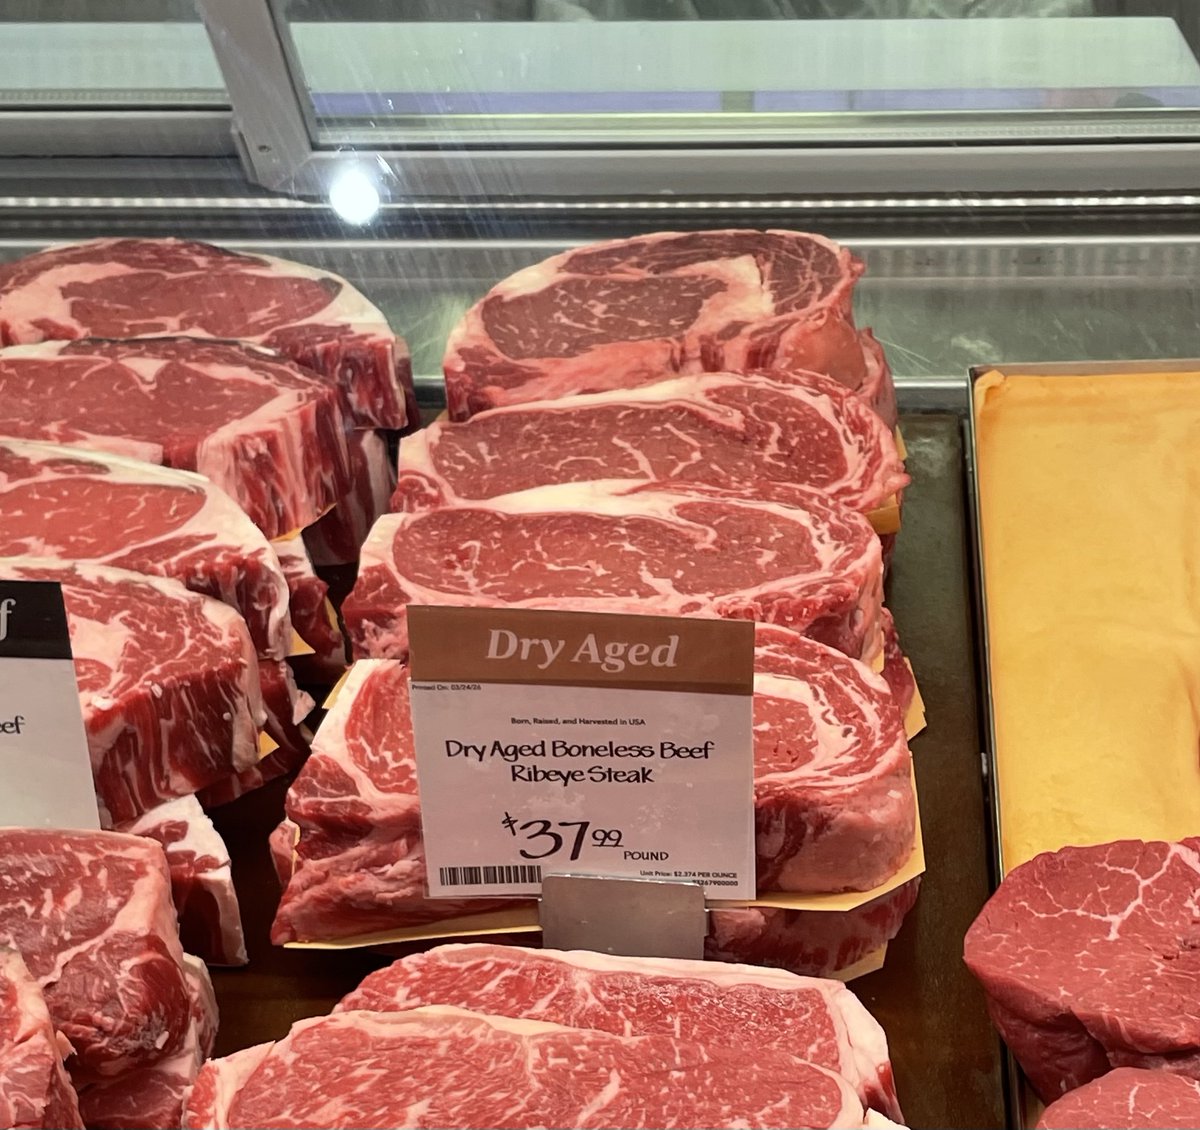
Your favorite all in one inflation index has a price update. Same ribeye at the same store is up 6.2% since June, now $34.49/lb. 19% annualized. Since the prior update in 2024, compound annual inflation is 12.6%. Cumulative 72.5% increase since 2020. Bitcoin is the only way out!