
Rotolight
6.8K posts

Rotolight
@Rotolight
British Manufacturer of multi-award winning on-camera, studio and location LED lighting systems for photography, videography, broadcast and cinematography.
London Katılım Ağustos 2009
940 Takip Edilen4K Takipçiler

Indonesia
@P4006198851394 @BMNRTracker But only after a short term rally which you failed to mention.
English

@BMNRTracker mark newton thinks btc is heading down to 70k and possibly worse around 58k. I wonder how this goes with Tom's own expectations
English

$BMNR mNAV expanded from 0.95 to 0.98 today despite $ETH being red.
Something BIG must be coming..
BMNR MNAV Tracker@BMNRTracker
$BMNR MNAV (Cash) = 0.98 NAV per share = $31.79 $BMNR $31.17 $ETH $3,112
English
@FrontRowBrian @DylanLeClair MSTR primarily, with implications for BMNR
English

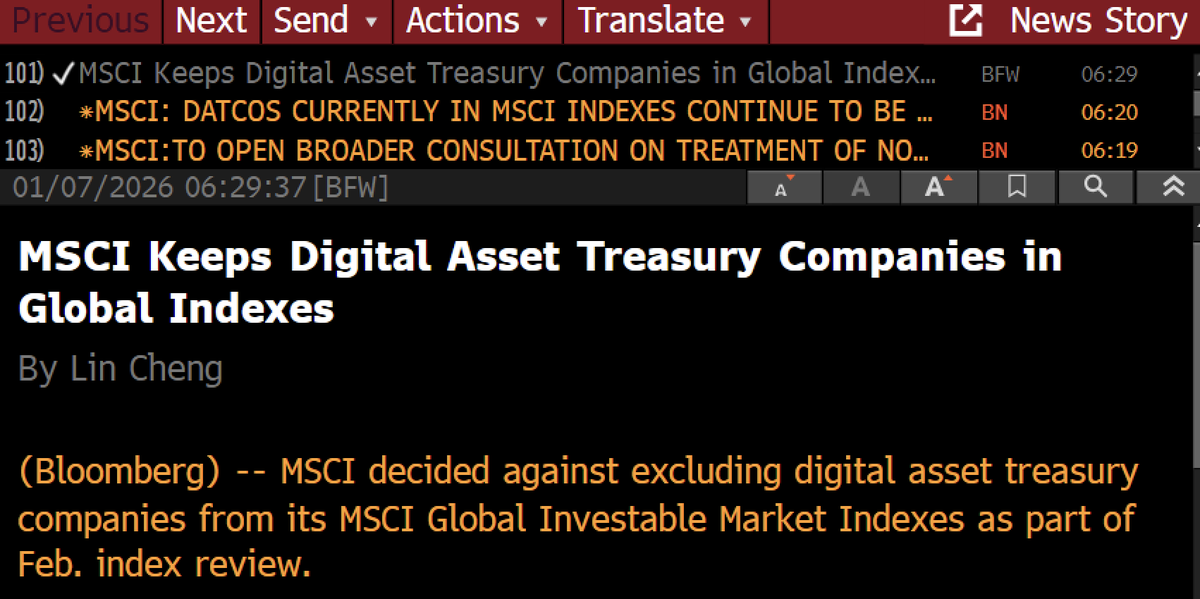
MSCI KEEPS DIGITAL ASSET TREASURY COMPANIES IN GLOBAL INDEXES
English

@DylanLeClair Dylan, grok says this is fake news, Bloomberg did not report ??
English
@KayaCngl @StockTrader_Max Unconfirmed rumours major msci decision next week outcome leading that they will NOT exclude DATs which would be massive positive for crypto and BMNR
English

@StockTrader_Max What happened to bmnr just now after market close
English

I added $280,000 of $BMNR today….
I bought the value of an average house worth 🏡🤝🏼.
$BMNR WILL CREATE FUTURE MILLIONAIRES.

English
$BMNR started the day at a 0.98 mNAV and finished at 1.01
Great day overall. If $ETH keeps going we will see 1.20 before you know it
English
@tripleruoa @donaldjdean Same thought process what approx strike and DTE are you thinking about?
English

@donaldjdean $3400 eth price is around the corner if it can hold and stay above $3100. BMNR will be around $40 at that level.
Will be selling some covered calls at that level.
English

$BMNR BitMine Immersion - World's Largest Corporate ETH Holder (3.41% of Supply)💥 - VIDEO ANALYSIS
2026 Bull Targets @ 1.6x NAV Premium:
$4,000 ETH → $73🚀
$5,000 ETH → $91🌙
$6,000 ETH → $108🔥
English
@astronomer_zero Thanks @astro - with you all the way on this in both BTC and Eth. Are you at all worried about the MSCI decision Jan 15th and risk of a broad sell off from there or how do we deal with that in your view? Should we consider partial TP couple days prior?
English

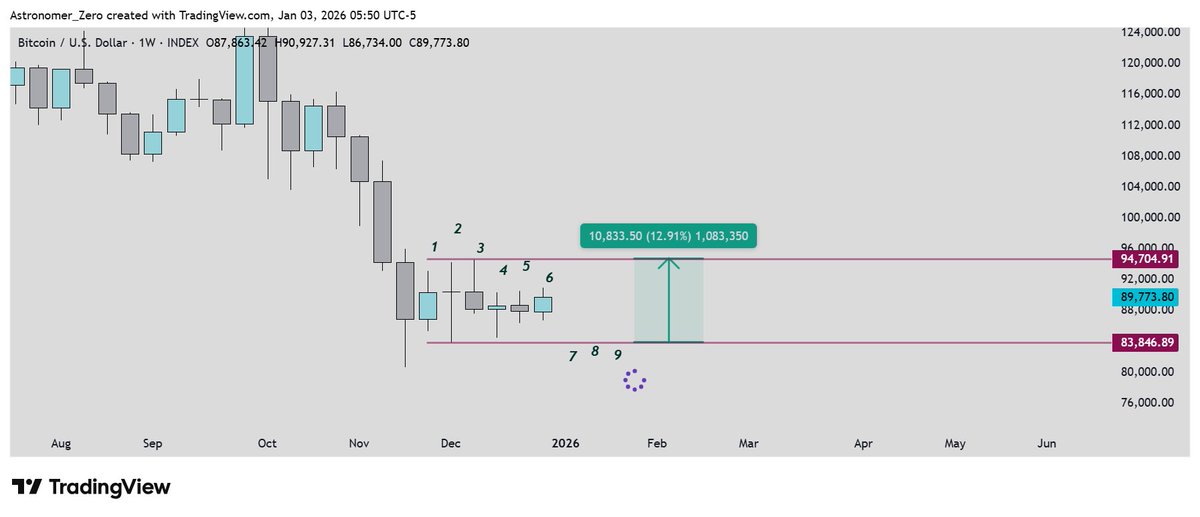
$BTC - our high conviction bottom call
Soon, the counter hits 7 weeks, and I promise you 8 and 9 weeks will hit too.
Good morning.
The title above, has big implications, since it increases the chance this range bottoms us from 93%+ to 95%+, whilst also gives continued "rights" to "buy the dip" during the next two weeks in the framework of our bottom thesis.
And from the numbers above, if we hit 9 weeks, the chances of breaking down and continuing the bear market from here, become virtually negligible. Despite a large majority (LM) presenting promises of "the bear market is coming", the last few weeks. Even if right, the ideas were presented at the worst times (the first few weeks).
I announced how I would continue to track the sentiment as our bottom forms, and in short, it still holds, along with slow confirmation of the analysis.
So just highlighting this key piece of the puzzle here, of why I have been so bullish, and giving you many pieces as to why we go up from here, not down.
And why bearish posts in the 80-85k range, even from reputable names, all power to them, but are, suboptimal for your own financial wellbeing.
Not only that, we actually saw large amounts of people give up their spot bags as well as pound in aggressive shorts.
We highlighted this with detailed order flow metrics, but it was also just visible with the spot discounts (spot price lower than perps), of Coinbase and even liquidity-aggregated spot (BTC:INDEX - the rarer one to go discounted) showing a lower price than binance perps (highest volume). This indeed shows many retail participants, perhaps follower bases of big and reputable names, sold spot into the low.
We do need to see the large whales respond and hold the market again with spot $BTC. Usually, that's a sign the range and subsequent chop are bullish.
But surprise surprise, we are also seeing that type of signature in the order flow right now, slowly but surely. Not sharing much details here, but again, "trust me" and I hint you again: we are indeed seeing that also appear in the spot premium of both Coinbase and BTC:INDEX (aggregated) again, where they are coming back strongly, leaving the bears behind.
That is all so far so good for our bullish thesis in this range our longs, and our thesis of:
"80-85k is a bad time to become bearish and start bear posting, even if it is right eventually". In response to what our timelines mostly looked like.
"Eventually right" is not good enough, not to our standards. That does leave the question, do I think it is right at all? No, and more on that later. But what matters now is being more bullish than ever, one of those peak bullish times, just like we were in March 2025, Sept 2024 and Sept 2023, Aug 2023 and March 2023 - we are seeing a similar type of low, with slight nuances, that is ok.
Those lows do not form in 1 day, they take weeks. Those weeks, are the ones we are counting here, performing analysis to why this is a bottom range and the range we are tracking sentiment in.
Sentiment to its core was still similar to those times I just mentioned, with higher extremes and higher timeframe implications from many. But sentiment remains sentiment. It just had a different context, which, indeed was and still is clearly bearish.
So I remind you to hold on, soon we will reach 7 weeks. And I also promise you 9 weeks of no closes below the low. That increases the chances for a bottom to 95%+, the highest we had so far, and a very high chance to take a trade upon.
Just like we have done, we have indeed taken a long and a spot position trade (action is key).
That is all for me. Continuing to track sentiment here as analysis further confirms.
Once price pushes, we should see more reputation covering, accounts who max bear posted, perhaps suddenly go "can we get a relief rally?", or say things like "this is just a bearish retest", as price rises, or quietness/disappearance, or flip bull as if nothing happened.
All of them, are good enough to push us higher, as long as they are not tied to aggressive buys and indeed just "reputation saves", we will track for that (look what they do, not what they say, and read more so the tone, less so the words).
Whatever it will be, I trust that the sentiment will continue to align with analysis, because if our analysis is correct, it has to align, with the market doing its job (hence why, sentiment is used as confirmation).
We will see. I will get back to you on this, next week.
For now, we remain happy. A comfortable 89.5k is where we are now, should retain without too much downside pressure, mostly upside pressure. And I will share low timeframe details on those thoughts too, on the backbone of our bullish bias shaped in this post.
Enjoy.
Astronomer@astronomer_zero
$BTC - another piece to the puzzle There is a 93%+ chance this range bottoms us (more proof). (#6 opened btw, as promised) Details to come on further implications. Just a small hint for now, lifting a tiny portion of my secrets. We still have many "reputable" influencers continuing to farm the sentiment and continuing on with posting bearish. Yet as $BTC quietly closed another weekly candle, we have just received more proof that our bullish thesis of this range being a bottoming range is correct, and the markets intended direction. This is indeed in sharp contract with the most popular opinion out there, of this being a bearish continuation range for lower. Yet just by opening our eyes ever so slightly, we can see, historically, $BTC has essentially never ranged for 5 candles or more, for less than 15% without a significant move up from that range or making a new cyclical high. Only bullish ranges created this type of pa. The reason why this is, is extensive and has a lot to do with liquidity buildup. But in simple/understandable terms. This is effectively done to bore the user out and to let bearish sentiment develop, before the move up and catching the majority off guard. I have talked about why the sentiment is clearly bearish right now and how it's undeniable almost everyone expects lower especially the last 5 weeks, minus the accounts who post both bull and bearish ideas all the time. My long term followers back testing my data know. (So if you don't believe me, test it yourself). The only exception is Sept/Oct 2018 (no data is perfect - full transparency). But do never compare price action to just one past instance/do never use fractals. As using low sample sizes (of literally 1) is essentially gambling and mostly used by influencers who by definition cherry pick one data point to fit their bias. Instead, best to fully and deeply back test history, then come to a conclusion. Such as all instances where we ranged for less than 15% for 5 or more candles: ➡️Aug-Sept 2025 ➡️Jul-Aug 2025 ➡️May-June 2025 ➡️April-Oct 2024 (2 instances) ➡️June-Dec 2022 (2 instances) ➡️June-Jul 2020 ➡️Jan-Feb 2019 ➡️Oct 2019 (the failed instance) ➡️Nov-Dec 2016 ➡️Aug-Oct 2016 (2 instances) ➡️ April-May 2016 ➡️... ... ... (Continue yourself further, there are more than 15 instances) Indeed, for more than 15 instances, a less than 15% wide range of 5 candles or more has resulted in bull market continuation (new cyclical highs), or a significant move up (such as 112k coming), with only 1 failed instance. That is 14/15 or better i.e. 93% chance plus of us bottoming. I hope that helps you to continue to filter out the bearish noise out there, of the bears loudly and proudly sharing their charts of 60k and lower coming. Unrightfully. Yes, we know most of those big accounts do this just to farm followers and feed off the bearish sentiment, but it does cause a lot of selling at the worst times (during this bottoming range). So here just another piece of trying to put you on the right side of the trade as I always value my, and also your capital the most above anything else. I will have done my job.
English
@PrecisionTrade3 @CasiTrades Thanks @PrecisionTrade3 so BTC closed daily candle more or less on 90K can we still consider this bullish confirmation or does it have to be exactly 90K? Or does weekend performance help validate?
English

@CasiTrades Thank you all for joining! Have the best weekend ❤️
English
@PrecisionTrade3 @PrecisionTrade3 do you worry about impact of Msci or you think it’s largely priced in?
English
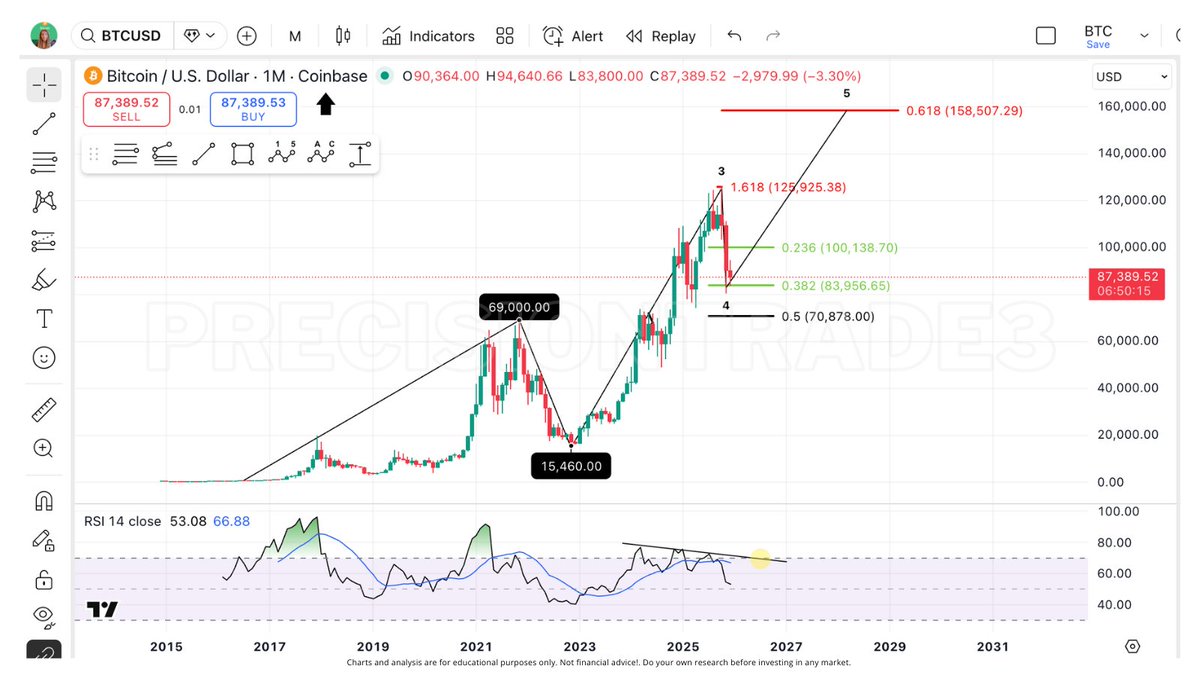
Wow.. last #Bitcoin chart of 2025! 🎇
We have the yearly, monthly, and daily closing above the macro .382 support! Next month and year should be GREEN! 🤑
Here's what I'm expecting:
Q1 - Push up and test the $103k resistance then small correction
Q2 - Breakout of ATH and then reaching W3 (~$130k)
Q3- Q4 - Small correction and then push to 5th Wave Cycle top (~$155k)
I'm so excited for the year ahead of us and the opportunities we get to be a part of! Sending my love to all of you and your families!
I hope 2026 brings many blessings and happiness!
Happy New Year!! 🥂
English
Rotolight retweetledi


@DPhotographer I wish them well. Have several of there lights and have enjoyed going along to there events as well
English

Rotolight enters administration, but "remains hopeful" the brand will continue trib.al/jKZdvnC
English
Rotolight retweetledi

Elevate your photography with the SmokeNinja 📸
Order yours here 👉 ow.ly/g8QK50TaGba
@CanonUKandIE
@Rotolight
@SmokeNinja
English
Rotolight retweetledi

Meet the latest innovation from @Rotolight: the Anova Pro 3!
This cutting-edge fixture, built with gaffers and filmmakers in mind, is an all-weather powerhouse with a range of industry-first features.
Full video: bcineplayer.com/bsc-expo-2024-…
#ad
English
Celebrating 15 years of Rotolight with our biggest sale ever! Hurry over to rotolight.com/sale before it ends!

English

Join us at Booth 118 during the upcoming #BSCExpo next week, where we'll be showcasing our latest innovation: the Anova Pro 3, an all-weather powerhouse, and the SmokeNINJA, the cutting-edge next-generation smoke machine! 📷 #rotolight #smokeninja

English
