Sabitlenmiş Tweet

$USO Update on this USO thread 👇
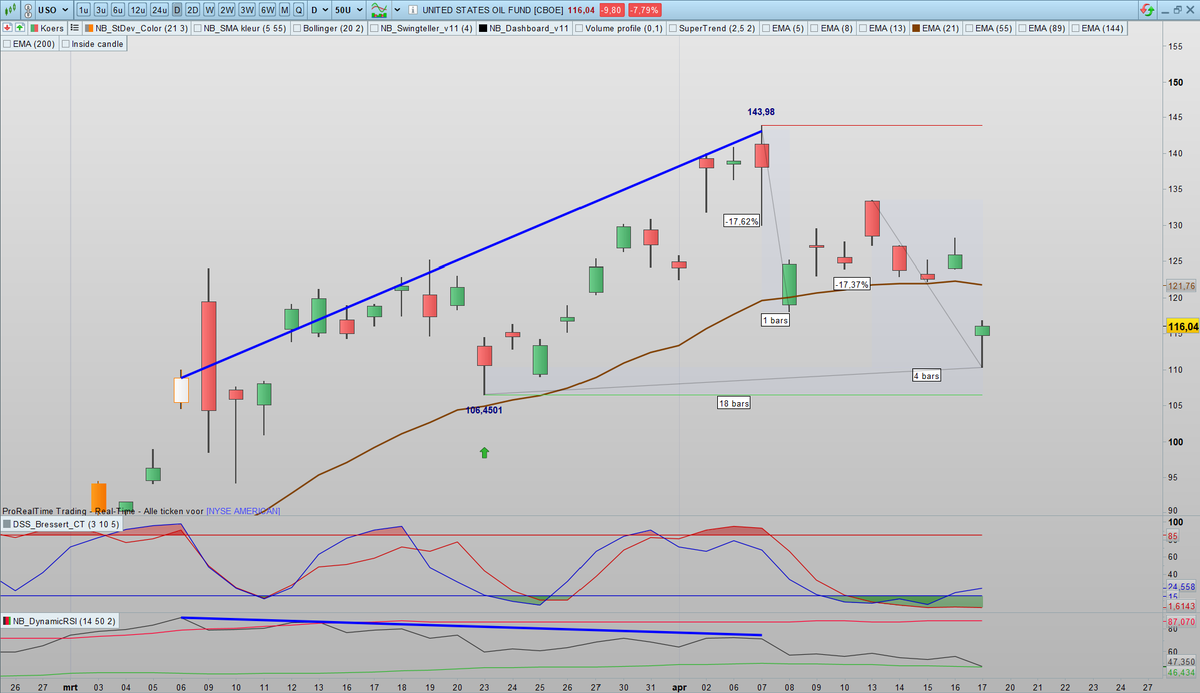
After the initial -17% move, I pointed out:
Expect a relief bounce → but only a lower high → then renewed short opportunities.
That scenario played out exactly. ✅
The bounce came.
The lower high was set.
And then another -17% move followed.
Indeed, the lows weren't in! 🎯
Want to follow the full playbook instead of just single trades?
Try it for yourself: 4 weeks access for just $0.99/week!
Not satisfied within 14 days? You get your money back — no questions asked.
Start here 👇
sdctrader.com/checkout/tradi…

SDC Trader@SDCtrader
$USO United States Oil Fund Went over -17% in one day. Most traders only panicked when it was already too late. My members were prepared. Here’s how 👇
English