Sabitlenmiş Tweet
SA
20 posts


SA retweetledi

The Treasury Buyback Surge, the Sovereign Debt Spiral
🧵
1-The man who saved the US financial system in 2008 just went on Bloomberg and said:
"We need an emergency break-the-glass plan. Ready to go when we hit the wall."
That man is Hank Paulson.
He doesn't do false alarms.
One hour after he said that the Treasury did something quietly. 👇
2-The US Treasury bought back $15 BILLION of its own debt.
One morning. One operation.
The market begged to sell $40 billion worth.
Treasury said: we'll only take $15B
Still 2.7x oversubscribed.
When holders are that desperate to exit something is wrong. 🔴
3-This isn't new. But the speed is terrifying.
2024: $2B/week
Early 2025: $4B/week
April 2026: in a single shot
7.5x in 18 months.
Think about what that means. The Treasury is becoming the buyer of its own debt.
That only happens when everyone else is leaving. 🚪
4-So who left?
In 2015, foreign central banks bought 34 cents of every dollar of new US debt.
Today: 24 cents.
10 percentage points. Hundreds of billions per year. Gone.
Not rotating. Not pausing.
Structurally exiting. And they're not coming back. 📉
5-The biggest exit China.
Peak holdings (Nov 2013) $1.316 TRILLION
Today ~$693 billion
That's $623 billion sold over 13 years. 47% gone
This is not a trade. This is not profit-taking.
This is "we don't trust your currency as a neutral asset anymore."
The 2022 Russia sanctions told every central bank on earth: your reserves can be frozen. China listened. 🧊
6-what's actually happening.
The US needs to roll $36 TRILLION in debt.
The buyers who used to show up automatically aren't.
So the Treasury steps in and buys its own paper.
But where does the money come from?
The Fed. And when the Fed prints to buy bonds
the dollar falls
Inflation rises
Capital flees
Yields spike again.
This loop has a name. 👇
7-The Sovereign Debt Spiral.
It's not a theory. It's a mechanism.
And it has played out in living memory three different times, three different ways.
Let me show you. 📖
8- UK. September 2022.
Liz Truss announces £45B in unfunded tax cuts on a Friday
By the following Tuesday, UK 10-year gilt yields spike 100+ basis points.
Pension funds across the country start getting margin calls. Collapse is hours away
Bank of England does emergency bond purchases to stop it.
Truss resigns 45 days later.
A prime minister removed by a bond market. Not voters. Not Parliament. The bond market. 🇬🇧
9-That was the mild version.
Greece, 2010–2012: Can't print euros. Yields go 5% → 38%. International bailout. Bondholders forced to take 53.5% haircuts. Real austerity. Social collapse.
Argentina, ongoing Can print pesos. Printed too many. 8 pesos per dollar in 2014. 1,451 pesos per dollar today. Nine sovereign defaults.
Printing your way out doesn't end the spiral. It feeds it.🌀
10-Data point.
The IMF's SDR basket the 5 most important currencies on earth.
2021-China's 10-year yield was the HIGHEST. Riskiest sovereign in the basket. (+2.95%)
2026-China's 10-year yield is the LOWEST. Safest sovereign in the basket. (1.75%)
US yield- 4.26%. Second riskiest.
The world is pricing US fiscal risk above China's. Let that land.
11-And zoom out to the longest run chart.
The long-run data provides the starkest context for the current environment. On August 15, 1971, President Nixon closed the gold window ending the Bretton Woods system under which the dollar was convertible to gold at $35 per ounce. The dollar became a pure fiat currency, backed only by the credibility of US fiscal and monetary institutions.
Fifty-five years later, the arithmetic is unambiguous. Gold traded at $35/oz in 1971. By April 2026, it trades at approximately $4,800/oz. The dollar's purchasing power against gold has declined by approximately 99% from a baseline of 100% in 1971 to 0.7% today. Put differently: what cost one gold dollar in 1971 costs approximately 137 fiat dollars in 2026.
This is not a gold story. It is a dollar story. The purchasing power loss against gold is simply the most legible long-run measure of monetary debasement an asset with no counterparty risk, no cash flows to discount, and a supply that increases at approximately 1.5% per year. The dollar has lost against this baseline not because gold became more valuable, but because the dollar was diluted.
12/So where did the smartest, slowest, most conservative institutional money go?
Central banks the ones who set monetary policy started hoarding gold.
2020- 255 tonnes 2021- 450 tonnes 2022- 1,082 tonnes ← something changed here 2023: 1,050 tonnes 2024-1,045 tonnes
3 straight years above 1,000 tonnes.
First time since the 1950s.
When the people who run the system start exiting the system's assets pay attention. 🥇
13-The Rotation Where Smart Money Moved
Against this backdrop, the behaviour of institutional capital in recent years is consistent with a single thesis large-scale, patient capital has been rotating out of printable assets and into unprintable ones.
The Printable / Unprintable Framework
The core distinction that matters in a monetary debasement environment is not risk vs. safe, or liquid vs. illiquid. It is can the government print this asset.
PRINTABLE assets dollars, US Treasuries, most sovereign bonds, savings accounts can be created by government decree. Their supply is uncapped. In a fiscal dominance environment, they are the assets that absorb the dilution.
UNPRINTABLE assets gold, productive land, real businesses with pricing power, physical commodities, Bitcoin cannot be created by political decision. Their supply is physically or mathematically constrained. In a monetary debasement environment, they are the stores of value that capital rotates toward.
15-What the Paulson Warning Means
Hank Paulson is not a gold bug or a perma-bear. He is the man who designed TARP the most aggressive financial system intervention in US history and executed it in real time during the 2008 crisis. When he calls for a break-the-glass plan to be placed on the shelf in readiness, he is not predicting catastrophe. He is describing what prudent crisis management looks like when you have seen how fast the system can deteriorate.
In 2008, the problem was bank balance sheets. Toxic mortgage assets had destroyed the equity capital of the major financial institutions. The solution TARP was to recapitalize those institutions using government borrowing. The balance sheet of the government was the solution.
In 2026, the concern is different. The balance sheet of the government IS the problem. The US government carries approximately $36 trillion in debt, with annual interest expense approaching $1 trillion. The structural buyer base for that debt has declined by 10 percentage points. The dollar has lost 99% of its purchasing power against the hardest asset in history. And the man who saved the system in 2008 is calling for emergency plans.
The story told by the data in this paper is not one of imminent collapse. It is a story of structural deterioration that has been underway for a decade and is now reaching an inflection point.
Thank you for reading this thread. I hope you found it valuable😇👊👌
English
SA retweetledi

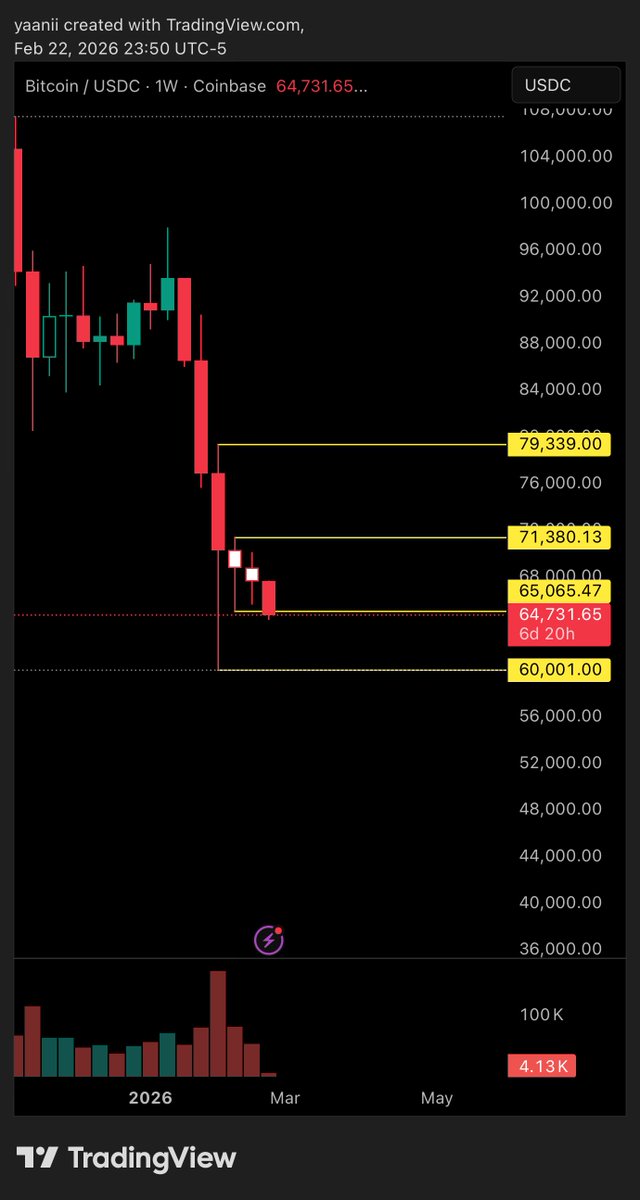
BTC weekly structure update:
Price is currently compressing inside a clear double inside bar within the mother range:
79.3k — range high
71.3k — key reclaim level
65k — local pivot
60k — range low
This type of weekly compression historically precedes a major expansion move on BTC.
But what matters most here is volume behavior.
We just saw a high-volume capitulation week followed by declining volume during consolidation.
That combination usually signals seller exhaustion and volatility contraction before expansion.
In past cycles, when BTC prints heavy sell volume into a range low and then volume dries up during inside bars, the market is often preparing for a liquidity sweep and reversal rather than immediate continuation.
Primary scenario: bear trap → rally
A sweep below 60k would take liquidity and trigger panic. If BTC reclaims back above 65k–71k on rising volume, that would signal acceptance back into the range and likely mark the start of a multi-week expansion phase.
Secondary scenario: true breakdown
If BTC gets a weekly close below 60k with expanding sell volume and acceptance under the range, then this shifts from compression into continuation and opens deeper downside before any meaningful altcoin rotation.
Key insight:
Double inside bars with declining volume rarely resolve quietly.
They tend to lead to a volatility expansion once the range breaks.
Watch the reaction to volume on the break — not just the level.
Compression + declining volume = expansion coming.
English
SA retweetledi

GOLD RAN FIRST.
SILVER BROKE OUT.
That’s your liquidity signal.
Hard assets lead when liquidity returns.
Crypto follows after the flush.
Short-term pressure is normal.
But if Bitcoin holds $74K…
This is accumulation, not a breakdown.
English
SA retweetledi

SA retweetledi

SA retweetledi

GOLD (XAUUSD) 🎯
TP 2 🎯✅ New All-Time High
👇
05-JAN-2026
x.com/MunasarMoh/sta…
18-DEC-2025
tradingview.com/x/aKXbjtAk
Gold markaan iska so naso waa daashay 🤣
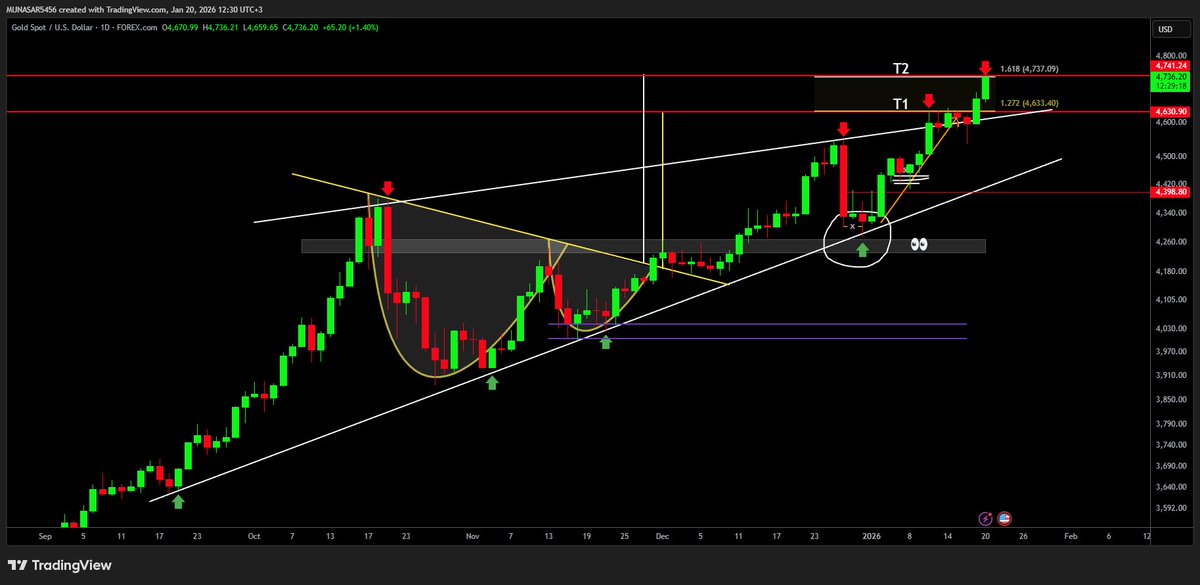
Munasar Moha@MunasarMoh
GOLD (XAUUSD) TP 1 🎯✅ New All-Time High TP 2 ⌛️⌛️ x.com/MunasarMoh/sta…
Filipino
SA retweetledi

SA retweetledi


SA retweetledi

Trump has history of making important announcements/policy changes at strategic timing. If a policy or decision aligns with his financial interests (whether personal or interests of companies he’s associated with, he’s using his position to create favorable market conditions!
English