SierraChart retweetledi

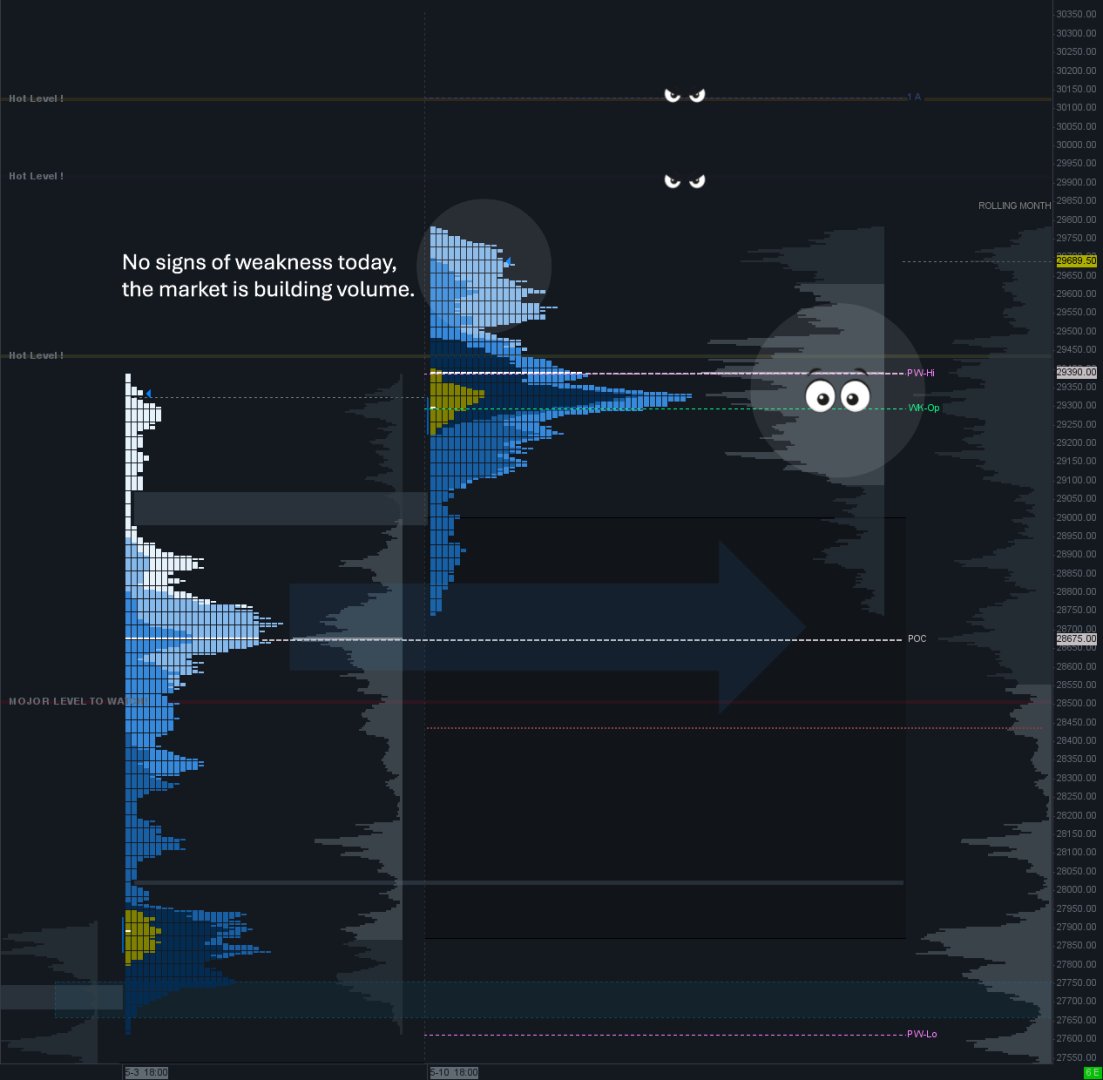
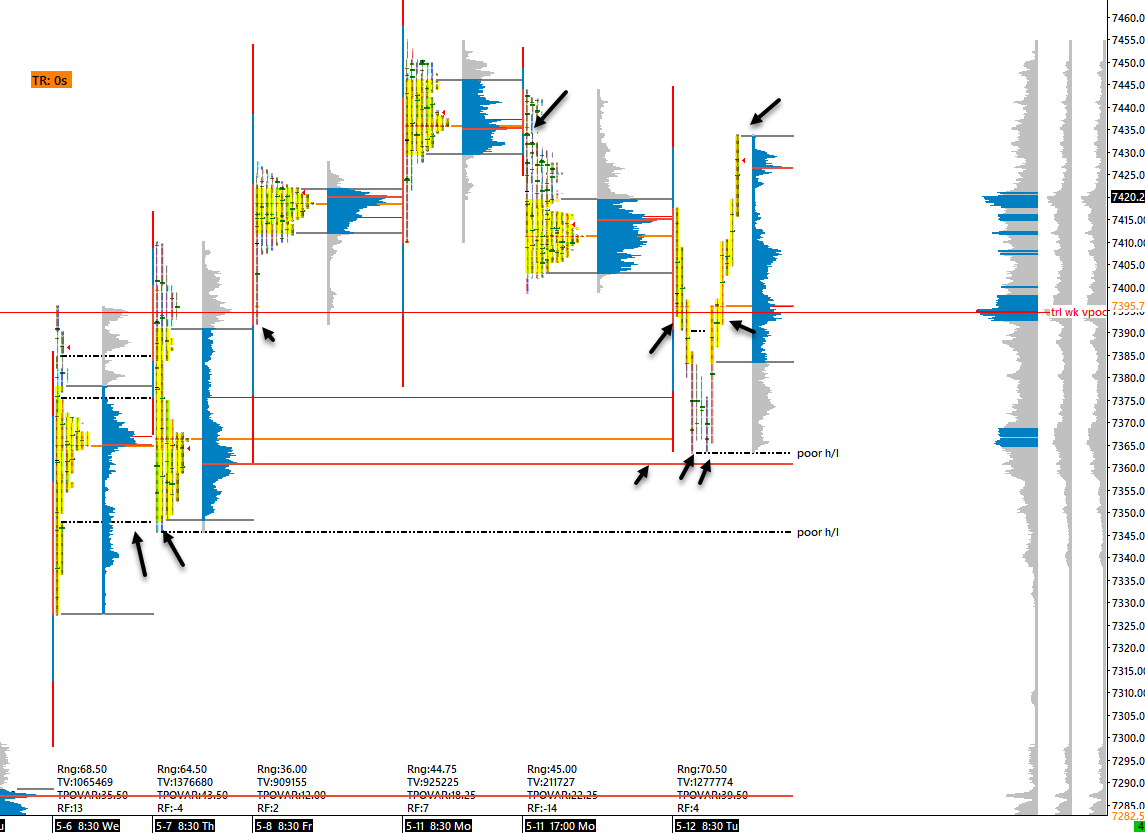
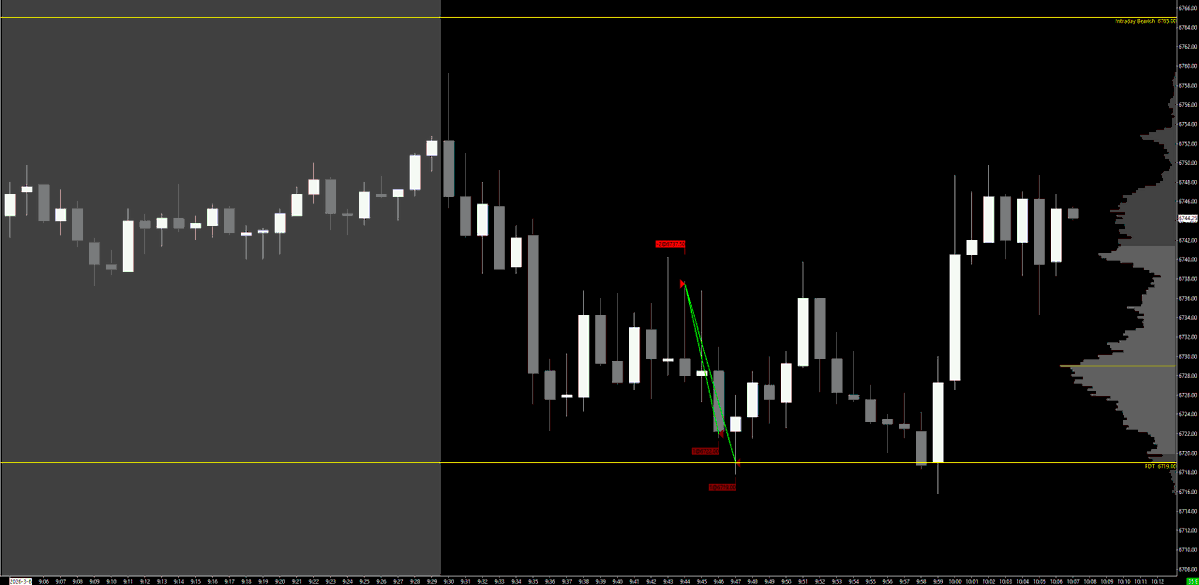
Other than scalping rotations off orderflow activity, it’s been a session to forget.
$ES
English
SierraChart
852 posts

@SierraChart
Sierra Chart is a professional desktop Trading and Charting platform for the financial markets.


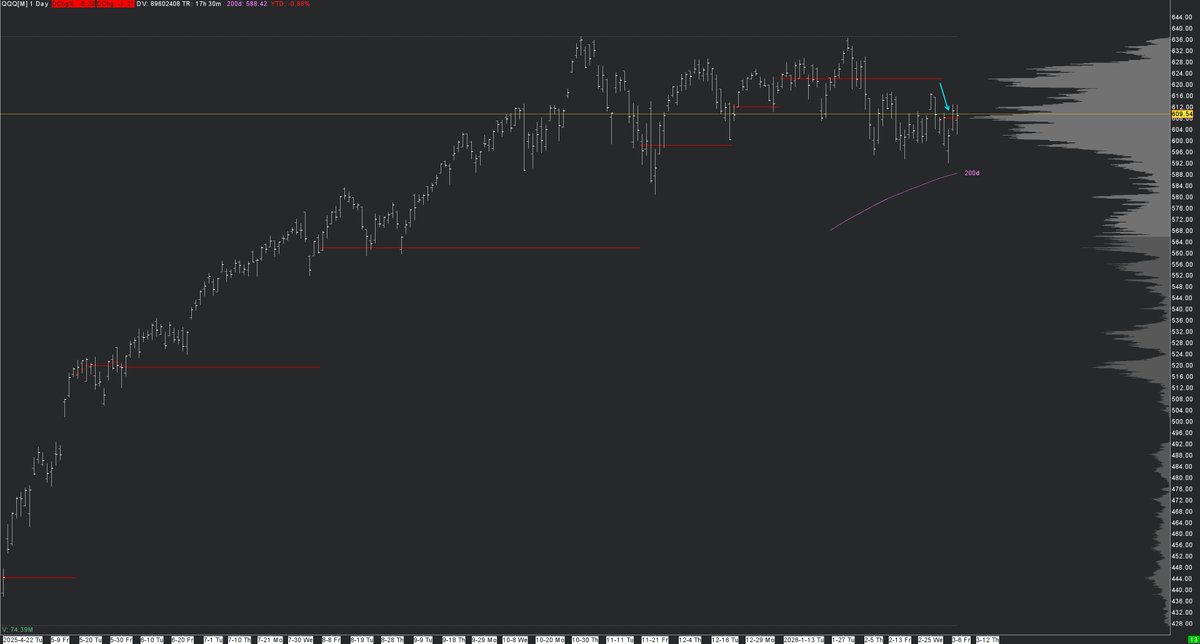
The now-famous $SPY 683 sits just below today's current low ... it's still a 🧲 My sentiment remains: sellers are not "for real" unless they can at least sustain one entire day's trade below the post-tariff-low developing VPOC, currently at 683. That hasn't been done since May 23, 2025. This market seems to be showing hairline cracks (the death of software stocks, the rise of defensive names, the totally overcooked AI narrative...). But until they show me a day where we trade completely below 683, the structure for long continuation is firmly intact. Is this market ready for a real correction? (I hope so...) Fine, prove it! $QQQ #ES_F #NQ_F