Sabitlenmiş Tweet

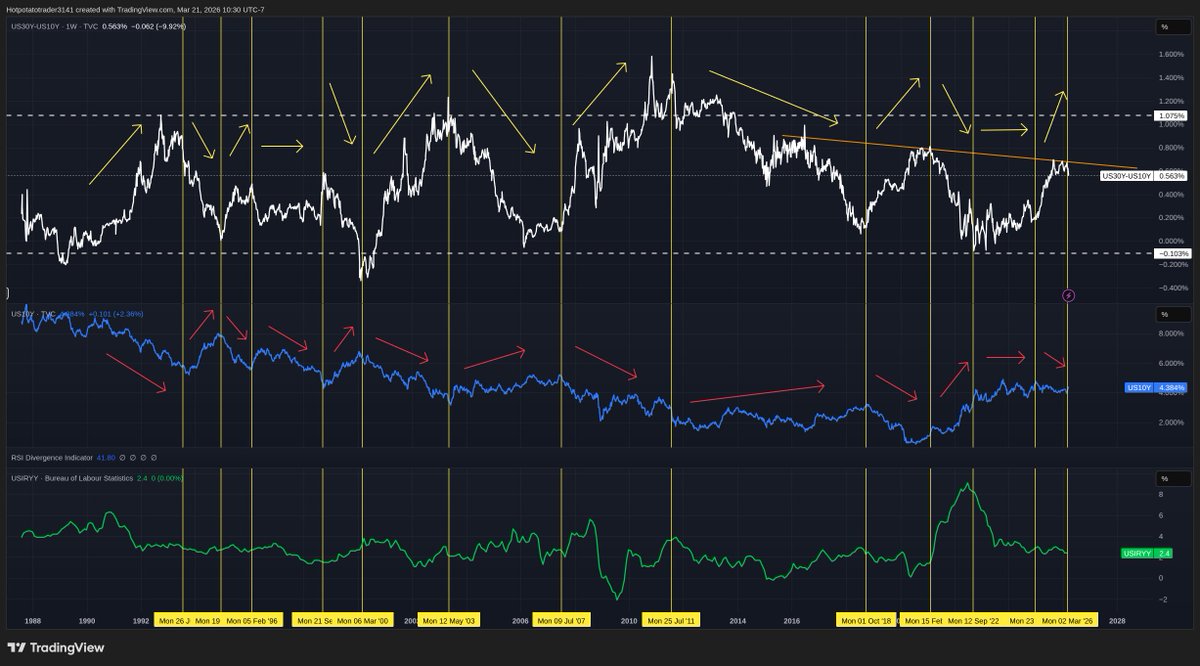
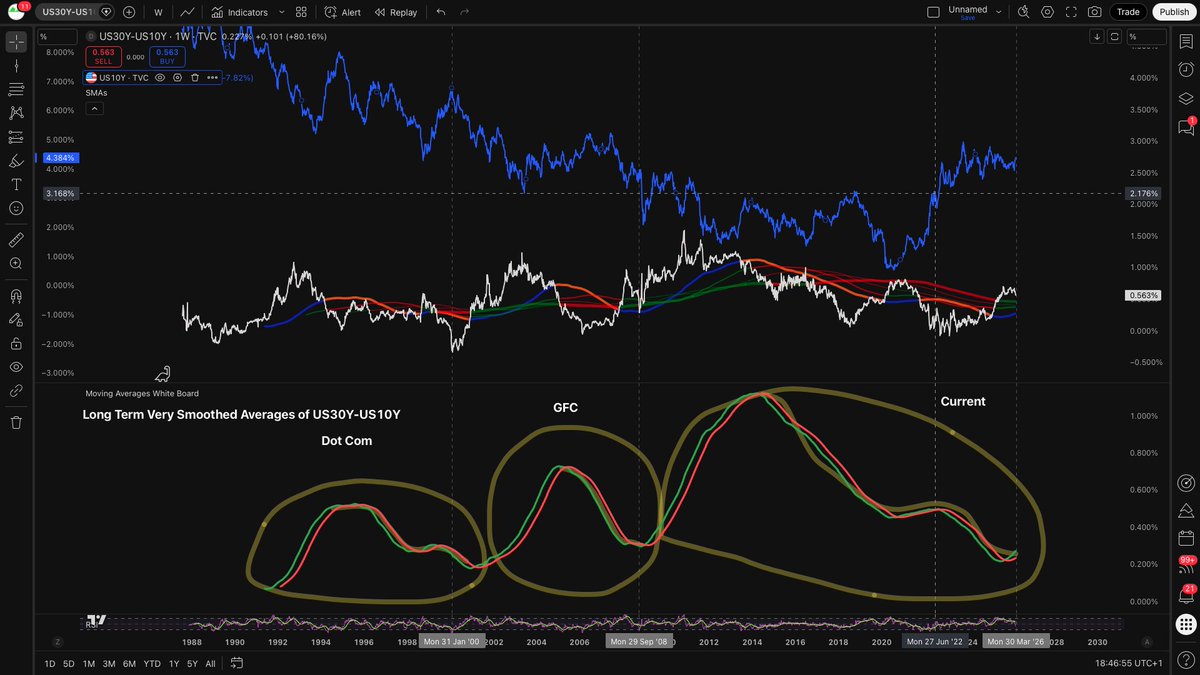
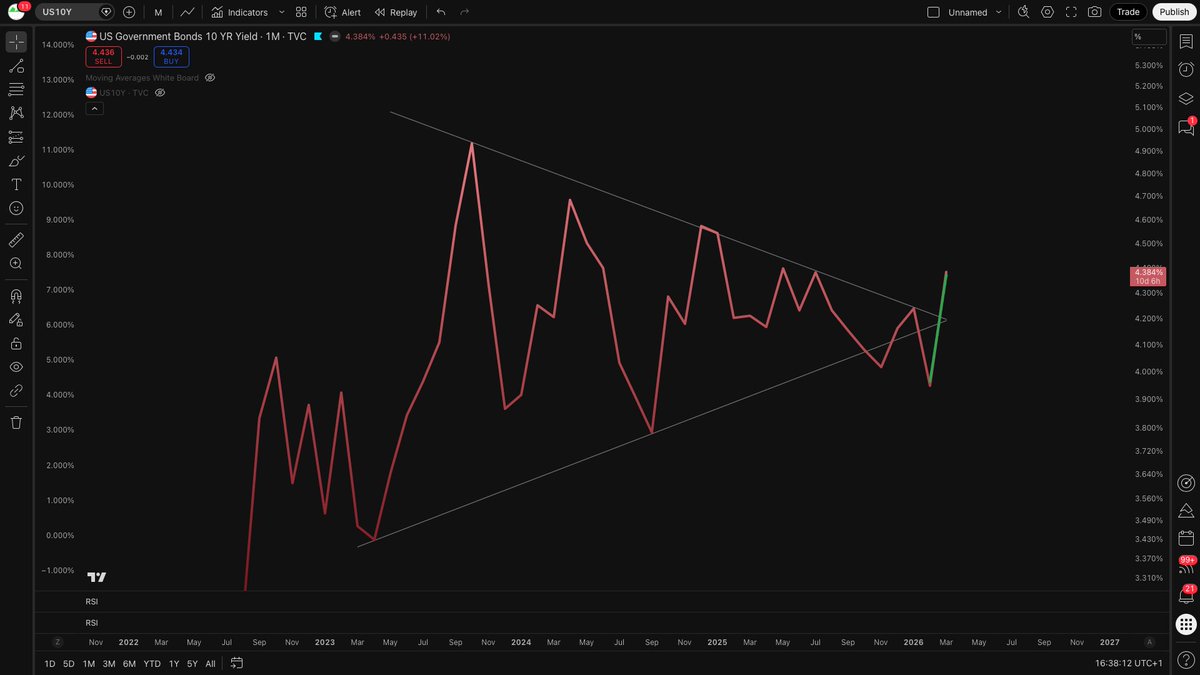
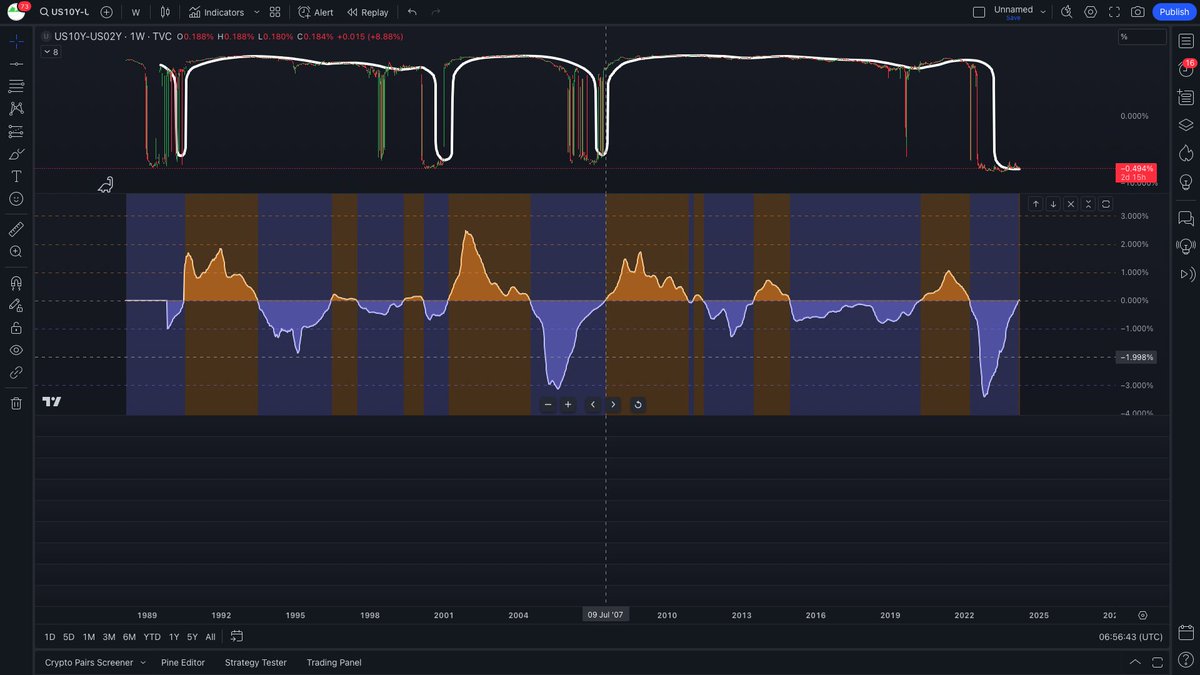
The yield curve is unpredictable
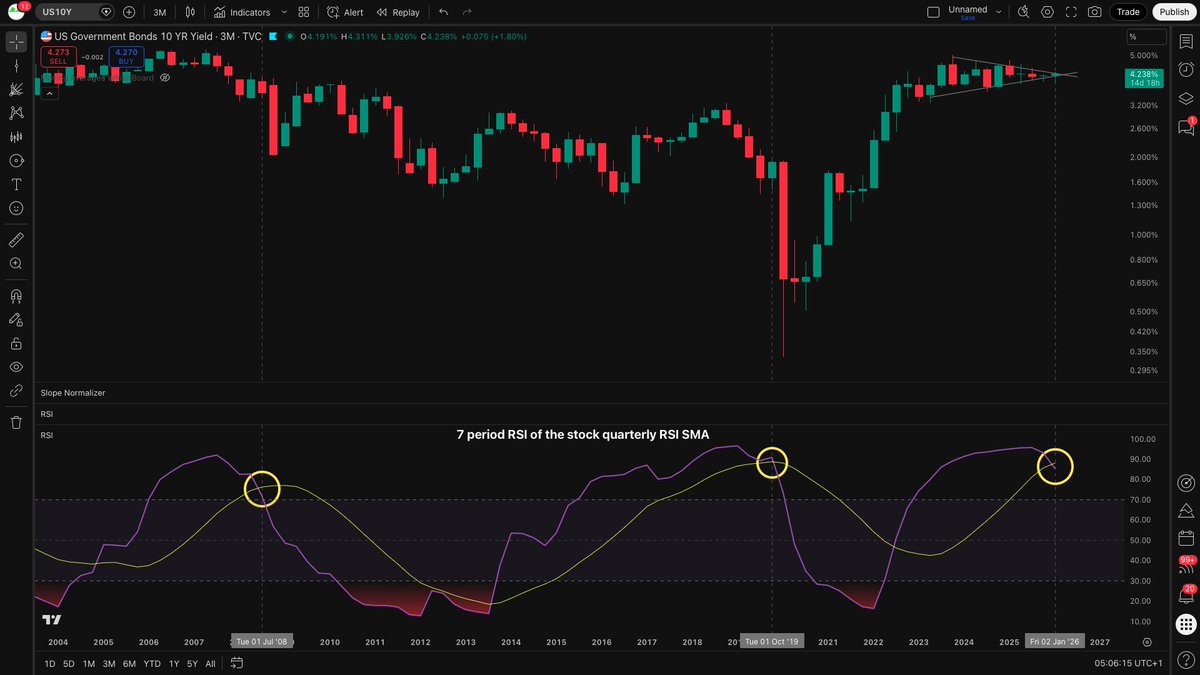
But the very long term moving average of the yield curve is nearly a perfect deterministic mathematical function
Its first derivative is screaming "time for un-inversion"
You might want to start paying attention
English