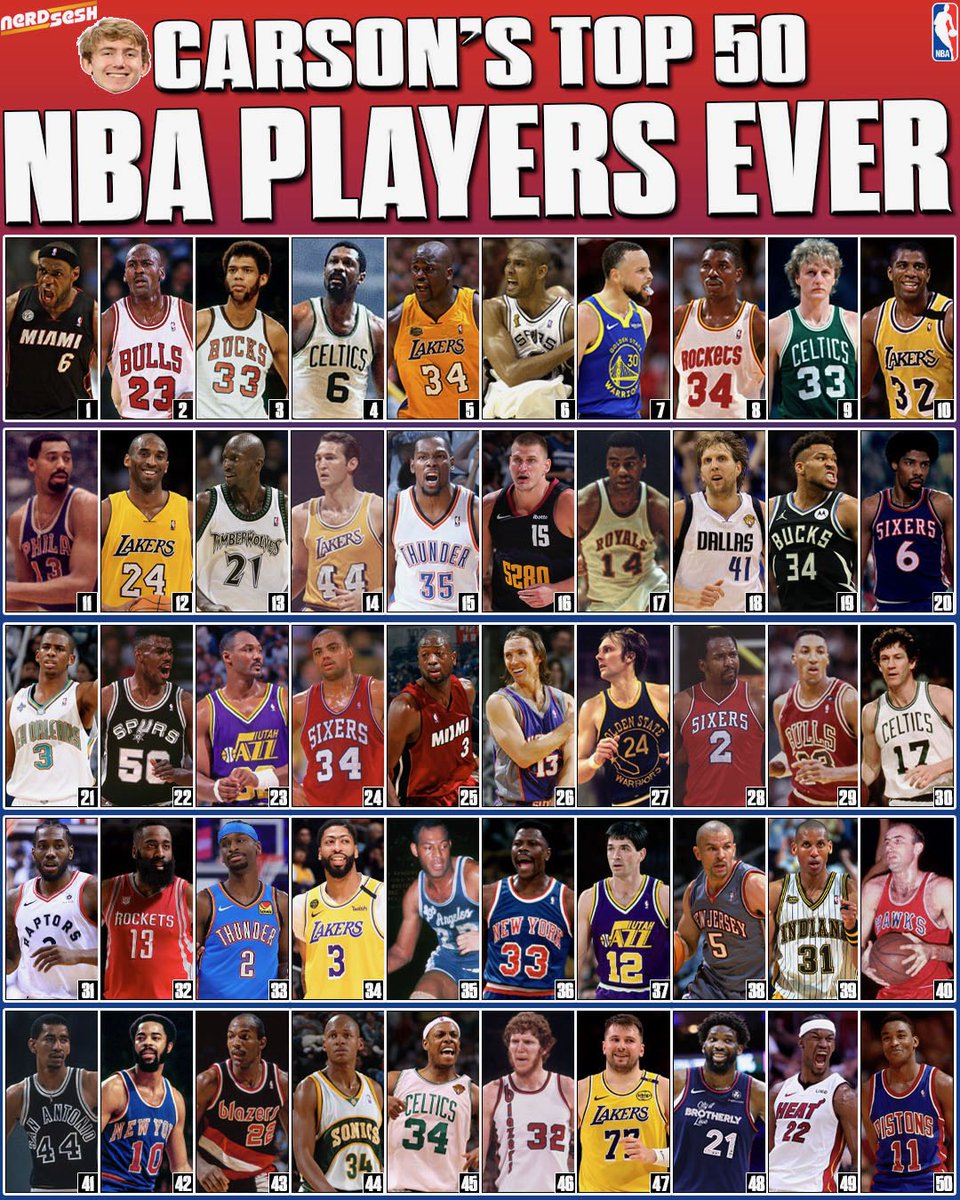
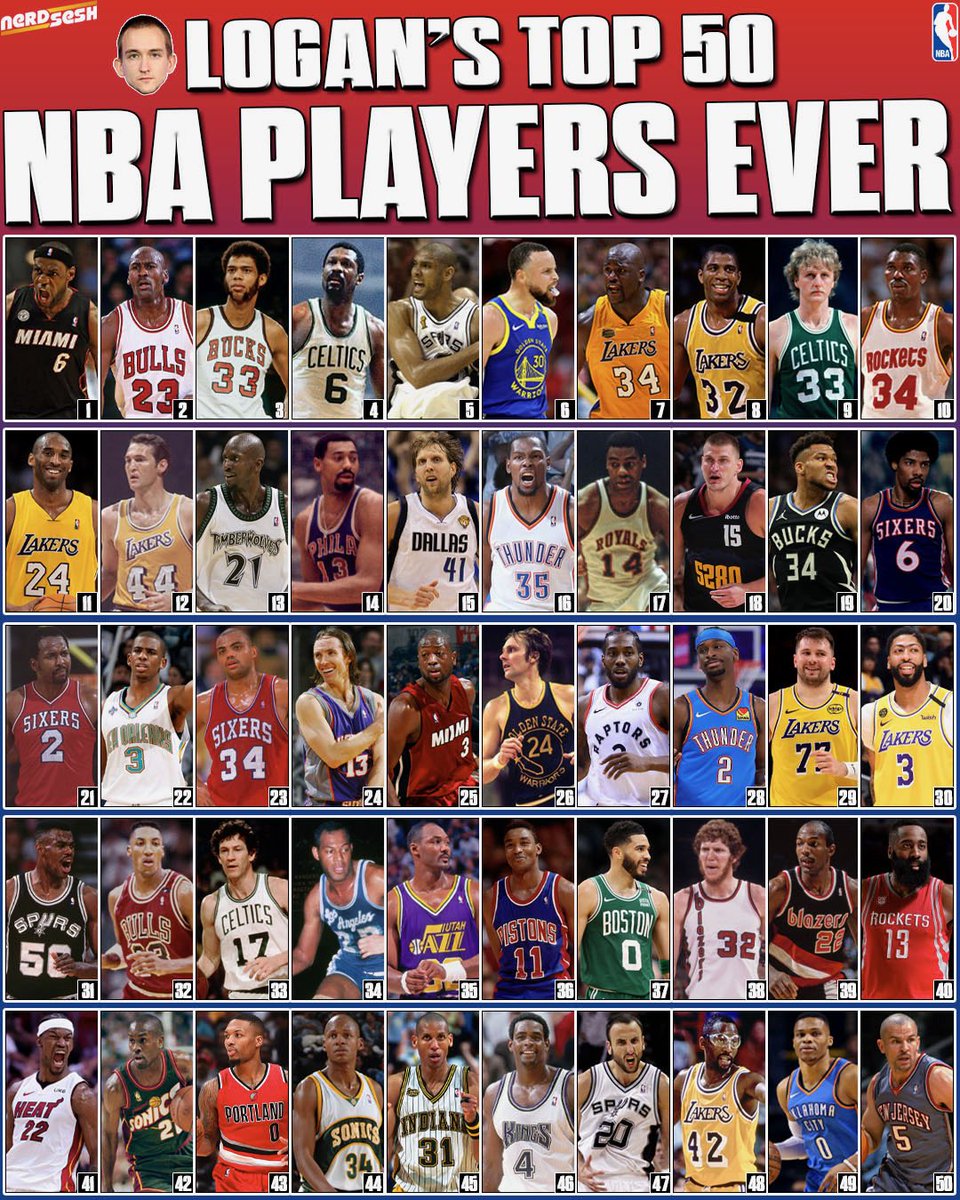
Sabitlenmiş Tweet
SportsStatsFan
50.6K posts

SportsStatsFan
@SportsStatsFan
I fact check and I provide historical context. Formerly @SportsNMore1453 Feel free to use my graphics to fact check others. https://t.co/i3NZ9yOBmI
Reality Katılım Nisan 2023
1K Takip Edilen3.5K Takipçiler

“Dad, how good was Steve Kerr?”
So easy to find screenshots of players being roughed up a little.

Mark Jackson’s Burner@casualtakeking
“Dad, how good was LeBron James at 41?”
English

@Imeli692 What does that have to do with the increase in Ortg in 2002 that you claimed to be small?
You’re so LeTarded you cant stop making dumb arguments you can’t defend
English

@SportsStatsFan The avg OTRG in the mid 90s was at a 108 … the NBA didn’t get back to that avg until 2009 than the next time they avg above a 108 was 2017
English

@Imeli692 Giannis wasn’t in the league in 2012. Dirk wasn’t his top 8 season. Shaq was retired. Etc
You can’t defend against the facts that 2012 was a weak era
Also, Jordan faced tougher postseason competition but that was your goal to shift away from 2012-2016 being a weak era

English

@SportsStatsFan BR Top 30 players
LeBron won over
CP3 Giannis Wade (W) Dirk Jokic KG (W) KD Kobe Curry Duncan Shaq (W)
MJ won over
Stockton IT (W) Barkley K.Malone M.Malone (W) Robinson KG (Y) Hakeem Kobe (Y) Bird (W) Duncan (Y) Shaq Magic
W = Washed when they won
Y = Young & before prime
English

@Imeli692 So through 2020 for Bron? So Jordan almost 5ppg better and LeBron is +1.6%rTS better? That means Jordan’s certainly better scorer
Per 75:
MJ 32.5pts
Bron 27.9pts
And that gap is bigger in the finals!
Jordan:

English

@SportsStatsFan Playoffs
LeBron 28.8 PPG on +3.6 efg% & +4.3 ts%
MJ 33.4 PPG on +1.4 efg% & +2.7 ts%
Lebrons is +2.2 efg% & 1.6 ts% in the playoffs (Same Years Used Minus 2019)
English

@WorldWarGriff23 @RayBill2 @realapp Shows how LeTarded you are
MJ +5ppg at nearly the SAME relative efficiency as LeBalco in the postseason
Imagine stupid and using pts per fga and not relative efficiency. Your method would mean all the top 4-5 scorers today are better than peak LeBron!

English

Most 30-PT games in 18th season or later:
109 — LeBron James
17 — Kevin Durant
12 — Kobe Bryant
Real App@realapp
Kevin Durant has the 2nd most 30-point games by a player in their 18th season or later. Only LeBron has more.
English


@keikiXBT If we see another LeBron then that’s another player better than Kobe and Jordan
English


@BronWorld Also season 13 for Jordan an 19 for LeBron, Jordan was damn near washed
English


@WorldWarGriff23 @BronWorld @BronMuse And now divided by 87.6 possessions then multiply by 75 possessions
You LeTarded

English

@WorldWarGriff23 @BronWorld @BronMuse Literally his per 75 stats. He played 45.7min per game or 87.6 possessions per game
English

@SportsStatsFan @BronWorld @BronMuse Man gtfo that wasn’t his stats lol, outside of the 39% field goal which makes sense when its 1 on 5
English


@FinalBoss53 @RichSantoro1 @SeecretWeapon @yerkio92 @Bibssy23 @Ericsf99Frank @schumakew @Yev_007 @IAMKINGKINGAMI @khaotic322 @striving2bking @YIN_and_YANG_oo
@haiti4eva @dllthinawa @1of1MemGroup
SportsStatsFan@SportsStatsFan
LeBron's postseason clutch stats with the Lakers per 75 possessions: 20.2pts 34%fg 4.9ast 4.9tov He has NOT been clutch with the Lakers. Those stats are in the easiest offensive era! 98.9 minutes of total clutch time Clutch time defined by NBA as final 5 min and score within 5
QAM

2012 was already many more years before the ESPN list. No one from 2012 has moved into the top 37 since then and was in their top 8 seasons. Not rocket science
>Having a star players doesn’t automatically make a team or league good … depth is a big factor in how good the league is
And how 2012-2016 more depth than 1991-1993?? Oh, you won't prove that either.
English

@SportsStatsFan I don’t understand this point at all
1) it’s easier to make an all-time list in the 90s vs the 2010s because your being compared to way less people
2) Having a star players doesn’t automatically make a team or league good … depth is a big factor in how good the league is
English

Also, you clearly don't know crap about this topic. The 1.5 Ortg increase in 2001-02 season is one of the biggest increases from 1974 (when data first was kept) to 2004. The only seasons with bigger increases were after a lockout shorten season or after a major rule change that made offense easier. Those seasons:
1979: first major limitations on handchecking
1980: 3pt line added
1984: anomaly as 1983 had a huge drop in ortg for some reason)
1995: 3pt line shorten
2000: followed 1999 lock out that saw a big decline. 2000 was below 1998, last full season
Clearly 1.5 ortg is a big increase and even bigger considering ortg was in decline for over a decade
English

>The efg% in 00-01 was 47.3% in 99-00 it was 47.8% OTRG 104.1 & 103
This is how I can tell you're young and uneducated. 1999 (98-99) was a lock out shorten season and offense dropped a lot as a result. 2000 was the a full season thus it bounced back up but 2001 continued back to the trend of constant decline in ortg and ts% over the previous decade only going up when there was a big change to make offense easier OR following a lockout shorten season
>Number barely change
Ortg was declining on average by 0.63 from 1990 to 2001 (season before illegal D switched out). In 2002, ortg went up 1.5 which is a huge 2.1 ortg increase from the pattern!!
English


