Hodhodata@statistics@Statisticizer
🌍🚨📊 Early Warning Signals for Summer 2026: Potential ITCZ-Driven Flood Risk due to northward shift of the ITCZ.
This is One of my earliest long-range forecasts pointing toward summer 2026 signals . It is Interim but requires follow up and attention.
During the summer of 2023, the ITCZ shifted unusually far north, leading to widespread flooding across large parts of the Sahara and Sub-Saharan Africa. Exceptional rainfall events were recorded in several countries, including Sudan, Chad and Yemen, where multiple dams and flood-control structures failed, and in Chad, where floods left over 100,000 people displaced—a humanitarian crisis that received limited global attention. Notably also during that episode many desert Oases and Lakes that dried like 30-40 years ago were resurrected with water, followed by enhanced Locus invasions in African countries due to improvised soil moisture & green cover in arid and semi-arid regions .
Many International weather forecasters flagged that event in 2023 as rare and odd but in reality it isn't rare or even odd but rather a recurrent pattern that emerges from time to then and goes unnoticed due to relying on modern archives that lack this pattern or imprint . My work as a statistician focuses on simulating the occurrence and recurrence of these events.
🟢 New composite analyses for current year 2026 suggests a high potential recurrence of this pattern in forthcoming summer .
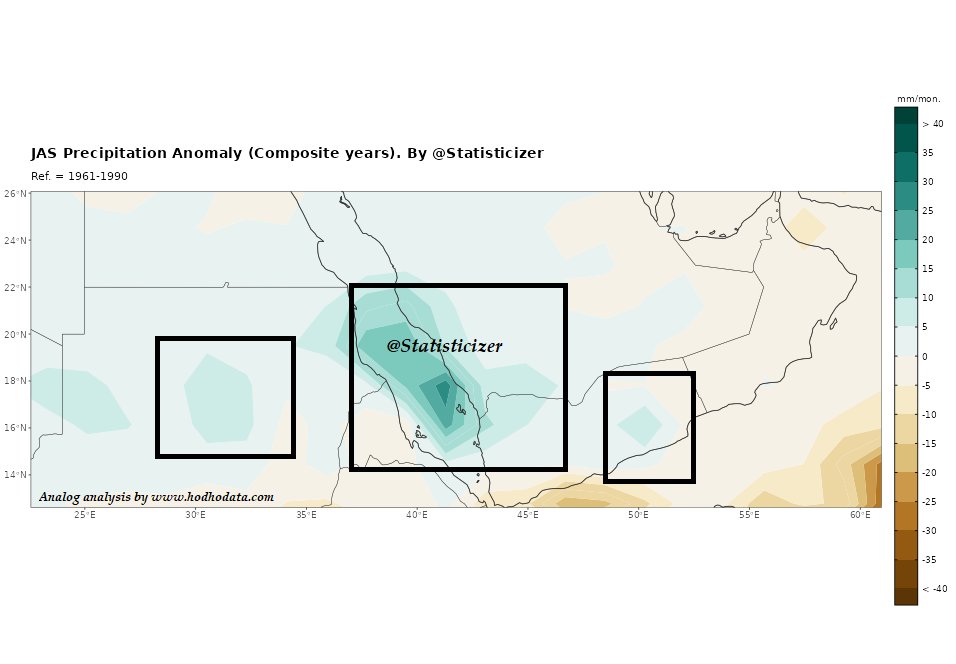
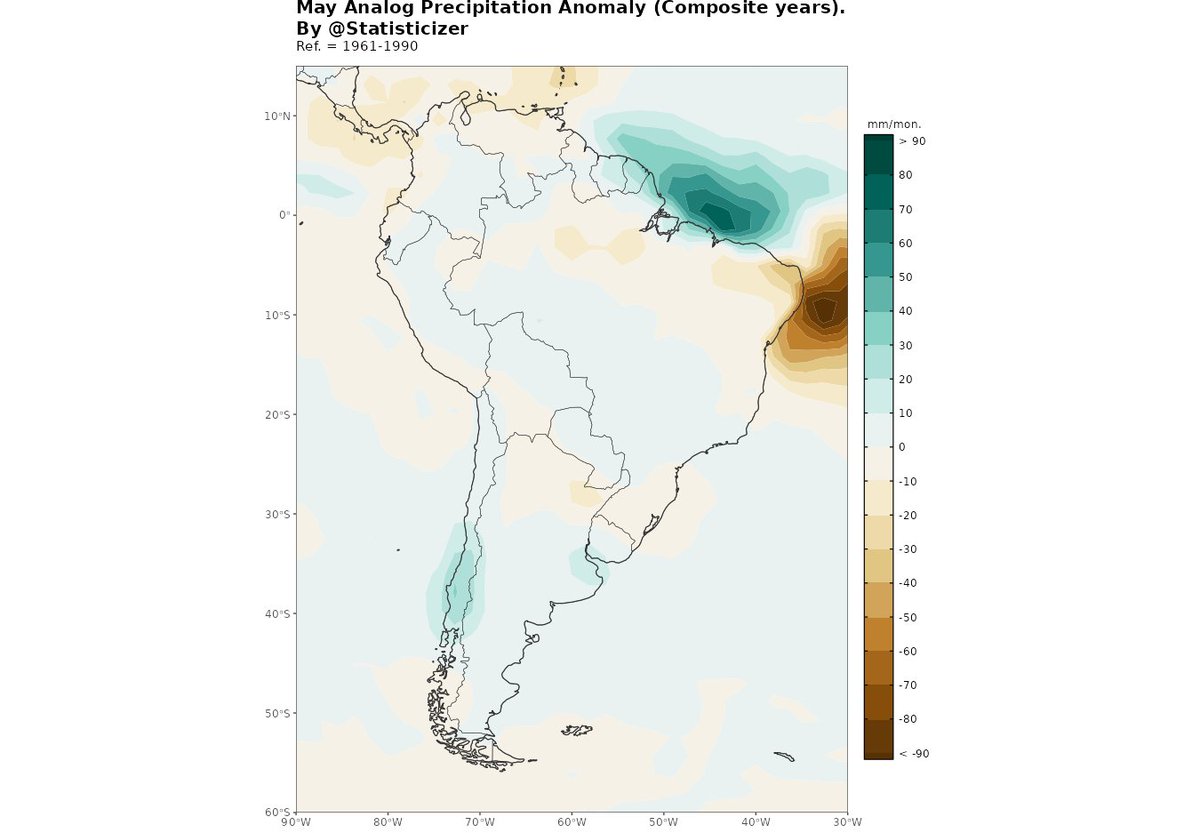
The attached JAS (July–September) precipitation anomaly maps indicate a renewed northward extension of the ITCZ and enhanced monsoonal moisture transport during June–October 2026, with the peak risk between July and September.
The green shaded anomalies highlight regions where above-normal rainfall and elevated flood risk may materialize, potentially leading to severe hydrological impacts, particularly if combined with weak infrastructure, saturated soils, or rapid runoff conditions.
📌 Regions and countries showing notable positive precipitation anomalies include:
#Sudan
#SouthSudan
#Chad
#Niger
#Nigeria
#Mali
#Mauritania, #Libya and S #Algeria and Morocco.
#Ethiopia
#Eritrea
#Yemen
#SaudiArabia (southwest)
#Sahel
#HornOfAfrica
#WestAfrica
These signals point to a heightened probability of intense rainfall episodes, flash floods, and riverine flooding during summer and early autumn 2026.
➡️ I will be monitoring and refining these risks through updated forecasts during spring 2026, focusing on regional impacts, flood likelihood, and early-warning signals as seasonal drivers become clearer.
— @Statisticizer 🌍📊
@Recretos @severeweatherEU