Tim Fortier

1.7K posts

Tim Fortier banner
Tim Fortier

Tim Fortier

@TF_Drawbridge

I help serious investors stop guessing and start reading the market — so they know exactly when to buy, when to add, and when to get out.

Kansas City, MO Katılım Aralık 2010
1.1K Takip Edilen887 Takipçiler
Sabitlenmiş Tweet
Tim Fortier
Tim Fortier@TF_Drawbridge·
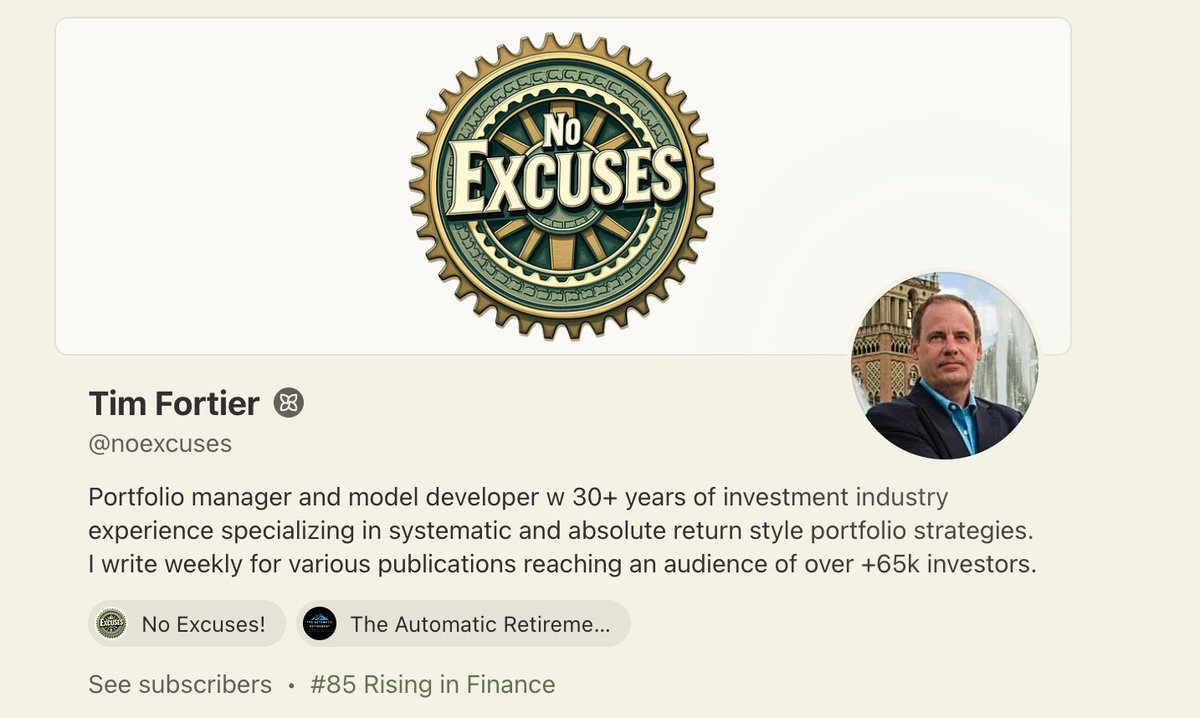
No Excuses just hit #85 Rising in Finance on Substack. Built on one premise, most investors don't want to hear: You don't have a return problem. You have a risk control problem. Nobody wants that message when markets are running. Everybody wants it after the drawdown. Thank you for being here.
Tim Fortier tweet media
English
1
0
6
457
Tim Fortier
Tim Fortier@TF_Drawbridge·
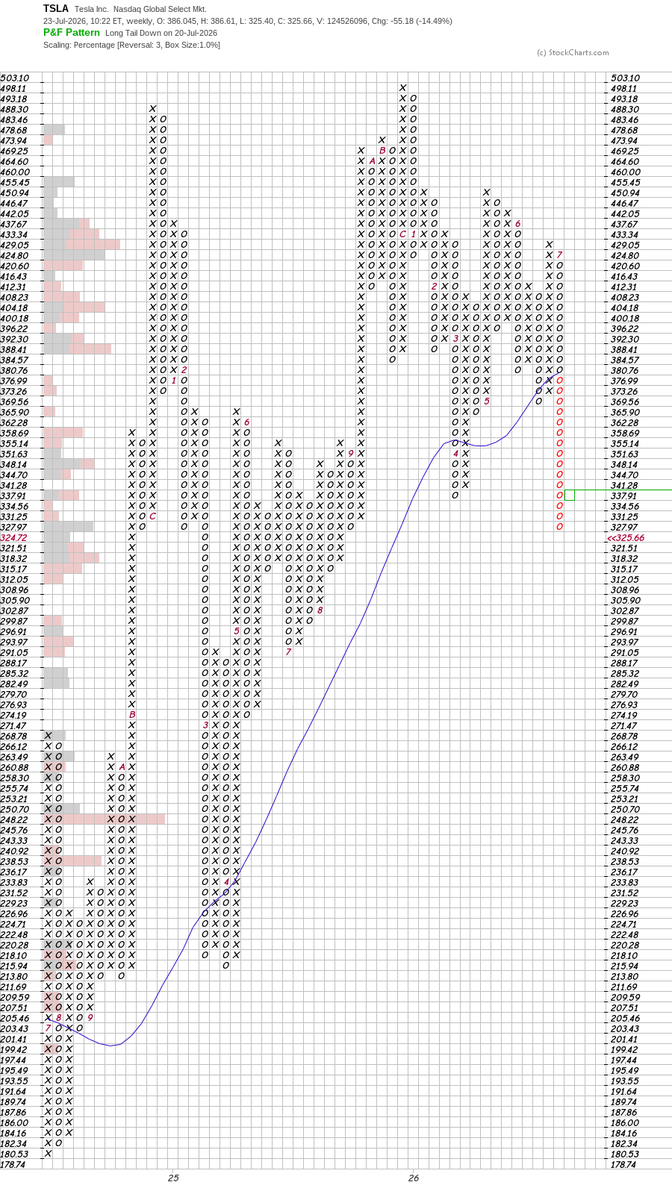
In June, I made a bearish case for $TSLA that the stock is valued like a platform company with massive future optionality, while the near-term reality looks like a pressured auto manufacturer with shrinking margins and slowing demand. Core arguments: Extreme valuation multiples: P/E above 363x, EV/EBITDA above 120x, and P/S above 14x. Core business deterioration: revenue pressure, price cuts, inventory build, and margin compression. Demand headwinds: tax-credit roll-offs, competition in China and Europe, and weaker deliveries. Autonomy risk: robotaxi and robot automation are not yet at a scale that clearly supports the stock price. Political/regulatory risk: Musk-related controversy and regulatory scrutiny can directly impact sentiment and adoption. What many investors may not realize is how thin support looks from here. The chart shows no meaningful shelf until the 296 to 299 region, roughly 9% below Friday's close. Below that, the last real floor sits in the 274 to 285 zone, the base this entire advance was built on.
Tim Fortier tweet media
English
0
0
0
151
Tim Fortier retweetledi
Sam Parikh
Sam Parikh@smartertrader·
asml 1900 to cheap if goog cap ex up 8 to 100 poss
English
10
3
34
13.7K
Tim Fortier
Tim Fortier@TF_Drawbridge·
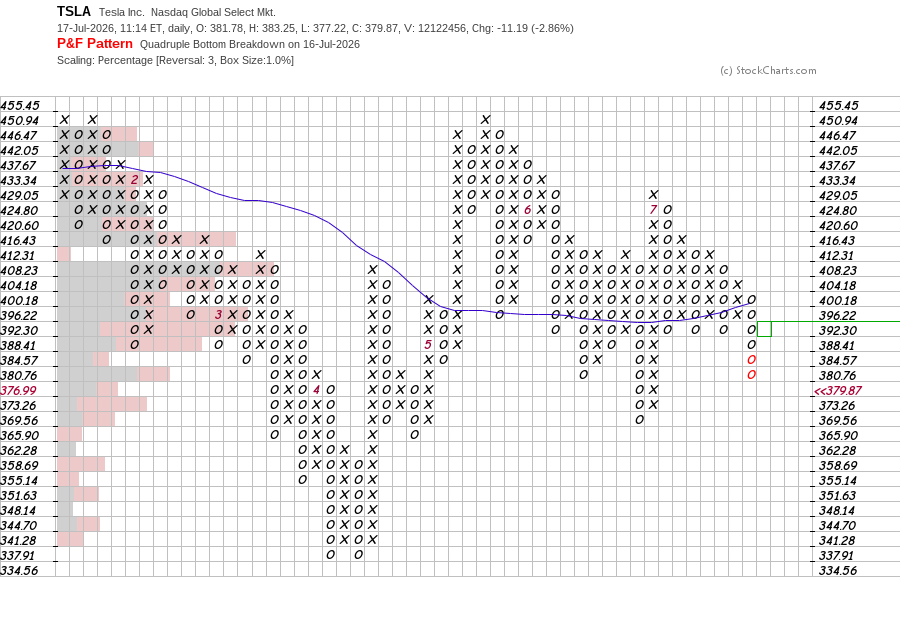
Point and figure charts strip out time and noise. Every column is a decision, not a candle. $TSLA just printed a quadruple-bottom breakdown, four failed defenses of the same shelf, each one weaker than the last. No story needed. The chart is the story. Supply has been in control since mid-July. Reclaim of 396 kills the read. Until then, don't fight the columns.
Tim Fortier tweet media
English
0
0
0
102
Tim Fortier
Tim Fortier@TF_Drawbridge·
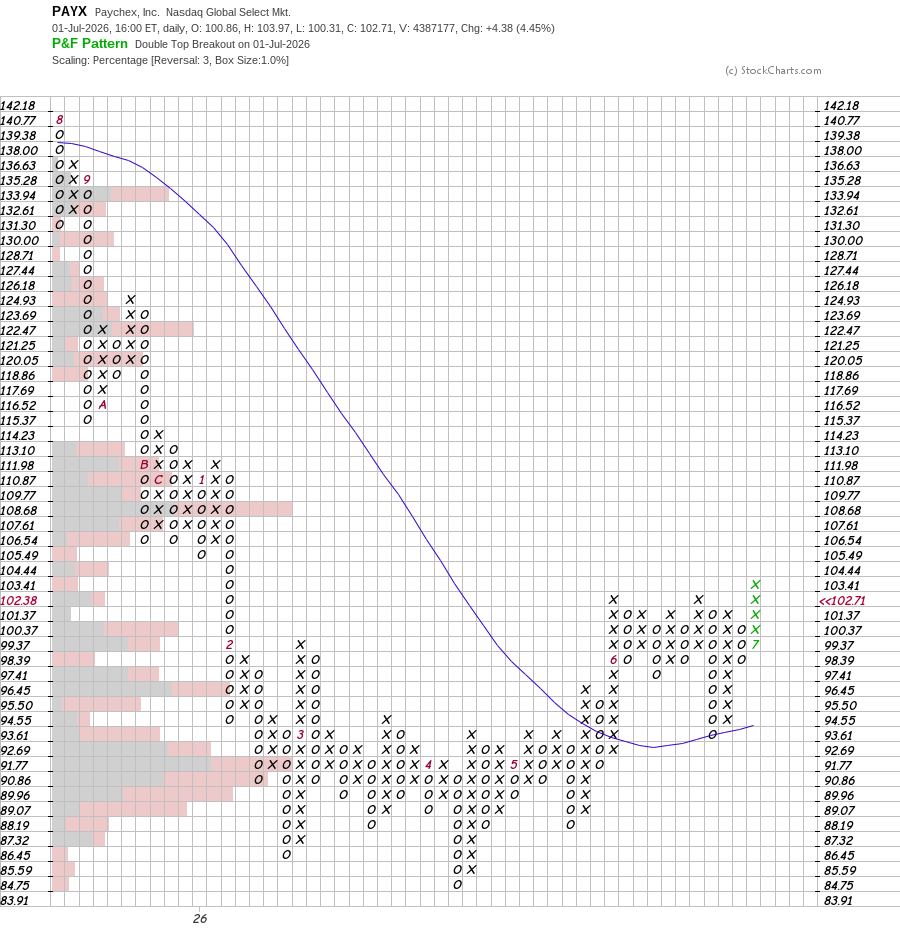
Second confirmation on $PAYX. The Smart Money screen flagged accumulation back in June. Now the Point & Figure chart is saying the same thing a different way: Ascending Triple Top Breakout on July 15, confirmed by the fresh X column pushing through $111 to a new high at $114.29. Two independent methods, one conclusion. Weinstein Stage Analysis said Stage 1 to 2. P&F structure says demand has absorbed every prior top and broken clean above it. When trend-following and point-and-figure agree, that's not confirmation bias, it's convergence. Tranches at $94, $96, $101 look better every session this holds. I have found 2 more names with the same setup.
Tim Fortier tweet media
English
0
0
0
113
Tim Fortier
Tim Fortier@TF_Drawbridge·
$MU reversal and sell signal.
Tim Fortier tweet media
English
0
0
1
113
Tim Fortier
Tim Fortier@TF_Drawbridge·
I have been obsessed with how to create smooth return streams my entire career. Built a free tool that blends monthly returns from three systematic models and lets you build your own "60/40," or any split you want. Equal-weighted since 2010: 12.33% annualized, max drawdown under 10%. Correlation between the momentum sleeve and the income sleeve: 0.18. Full correlation matrix, drawdown chart, and raw CSV export, all public, all free. Signals behind the models are for paid subscribers. The tool to test the blend is not. Link in comments.
Tim Fortier tweet media
English
1
0
0
103
Tim Fortier
Tim Fortier@TF_Drawbridge·
I am adding to my position in this energy name. A sponsor bought $42M of stock in March. At market. Not a discount. The board just authorized its first buyback ever. Chart and fundamentals almost never agree this cleanly. Full breakdown for members 🔒
Tim Fortier tweet media
English
0
0
2
153
Tim Fortier
Tim Fortier@TF_Drawbridge·
One of the nicest basing patterns I have seen in a while I gave it to subscribers @ $94
Tim Fortier tweet mediaTim Fortier tweet media
English
0
0
1
85
Tim Fortier
Tim Fortier@TF_Drawbridge·
Same chart. Different decade. You know how the first one ends. $SOXX
Tim Fortier tweet media
English
0
0
3
122
Tim Fortier
Tim Fortier@TF_Drawbridge·
Who says fixed income is boring? It's the least-managed sleeve in most portfolios, and often the source of the most overlooked return. Tactical Income Model: 12.76% 1yr vs 3.79% for the Agg. Sharpe 1.35. Max DD -6.18%. Duration, credit, and currency are levers. Most portfolios only pull one.
Tim Fortier tweet media
English
0
0
0
69
Tim Fortier
Tim Fortier@TF_Drawbridge·
For many people, the 401k is the single largest retirement asset they'll ever have. It also gets the least attention. I built something to change that. Link in the comments.
Tim Fortier tweet media
English
1
0
1
108
Tim Fortier retweetledi
The Macro Pulse
The Macro Pulse@TheMacroPulse·
Sweden built a much bigger housing bubble than the US. Since 1996, home prices relative to incomes rose: Sweden: +156% by 2021 US: +47% today The US crashed in 2008. Sweden never really did. It only started deflating after 2022.
The Macro Pulse tweet media
English
1
6
24
6.3K
Tim Fortier
Tim Fortier@TF_Drawbridge·
24 hours ago, $QQQ was sitting near its highs. Yet, below the surface, the picture falls apart. The Bullish Percent Index, which counts how many of those 100 stocks are actually on point-and-figure buy signals, just dropped to 40. Fewer than half the names are participating. This is a sequence. Each rally this spring peaked lower than the last: 67 in May, 65 in early June, then a bounce that stalled at 55. Price made new highs into every one of those lower peaks. Breadth confirmed none of them. That gap, between what the index shows and what its components are doing, is how tops get built quietly.
Tim Fortier tweet media
English
0
0
1
127
Tim Fortier
Tim Fortier@TF_Drawbridge·
234 — total holding periods (rows). This is the number of monthly rebalance evaluations from Dec 29, 2006, through Jun 18, 2026. Most rows are "hold" decisions where the position is carried unchanged. 91 — actual position changes. The number of times the held ticker set switched from the prior month. This is the figure most people mean by "number of trades" in a tactical model: roughly 4.6 switches per year, which is low-turnover by design.
English
0
0
1
17
Vicky
Vicky@Vicky5lands·
@TF_Drawbridge I'd be curious to know the number of trades.
English
1
0
0
19
Tim Fortier
Tim Fortier@TF_Drawbridge·
Nobody brags about their bond allocation. That is exactly why it's the easiest money left on the table. You picked AGG, you forgot about it, and you called that "being responsible." Bonds aren't bonds. Duration and credit quality are two separate cycles, and your default fund sits through both with its eyes closed. Manage them, and the boring sleeve does real work: 14.79% over the last year vs. 5.31% for the Agg. Same asset class. Different decision.
Tim Fortier tweet media
English
1
0
3
147
Tim Fortier
Tim Fortier@TF_Drawbridge·
Most portfolios are one layer pretending to be a plan. A real one runs three, and each does a job the others cannot. Here is how I built it. Core: consistency. Holds most of your capital and keeps drawdowns shallow. Edge: asymmetric upside. Low-risk entry, confirmed by institutional accumulation. Hedge: defense. Built to profit when the market falls. One layer is a position. Three is a portfolio.
Tim Fortier tweet media
English
0
1
2
120
Tim Fortier
Tim Fortier@TF_Drawbridge·
Most investors think they have a return problem. They have a risk control problem. The fix is not complicated. A single moving average, checked monthly, cut a portfolio's worst drawdown by two-thirds over 20 years. No forecasting, no screen-watching. How it works, see below.
Tim Fortier tweet media
English
1
1
2
119