High-Beta Baker retweetledi

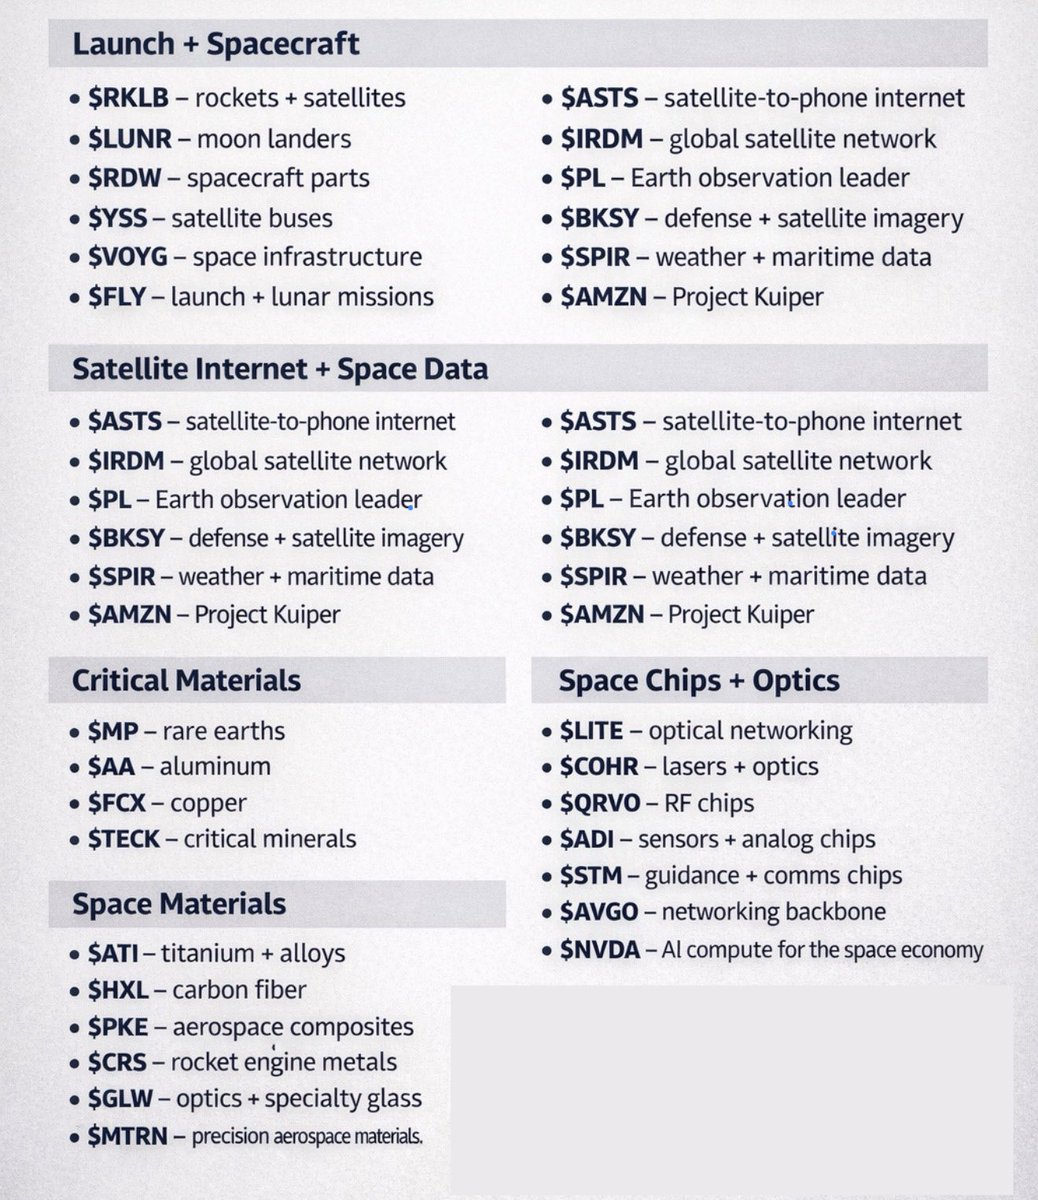
WHEN SPACEX IPOs, THESE ARE THE STOCKS THE MARKET WILL CHASE NEXT:
Launch + Spacecraft
• $RKLB - rockets + satellites
• $LUNR - moon landers
• $RDW - spacecraft parts
• $YSS - satellite buses
• $VOYG - space infrastructure
• $FLY - launch + lunar missions
Satellite Internet + Space Data
• $ASTS - satellite-to-phone internet
• $IRDM - global satellite network
• $PL - Earth observation leader
• $BKSY - defense + satellite imagery
• $SPIR - weather + maritime data
• $AMZN - Project Kuiper
Critical Materials
• $MP - rare earths
• $AA - aluminum
• $FCX - copper
• $TECK - critical minerals
Space Materials
• $ATI - titanium + alloys
• $HXL - carbon fiber
• $PKE - aerospace composites
• $CRS - rocket engine metals
• $GLW - optics + specialty glass
• $MTRN - precision aerospace materials
Space Chips + Optics
• $LITE - optical networking
• $COHR - lasers
• $AAOI - optical transceivers
• $QRVO - RF chips
• $ADI - analog chips
• $STM - guidance chips
• $AVGO - networking chips
• $NVDA - AI compute economy
English