
AB
330 posts

AB retweetledi


AB retweetledi

🚨 WHY IS BITCOIN DOWN -30% FROM ITS PEAK WHILE GOLD AND SILVER ARE GOING PARABOLIC?
Because Gold and Silver tops first, then Bitcoin starts its rally.
Here is what happened last time 👇
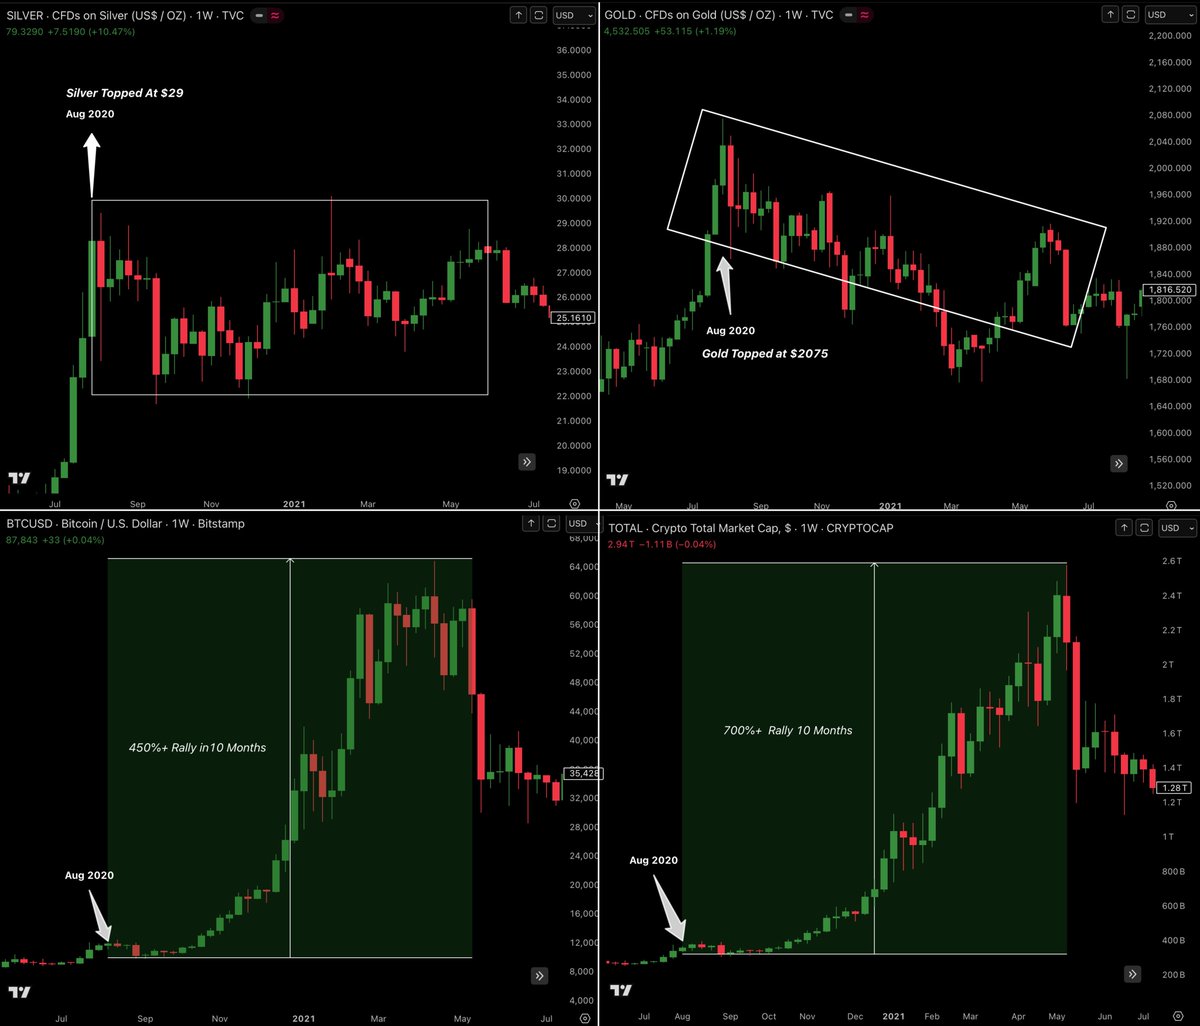
After the March 2020 crash, the Fed injected massive liquidity into the system. The first assets to react were gold and silver.
- Gold rallied from around $1,450 to $2,075 by August 2020.
- Silver rallied from around $12 to $29 in the same period.
During this entire move, Bitcoin did almost nothing. BTC stayed stuck around $9,000-$12,000 for 5 months.
This was also after a major liquidation event which happened in March 2020 due to COVID.
Gold and silver peaked in August 2020 and money started rotating into risk assets.
This is when Bitcoin started moving.
From August 2020 to May 2021:
- Bitcoin went from $12,000 to $64,800 (nearly 5.5x).
- Total crypto market cap went up almost 8x by mid-2021.
Now look at today.
- Gold is again near record highs, around $4,550.
- Silver has surged to around $80.
Both are clearly moving first.
Bitcoin meanwhile is mostly moving sideways. Just like it was in mid-2020.
We also had another large liquidation event recently on October 10th, similar to March 2020. And once again, Bitcoin has spent months moving slowly after that.
The difference this time is important.
In 2020, liquidity from the Fed was the main catalyst.
In 2026, there are multiple catalysts lining up at the same time:
- The Fed has already started injecting liquidity again.
- Rate cuts are expected to continue.
- Banks may get SLR exemptions, allowing more leverage.
- Crypto regulation clarity is improving.
- The Trump administration is planning for dividend cheques.
- More spot crypto ETFs, especially altcoin ETFs, are expected.
- Large asset managers now have easy crypto access.
- A new Pro Crypto Fed Chair is coming, and markets will front-run policy changes.
Last cycle, Bitcoin rallied mainly because of liquidity. This time, liquidity plus structure is coming together.
The setup looks very similar, but with more fuel. Gold and silver moving first is not bearish for crypto.
Historically, it has been the early signal.
If this pattern repeats, Bitcoin and crypto markets do not lead first. They move after the metals pause.
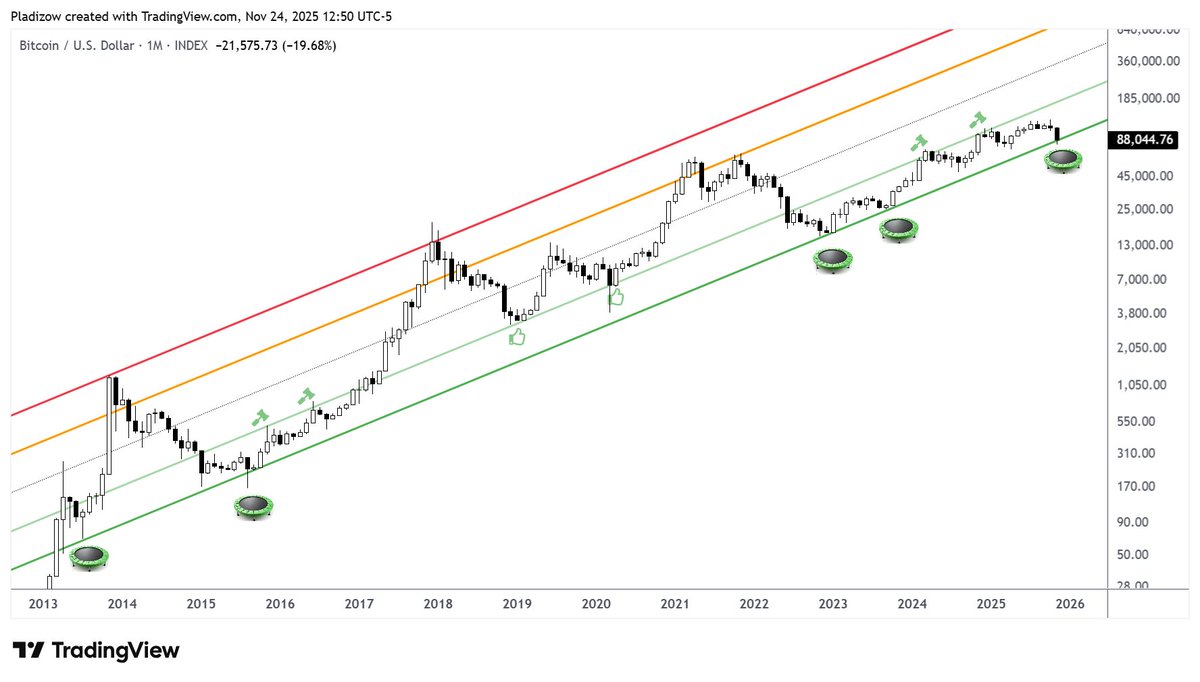
That is why the current sideways action in BTC is not the start of the bear market, but rather a calm before the storm.
English
AB retweetledi

The 4 year cycle is a lie.
What drives financial markets goes so much deeper than just a certain time window.
And here, today, I've provided cold hard data that proves this view is false and should not be blindly upheld.
I welcome anyone to debate me on this topic, but you must come with data and not "but bro it topped at the same time as last time and then dropped 75%"... that is the literal point I am arguing against.
Bitcoin does not have a code written into it that says it has to follow a strict 4 year price process.
It has the halving, but at this stage in the networks life this has become far less impactful.
Here are the main reasons the 4 year cycle is dogmatic and cannot be used as gospel.
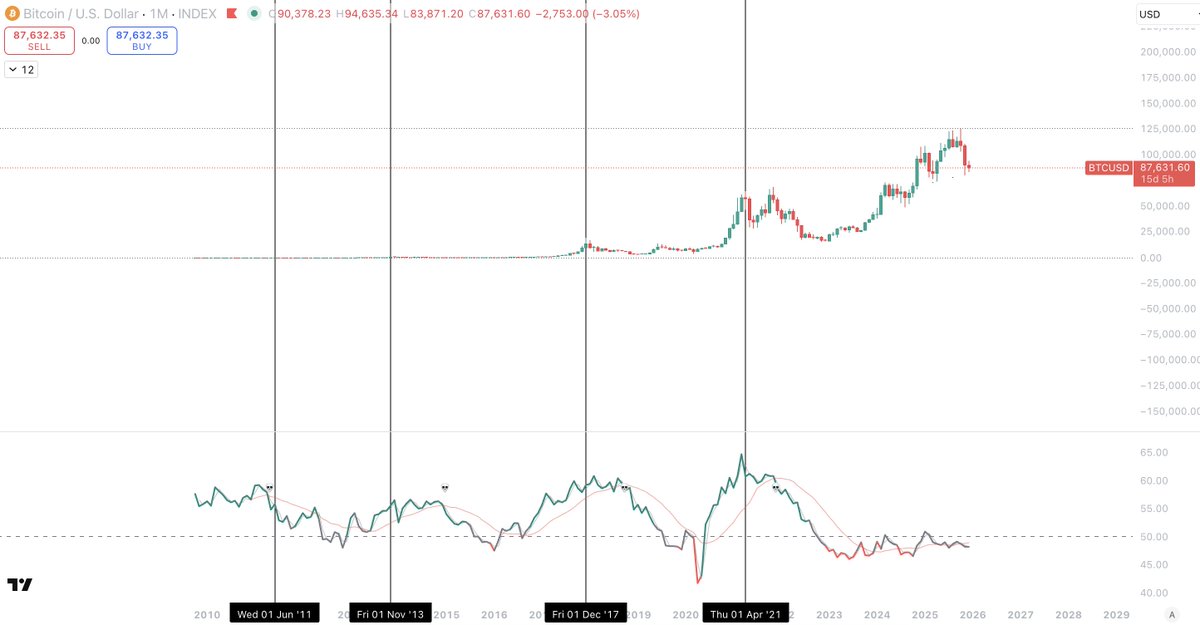
1. There has actually only been two 4 year cycles. 2011 and 2013 were two cycles with two tops. And this was driven by liquidity, we can see it clearly when we observe the central bank balance sheet.
2. The business cycle is the main driver behind Bitcoins momentum and it is no coincidence that this is the longest contraction in the business cycle, and the weakest bitcoin cycle so far ever. You can see it easily when you cross reference with PMI.
3. We are currently in a much more similar position to 2019 than end of bull market, and again, this is due to liquidity. Check ETH/BTC, BTC.D, TOTAL3/BTC etc. All of these charts paint the picture of the overall market position which is utterly uncomparable to and end of cycle position. You cannot just observe BTC and use a 4 year number.
4. This "cycle" we had a new ATH before the halving and for the first time ever, the final year of the 4 year cycle, this year, is currently a red year. The final year has always been the parabolic year.
5. There was no true expansion this cycle. Bitcoin never entered overbought on the 1M and the 2W Bollinger bands never extended, for the first time ever. This shows us beyond doubt there was no true end of cycle movement.
6. Zero topping signals fired. This can be ignored by itself, but when combined with all other points it is notable.
7. Every other cycle has topped out when liquidity has topped out before contraction. Right now, we have just entered a new liquidity cycle.
8. This is the first time Bitcoin has achieved such price appreciation in a liquidity contracting environment, and this is due to AI and ETFs. It's also the reason we have not entered the parabolic phase as there has not been the liquidity to support it, like every other run.
Im probably forgetting some, but there is insane amounts of evidence that the 4 year cycle as people know it is a view that should be held onto.
There are far more greater things at play that have been driving the Bitcoin cycles, and choosing not to observe them and go deeper into analysis is folly.
There are of course cycles, but they are financial cycles, and the data makes it very clear what is actually driving it.

English
AB retweetledi

THE SPACE ECONOMY
- Launch and Propulsion: $RKLB $FLY $GE SpaceX
- Satellites: $PL $ASTS $BA $MNTS
- Components: $CMI $HON
- Data Analytics: $BKSY $PLTR $SPIR
- Materials: $USAR $ATI
- Comms: $VSAT $IRDM $SATS
- Networks: $VZ $T $TMUS
- Defense: $NOC $LMT $LHX
- Sensors & Power: $MOG.A $STI $BWXT $TDY
h/t @TannersTrades

English
AB retweetledi

Bitcoin Electricity Price is 70k
Bitcoin Production Price is 86k
Usually those mark the bottom
capriole.com/charts/?chart=…
Make sure to bookmark and never check again.

English
AB retweetledi

Natural remedies they don't want you to know about.
English
AB retweetledi

A few months ago, I made a market update on DXY and USDT.D, where I was expecting a rally before a crash one that would trigger bears PTSD for the last time before the trend continued to the downside, fueling money to flow into the markets.
I’m not going to say I was right or that I predicted the crash, since I initially expected a rally to happen first, followed by the crash. It seems we didn’t get that rally for risk assets only the crash. So, I was partially right.
Now, with that said, looking at the DXY chart I shared, you can see I pointed out a few dates where risk-on (altcoin season) sparked from, as well as potential upcoming date for similar moment. I also marked a possible bottom range where DXY could find support. Since we didn’t get that rally, it’s likely that DXY will bottom higher and not fall below 95.
Here’s the thing my 1,778-day cycle points to the current moment (give or take 1–2 weeks as a margin). Everything suggests a bottom forming here and a potential start for risk assets to perform, with the DXY plan playing out while remaining under the 100.8 level.
On the macro side, USDT.D remains bearish, and BTC.D has printed its first lower high, which is currently being retested after the 10/10 crash. So yes, everything points to a local bottom for risk assets in this range likely to form by mid-November. From there, enjoy what’s coming.

Rawl@EtherRawl
Two key charts to watch right now are USDT.D and DXY. 🔹USDT.D is currently sitting right at 4.45%, a critical level as the market appears to be printing a local bottom. 🔹DXY recently rejected and confirmed a breakdown below 100 for the first time, which opens the path to 95 initially, and eventually a drop toward 89–90. Historically, a move to that zone has marked a major bottom and cycle tops just as it did in the past. That said, we're still far from those levels, meaning market conditions remain favorable for buying, especially in risk assets. One important thing to keep in mind: there’s a high probability that both DXY and USDT.D will bottom out around the same time around 95 for DXY and 3.80% for USDT.D. If that happens, we could see a sharp bounce from those zones, potentially triggering one last wave of bear PTSD before the real market run begins (altcoin-season).
English
AB retweetledi

The market seems to be moving nicely after @realDonaldTrump said, "Our Fed Rate is AT LEAST 3 Points too high."
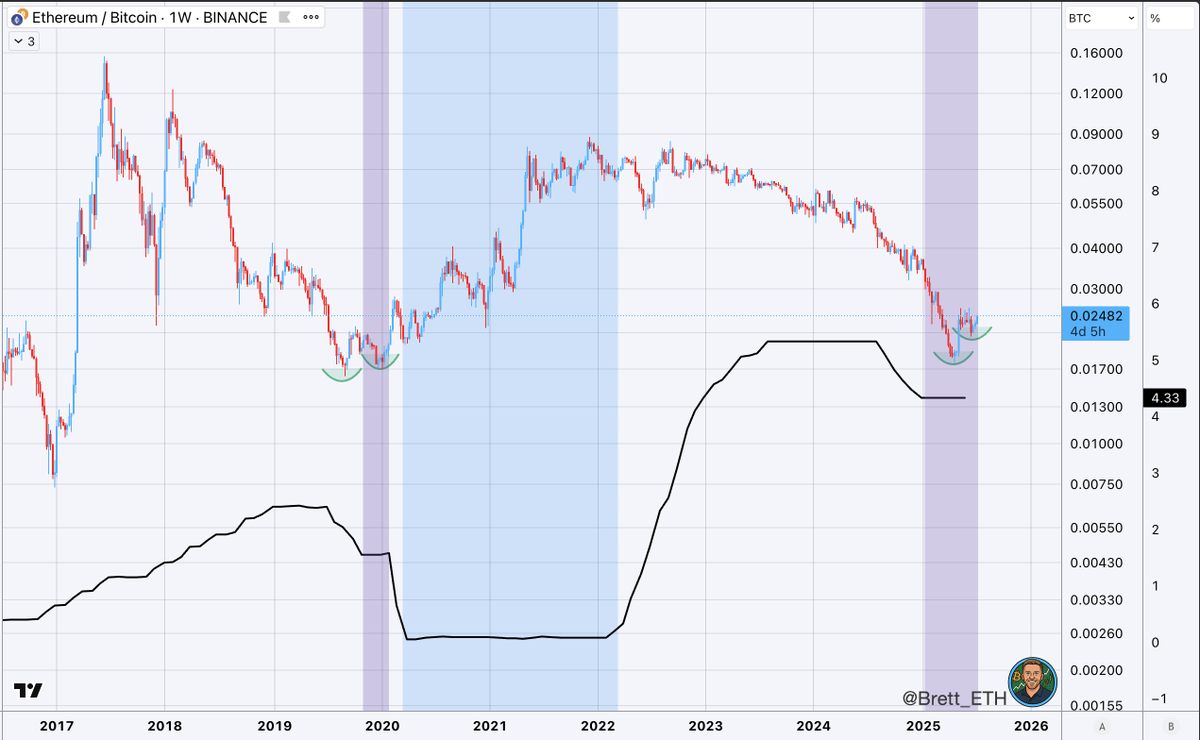
🟪 = Fed Rate Pause
🟦 = QE
In 2020, when the Fed continued rate cuts after a short pause, ETHBTC made its higher low.
Will Trump force his hand upon Powell and the Fed to drop rates quickly? (This doesn't mean we will get or need QE).
Over $7 trillion is sitting in money markets earning a decent yield. As rates fall, yields on money market funds drop, reducing the incentive to keep cash parked.
Investors start seeking higher returns elsewhere, including equities (growth/tech stocks) & Crypto.
Lets ride!
English
I found where they are holding the altcoin conference

English

For the last few weeks we talked about this move for #BTC.
Basically a bounce off the BMSB for a few weeks, then revisit in late September/early October.

English

The Fed lowers interest rates by 25 bps to 4.25%
English
The final rotation to BTC is about to start...

English
English

@bucur1020 @MisterSpread Agreed, explained on my YT also
English

Rate cuts are NOT bearish or bullish educate yourself: Context is key
Exactly like the title says and contrary to both doomers or permabulls, when Federal Reserve is cutting rates is neither bearish or bullish, it ALL depends on the context when the cuts are done.
Since September FOMC is around the corner, I thought is a good moment to remind people that is much better to do a bit of research and understand the bigger picture, then to listen to larps and engagement farmers (both sides), so here it goes:
1. Cuts because Recession - very bad short/medium term, 3-12 months for recovery.
2. Cuts because Panic - very bad short term, OK medium/ long term, 1-3 months for recovery.
3. Cuts because Normalization - small potential drop short-term and very good medium, long term.
It's all about the context in which we will find ourselves when FED cuts this year (IF they cut this year), but in general people just take information around here as it comes, without more research.
I had the same debates in March last year with people who either didn't understand the macro regime, didn't have enough information, were ignorant or all 3, so to conclude:
1. IF Fed cuts in September, is it done because of a Recession? No - then it's bullish
2. IF Fed cuts in September, is it done because of Panic? No - then it's bullish
3. IF Fed cuts in September, is it done because of Normalization? Yes then it's bullish
Thank you @RyanDetrick for the information and research going back to 1984🤝.
Bookmark and Retweet this post so others can have a balanced view for the upcoming meetings!

English

@intocryptoverse O Captain My Captain Benjamin stands at the helm
Guiding us from barren shores to markets’
vibrant realm
Once bound in scarcity’s grip now charts and cycles I see
With macro truths offered wealth’s wisdom set me free
O Captain mentor guide your light awakened prosperity in me
English