Sabitlenmiş Tweet

S&P, Nasdaq, Bitcoin: Identical Pattern, Different Timing 📊
Part 1/2
The question: Why is Bitcoin correcting while S&P and Nasdaq make ATHs?
The answer: Time-lagged rotation, not divergence.
Let me show you the 3-chart analysis.
A thread 🧵
═════
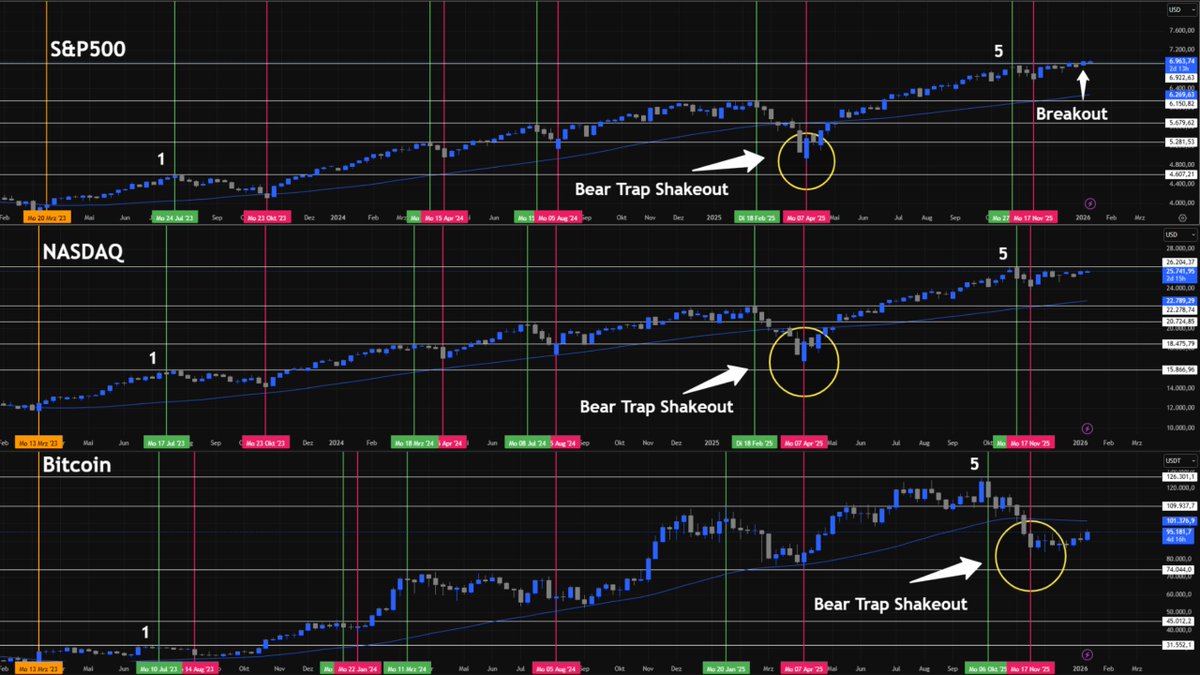
📊 The Chart
[The 3-in-1 chart shows it all]
S&P 500 (top)
Nasdaq 100 (middle)
Bitcoin (bottom)
Since early 2023:
All 3 assets
Identical pattern
But different timing.
Let me break down what you're seeing.
════
🎯 What The Chart Shows
🟢 Green lines = Wave highs
(Marks the 5 highs)
🔴 Red lines = Wave lows
(Correction depths between highs)
🟠 Orange line = Breakout
(Above 50-week SMA)
⭕ Yellow circle = Bear trap shakeout
(8+ weeks below 50W SMA)
The structure:
S&P: 5 highs → now above High 5 ✓
Nasdaq: 5 highs → testing High 5
Bitcoin: 5 highs → still below High 5
All three: SAME structure.
This is critical.
Not 3 different patterns.
Not divergence.
SAME pattern.
Just different timing.
════
📈 Current Status
S&P 500:
Broke above High 5
Currently: 6,963 (ATH)
Probably building High 6
Status: LEADING
Nasdaq 100:
Testing High 5
Currently: ~25,741
Will build High 6 WITH S&P
Status: FOLLOWING
Bitcoin:
Below High 5
Currently: ~$95,000 (Top: $126k Oct)
In correction since October
Status: LAGGING
The question: Will Bitcoin also make High 6?
My thesis: YES.
Here's why.
════
🎯 The Structural Symmetry
All 3 assets show:
✓ Started Q1 2023
✓ 5 HIGHS identically structured
✓ Same wave count
✓ Similar correction depths
✓ Comparable timeframes
This is NOT divergence.
This is SYNCHRONIZATION with time lag.
They are in the SAME cycle.
Just different timing.
Not separate cycles breaking apart.
Time-lagged moves within the SAME cycle.
This distinction is everything.
If they were diverging → Bitcoin could go to zero while S&P rallies.
But they're NOT diverging.
They're SYNCHRONIZED with lag.
That means: Bitcoin WILL follow.
Eventually.
════
📊 The Wave Count Logic
If S&P and Nasdaq go from 5 highs → 6 highs,
and Bitcoin has the SAME 5-high structure,
it's extremely likely Bitcoin will also make High 6.
Why?
Because they're in the SAME cycle.
Analogy:
Three runners in the same race.
All passed 5 checkpoints.
Two are heading to checkpoint 6.
The third (Bitcoin) is slightly behind.
But: They're running the SAME race.
The third will also reach checkpoint 6.
Not because I say so.
Because the structure demands it.
When assets share identical wave structures in the same cycle, they converge.
Not immediately.
But eventually.
════
⏰ Why Bitcoin Corrects Later
The timeline explains everything:
2023 - Q1 2024:
Bitcoin OUTPERFORMED massively
(FTX bottom → ATH)
March - October 2024:
Bitcoin sideways (consolidation)
S&P/Nasdaq steadily upward
October 2025 - Now:
Bitcoin -36% correction
S&P/Nasdaq continue to ATHs
This is ROTATION.
Not breakage.
Bitcoin had its strong phase EARLIER (2023-2024).
Now it's making the correction AFTER that S&P/Nasdaq already had.
This is normal asset rotation within the same cycle.
Not a structural break.
ROTATION.
════
⭕ The Time-Lagged Bear Trap
The yellow circles in the chart show it:
S&P/Nasdaq:
April 2025: Bear trap
(8 weeks below 50W SMA)
→ May-Jan: Recovery to ATHs
→ Now: Building High 6
Bitcoin:
Oct-Dec 2025: Bear trap
(8-10 weeks below 50W SMA)
→ Jan-Feb 2026: Recovery?
→ Then: Build High 6?
Bitcoin is doing NOW what S&P/Nasdaq did in April.
Time-lagged.
Not divergent.
Same pattern.
Different months.
This is the key insight.
The bear trap that S&P/Nasdaq experienced in April is happening to Bitcoin NOW (Oct-Dec).
7-8 months later.
But: Same pattern.
Same duration (8+ weeks under 50W SMA).
Same setup for recovery.
If the pattern holds → Bitcoin recovers soon and makes High 6.
Just like S&P/Nasdaq did after their April trap.
════
🌍 Why Bitcoin MUST Follow
Macro constraint:
If S&P (largest, most liquid market) goes to High 6,
others MUST follow.
Why?
- QE running (since Dec 12)
- Liquidity flows to ALL risk assets
- S&P = barometer for risk-on
- If S&P strong → Bitcoin can NOT stay isolated
Bitcoin can NOT fall for months while:
S&P new ATHs ✓
Nasdaq new ATHs ✓
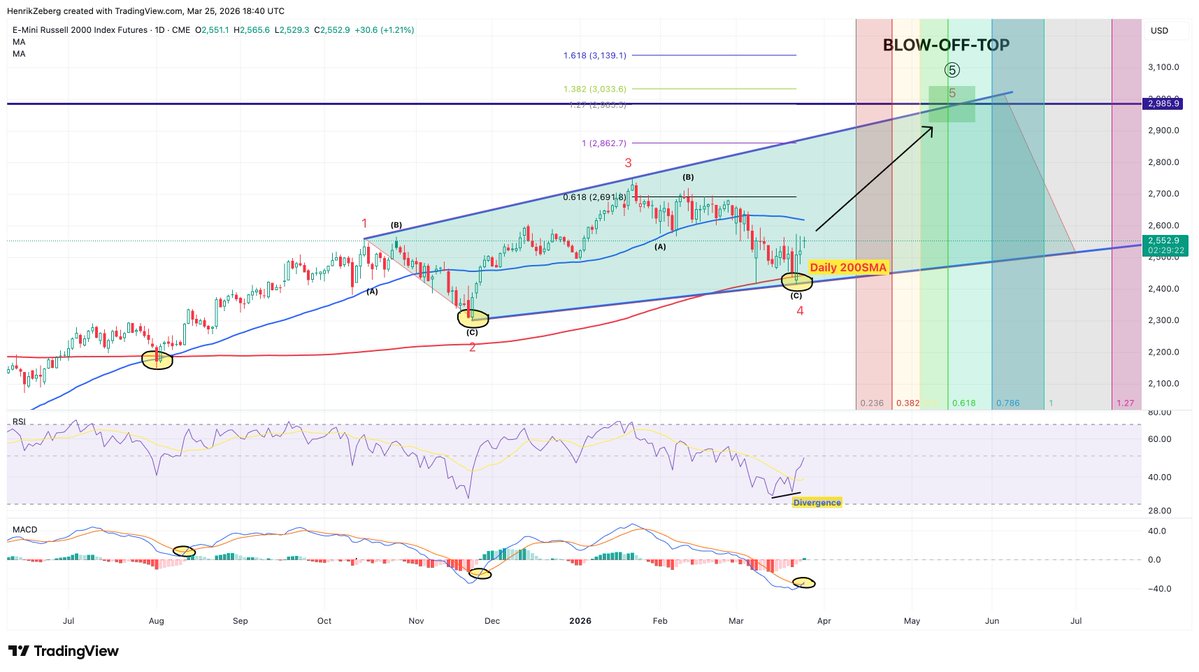
Russell 2000 new ATHs ✓
Liquidity everywhere ✓
This would be macroeconomically unrealistic.
Bitcoin doesn't exist in isolation.
It's part of the macro system.
When S&P says "I'm going higher" → other risk assets follow.
Not immediately.
But eventually.
Because liquidity flows to ALL risk assets in a risk-on environment.
Bitcoin can't resist this for long.
════
🎯 Summary Part 1
The Chart:
All 3 have identical 5 highs since Q1 2023
Same cycle, time-lagged
The Status:
S&P → above High 5 (making High 6)
Nasdaq → testing High 5 (making High 6)
Bitcoin → below High 5 (lagging)
The Thesis:
Bitcoin will ALSO make High 6
Why?
Structural symmetry forces convergence.
Macro context (QE, risk-on) enforces it.
Time-lagged bear trap explains correction.
Bitcoin is doing NOW what S&P did in April.
Tomorrow Part 2:
Historical validation
1998-2000, 2005-2007 parallels
Timeline projection
Probabilities
Follow @TheBigCycleGame for updates.
Not financial advice. DYOR.
#Bitcoin #BTC #SPX #SP500 #NASDAQ #Crypto #MacroAnalysis #ChartAnalysis #Pattern #BearTrap #EndCycle #Altcoins #Stocks #Trading
English