@lynd_ron @RabbiPoupko Yes, Israelis woke up one day and decided to attack Gazans for no resson. Hamas had nothing to do with it.
English
The Data Decoded
1.2K posts

@TheDataDecoded
High-quality, well-researched data visualizations that raise the level of public discourse. Truth matters. Open to custom viz – DM me! 📊


May 3rd, 1945 Hamburg, Germany captured.


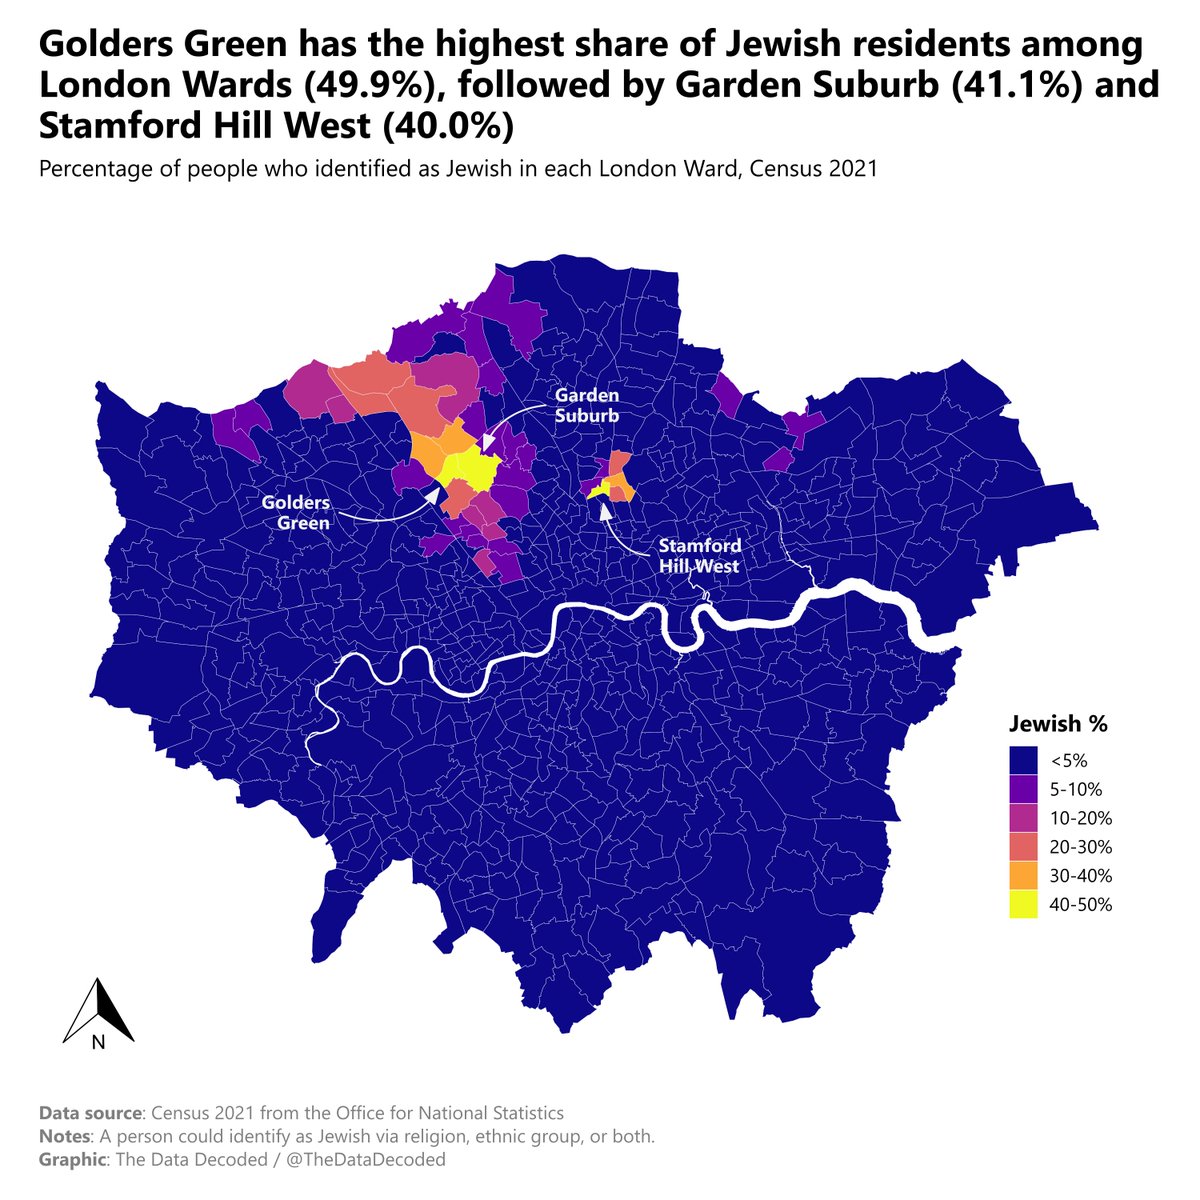
It’s stark when you see it like this, isn’t it?
Yesterday's chart (link in the comments) showed the distribution of the Jewish population across England & Wales: over half (53.6%) live in London. Today's map shows the local concentration within London: • Barnet: 20.1% of all residents identify as Jewish (by far the highest) • Hackney: 6.4% • Every other borough: <4% Data source: Census 2021 from the Office for National Statistics | Jewish residents as % of total population per borough Graphic: @TheDataDecoded
London is home to over half (53.6%) of England & Wales's Jewish population, despite making up only 14.8% of the total population. Strong secondary concentration in the East of England. Full breakdown by region in the chart below: Data source: Office for National Statistics (2021 Census) Graphic: @TheDataDecoded


Per capita, per head, Jews are nearly 9 times more likely to be the victims of hate than Muslims in Britain 🇬🇧.


@LePropheteEli @Palmierent_ @NeverGoyAgain_ Et ça ne change rien au fait qu'en islam les violences conjugales sont interdites, que des institution islamiques sunnites comme Al-Azhar ou l'Académie internationale du fiqh islamique interdisent les violences conjugales et surtout qu'en islam gifler, battre ou maltraiter une...