The Quantified Universe

139 posts

The Quantified Universe banner
The Quantified Universe

The Quantified Universe

@TheQuantUni

If you run the numbers, the chaos disappears. A daily breakdown of Earthly margins, human behavior, and universal scale.

The Universe Katılım Mayıs 2026
109 Takip Edilen13 Takipçiler
Sabitlenmiş Tweet
The Quantified Universe
The Quantified Universe@TheQuantUni·
Welcome to The Quantified Universe. 🌌📊 The universe feels chaotic, but the math is always objective. Every day, we strip away the noise and look at the raw numbers behind how everything works—from everyday margins to the edges of the cosmos. Here is what we break down: ☕ Margin Mondays (Supply Chains & Costs) 💻 Tech Tuesdays (The Digital World) 🗑️ Waste Wednesdays (Inefficiency & Loss) 🎲 Threshold Thursdays (Odds & Probabilities) 🃏 Free-for-All Fridays (Wildcard Numbers) 🚀 Space & Scale Saturdays (Mind-Bending Extremes) 👥 Society Sundays (Crowds & Demographics) All data is heavily researched. Sources & methodology available upon request. Follow along to see the matrix. Breakdowns will drop below daily 👇
English
0
0
0
381
The Quantified Universe
The Quantified Universe@TheQuantUni·
The rhetoric here is political, but the math is 100% accurate. It all comes down to a tax engine called the 'Phase-In.' The Child Tax Credit isn't a flat payout; it's a tax offset that requires earned income to unlock. Under the standard rules, you have to earn $2,500 before it activates, and then it only phases in at 15 cents on the dollar. If a single mom of two earns $12,000, her formula is: ($12k - $2.5k) * 0.15 = $1,425. She 'misses' over $2,500 of the target $4,000 credit simply because she doesn't earn enough to climb the 15% ladder. Meanwhile, a family making $150k has the tax liability to absorb the full $4,000 offset immediately. It’s not a glitch; it’s exactly how the formula was written - a tax offset that mathematically favors people who earn enough to pay taxes.
English
0
0
0
9
Americans For Tax Fairness
Americans For Tax Fairness@4TaxFairness·
45% percent of Black children will not receive the full Child Tax Credit under last year's law. 41% of Child Tax Credit benefits are set to flow to the richest fifth of families. The bottom fifth will receive virtually nothing. This is how you rig a tax code.
English
22
93
185
2.3K
The Quantified Universe
The Quantified Universe@TheQuantUni·
#TheMacroScorecard: The Math of Mexico's Universal Healthcare To understand what Sheinbaum is doing, you first have to understand the deep inefficiency of Mexico's current healthcare system. Historically, it has been severely "siloed." IMSS: For formally employed private-sector workers. ISSSTE: For government and public-sector workers. IMSS-Bienestar / Insabi: For the millions of uninsured or informal workers. If you had an IMSS card but had an emergency outside an ISSSTE hospital, you couldn't get care there. It was highly fragmented. 1. The Core Mechanic: The "Unified" Decree The decree Sheinbaum just signed effectively tears down the walls between these silos. Starting in January 2027, any Mexican citizen or eligible legal resident will be able to walk into any public hospital or clinic and receive care, regardless of their employment status. They have already started issuing a unified "Universal Health Credential" as of April 2026. 2. The Phased Rollout They aren't flipping a switch all at once; it's mathematically phased to prevent the system from collapsing on day one: Phase 1 (Jan 2027): Covers emergency care, high-risk pregnancies, and continuous hospitalizations across all facilities. Phase 2 (Late 2027): Expands to cover radiotherapy, lab tests, and imaging studies. Phase 3 (2028): Full drug and comprehensive hospital coverage. 3. The Funding Trap: The "Efficiency" Gamble This is where the math gets incredibly controversial. How do you pay to insure millions of new people? The Public Claim: The administration claims that by merging these three massive, overlapping bureaucracies into a single Universal Health Service, they will generate massive "administrative savings." They are banking on the idea that deleting duplicate management layers will free up enough cash to cover the medical costs of the uninsured. The Budget Reality: Healthcare analysts and the Mexican HealthTech Association have pointed out a glaring red flag in the ledger. While promising universal care, the proposed budget actually cuts funding to the Health Ministry. Furthermore, it cuts resources for top-tier specialty institutes (like oncology and cardiology) by up to 33% compared to 2024 levels, and cuts mental health funding by nearly 14%. The Verdict: Sheinbaum is betting the house on an economic concept called "Synergy Savings." She is assuming that unifying the system will create so much bureaucratic efficiency that she can actually lower the federal health budget while treating more people. Mathematically, this is an incredibly tight rope to walk. If the bureaucratic savings don't materialize instantly, the hospitals will be flooded with new patients while operating on slashed specialty budgets, creating a massive supply-shock bottleneck.
English
0
0
0
7
The Quantified Universe
The Quantified Universe@TheQuantUni·
#TheMacroScorecard: The Math of the Sports Betting Boom To understand the whole picture, we have to look at the three sides of the triangle: The Scale, The Addiction, and The Mechanism. 1. The Scale (The Handle vs. The Revenue) In the sports betting industry, there are two numbers that matter: The Handle: The total amount of money wagered by bettors. In 2023, the U.S. sports betting handle reached an astonishing $119.8 Billion. Gross Gaming Revenue (GGR): The amount the sportsbooks actually kept after paying out the winners. In 2023, that number was roughly $11 Billion. The League's Cut: Why are the NFL and NBA pushing this so hard? Because it is incredibly lucrative. The American Gaming Association estimated that legal sports betting creates over $570 million a year in incremental revenue for the NFL alone through TV ads, sponsorships, and—most importantly—selling official league data directly to the sportsbooks. 2. The Addiction Metric (The Frictionless Problem) The comparison to alcohol and smoking is mathematically accurate. Because sports betting is now frictionless (it happens on a supercomputer in your pocket rather than at a physical casino), the addiction metrics are spiking vertically. * According to national problem gambling helpline networks, total call volume surged by over 50% in 2023. * The demographics of the crisis are shifting violently. Historically, the primary drivers for helpline calls were slot machines and scratch-off tickets. Today, nearly 40% of all calls specifically cite sports betting as the primary reason for crisis, heavily skewing toward young males. 3. The Hidden Element: "The Parlay Trap" If you want to see the whole picture, you have to understand exactly how the sportsbooks are making that $11 Billion. They don't want you betting $50 on the Bears to simply win. They want you betting $5 on a 6-leg "Same Game Parlay." A parlay requires you to string multiple bets together (e.g., Patrick Mahomes throws 2 TDs, Travis Kelce gets 80 yards, and the Chiefs win). You have to win every single "leg" to get paid. Why do sportsbooks push parlays so hard in their commercials? Because of the Compounding House Edge. When you bet a standard individual game, the house edge (the sportsbook's built-in profit margin) is around 4.5%. But when you string bets together in a parlay, the sportsbook compounds their mathematical edge on every single leg. What feels like a fun, cheap lottery ticket to the bettor is actually a mathematical slaughterhouse.
English
0
0
0
12
The Quantified Universe
The Quantified Universe@TheQuantUni·
When people hear "mercury," they think of the highly toxic heavy metal in fish that bioaccumulates in your brain. Methylmercury (Fish): This is the dangerous one. It has a half-life in the human body of roughly 50 days, meaning it builds up over time and causes neurological damage. Ethylmercury (Thimerosal): This is what was in vaccines. It is a completely different molecule. It has a half-life in the blood of roughly 7 days. The body metabolizes it and flushes it through the digestive tract before it can accumulate. The dose was biologically insignificant.
English
0
0
1
49
Rand
Rand@rand_longevity·
@DrNeilStone are you really trying to say mercury is safe to put in our body? this shit is crazy
English
10
0
63
1.6K
The Quantified Universe
The Quantified Universe@TheQuantUni·
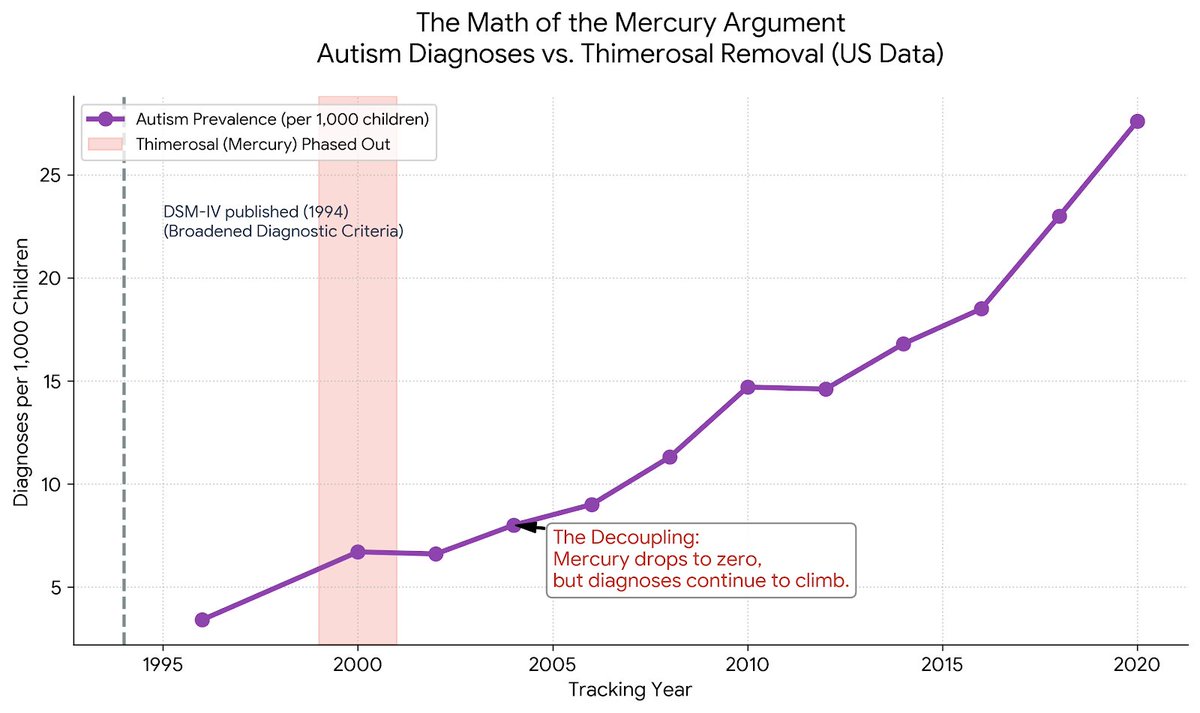
Dr. Stone is highlighting a classic statistical 'Proof by Contradiction.' For years, the claim was that Thimerosal (ethylmercury) was driving the autism spike. As a precaution, it was removed from childhood vaccines between 1999 and 2001. If the mercury hypothesis was mathematically true, diagnoses would have fallen off a cliff by 2004. Instead, the exact opposite happened: Mercury went to zero, and the diagnosis rate more than doubled over the next decade. The variables completely decoupled. The rise wasn't driven by heavy metals; it was driven by the broadened diagnostic criteria of the DSM-IV and better school screening.
The Quantified Universe tweet media
English
0
0
0
17
The Quantified Universe
The Quantified Universe@TheQuantUni·
This is the exact collision of 'Buffet Psychology' vs. 'Metered Economics.' For 20 years, SaaS (Salesforce, Office365) trained employees that software has a marginal cost of zero. You pay the monthly seat license, and usage is unlimited. For example, if Microsoft sells a company 10,000 Office 365 licenses at $20/month, Microsoft doesn't care if an employee opens Excel once a month or 1,000 times a day. The server cost is negligible. AI broke that. Every query requires heavy GPU compute. CFOs are trying to budget AI like a flat-rate SaaS tool, while employees are treating it like an all-you-can-eat buffet. This is where the "efficiency" paradox comes in (Andreessen's point): * High-Friction Usage: Early on, when engineers have to think about using AI, they only use it for high-leverage tasks (writing 500 lines of boilerplate code). The ROI is massive. The cost is low. * Low-Friction Usage: Once the tool is deeply integrated (or gamified), employees stop thinking. They use a $0.05 query to summarize a three-sentence email that would have taken them 4 seconds to read. The ROI drops to near zero, but the token cost remains the same. As usage scales from high-leverage tasks (coding) to low-leverage tasks (summarizing short emails), the ROI crashes but the token cost compounds. That 'Budget Death Zone' is where finance teams are currently pulling the plug.
The Quantified Universe tweet media
English
0
0
0
14
Alex Prompter
Alex Prompter@alex_prompter·
Marc Andreessen admitted on Joe Rogan that AI is making people less efficient. The guy who funds half the AI industry. On a podcast. Just casually dropping it. Same week: Nvidia's VP said compute now costs more than his employees. Microsoft canceled 100,000 Claude Code licenses because finance couldn't stomach the bill. Uber burned $3.4 billion in AI budget by April. And here's the detail everyone's glossing over: Uber didn't just adopt AI. They gamified it. Internal leaderboards ranking teams by usage. They made burning tokens a competition. A sport. It worked. Adoption went from 32% to 84%. Engineers loved it. They used it for everything. They stopped thinking about whether a task needed AI. They just used it. For everything. Always. And that's when the budget died. The tool was so good that people stopped being selective about when to use it. And the moment you stop being selective, the cost goes exponential. Because token-based pricing means every thoughtless query costs real money. This is the part nobody wants to name: AI doesn't have a cost problem. It has an addiction architecture. Flat-rate software trained an entire generation to use tools without thinking about cost. Now AI billing is per-use. But the habit of "just use it for everything" didn't update with the billing model. Uber built a leaderboard that rewarded maximum consumption of a product billed per unit consumed. Then acted surprised when the bill arrived. Microsoft's engineers unanimously wanted to keep Claude Code. Finance killed it. The people using the tool said it was the best thing that ever happened to their workflow. The people paying for the tool said they couldn't afford how much the users loved it. We built something so useful that the only way to sustain it is to stop people from using it freely. And that contradiction isn't a bug in the business model. It IS the business model. It's how every AI company makes money: build something addictive, bill by consumption, and wait.
English
28
69
264
34.3K
The Quantified Universe
The Quantified Universe@TheQuantUni·
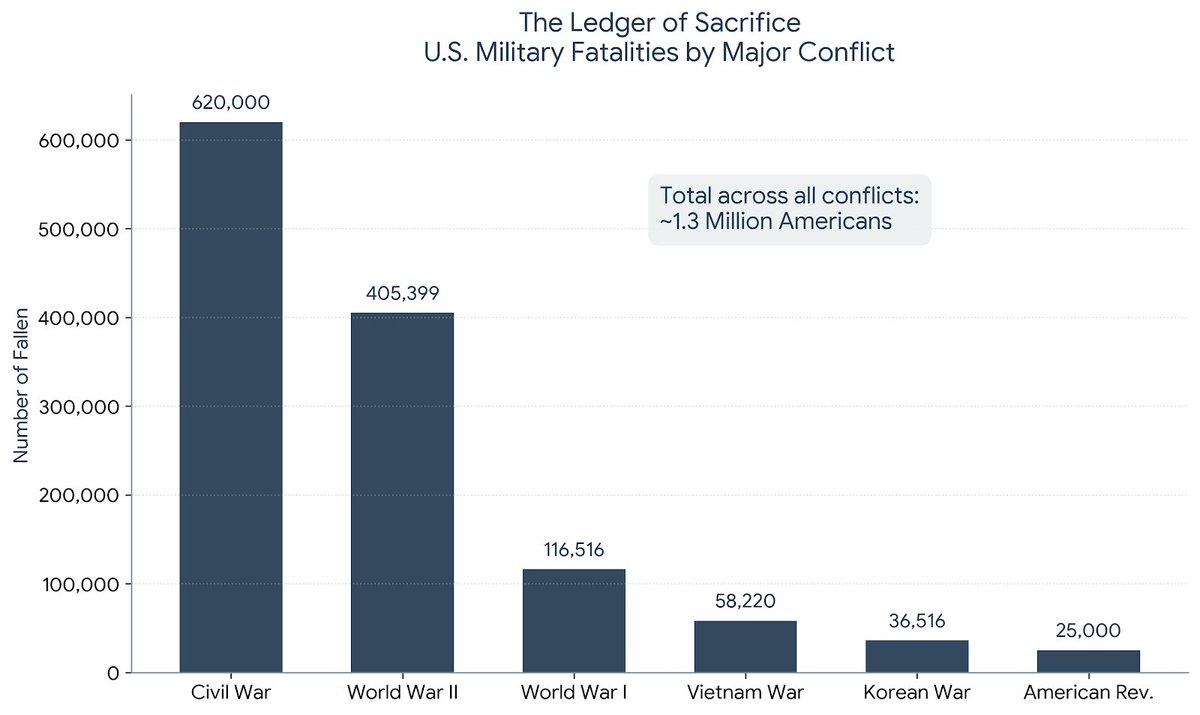
As an analyst, I look at everything through the lens of math and ledgers. Roughly 1.3 million Americans have died in military service. Today we pause to honor the brave Americans who gave their lives in service to our nation. Their sacrifice secured the freedoms we enjoy every day, and their courage will never be forgotten. Today, we also remember the Gold Star families and loved ones who carry the memory of our fallen heroes with them always. Their strength and sacrifice are part of the enduring legacy of service to our country. The scale is difficult to comprehend. The Civil War alone claimed ~620,000 lives—roughly 2% of the entire US population at the time. To put that math in modern terms, it would be the equivalent of losing 6.7 million Americans today. The precision of our respect is equally staggering. This weekend, the 3rd U.S. Infantry Regiment placed over 260,000 flags at Arlington National Cemetery in just 3 hours. The math of our freedom is incredibly steep. At 3:00 PM local time today, Congress asks that we all take exactly 60 seconds of silence to acknowledge the bill they paid for us. Have a safe and meaningful Memorial Day.
The Quantified Universe tweet media
English
0
0
1
17
The Quantified Universe
The Quantified Universe@TheQuantUni·
The math of a $150 Nike Sneaker. Who gets the money? 🏭 Manufacturing (Labor/Materials): $28 🚢 Shipping & Tariffs: $5 📺 Marketing/Endorsements: $15 🏢 Nike Overhead: $17 🏪 Retailer Markup (Foot Locker, etc.): $75 Nike's direct net profit on the shoe? Roughly $10.
English
0
0
0
2
The Quantified Universe
The Quantified Universe@TheQuantUni·
It’s not a narrative switch; it’s just analyzing two fundamentally different types of vaccines. Your chart is correct: Measles deaths plummeted pre-1960. Why? Antibiotics (penicillin), IV fluids, and modern hospitals. We got better at keeping kids alive, but the virus was still spreading wildly (~500k cases/year). The measles vaccine was 'sterilizing'—it wiped out the baseline spread. Therefore, we chart Cases. The COVID vaccine is 'non-sterilizing' (it doesn't stop transmission). Its primary mechanism is preventing severe disease. Therefore, charting cases is useless; you have to chart the Mortality Decoupling. You track the metric that the intervention was designed to change.
English
1
0
1
31
Mark Brady
Mark Brady@Bradybits·
@TheQuantUni @simonmaechling There was 100x drop in measles deaths before the vax. Interesting that you use CASES for measles but DEATHS for covid. Seems whatever outcome supports your narrative, you’re more than happy to switch to.
Mark Brady tweet media
English
1
0
4
48
Simon Maechling
Simon Maechling@simonmaechling·
By rejecting vaccines, you put others in danger. You reject decades of immunology, epidemiology, clinical trials, and real-world evidence involving billions of doses. You promote the idea that every hospital, university, regulator, and doctor on Earth is part of one giant conspiracy — while viruses, measles, polio, and whooping cough quietly come back. Vaccines are not perfect. But pretending infectious diseases disappeared on their own is historically illiterate. Modern medicine dramatically increased human life expectancy. The real danger is turning public health into a conspiracy theory.
English
908
519
1.8K
37.8K
The Quantified Universe
The Quantified Universe@TheQuantUni·
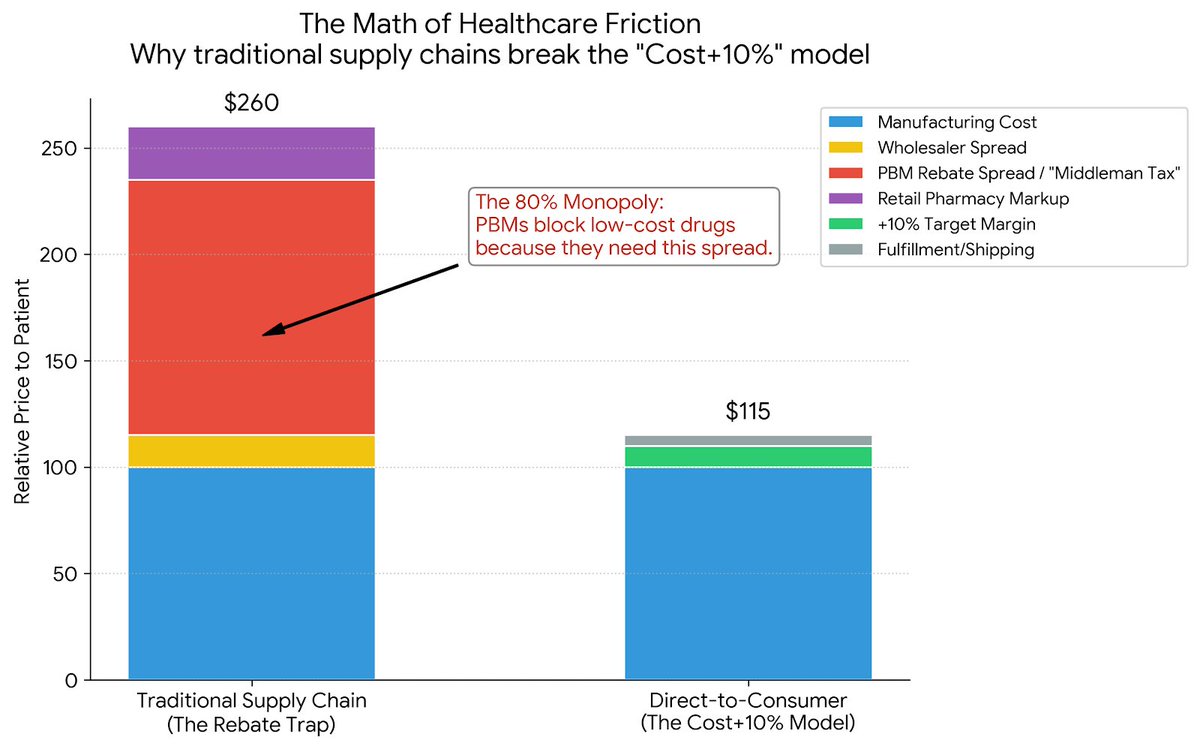
Mathematically, they cannot use the traditional supply chain due to 'The Rebate Trap.' CVS Caremark, Express Scripts, and OptumRx (the top 3 Pharmacy Benefit Managers (PBMs)) control ~80% of the market. Their algorithms optimize for rebate spread, not low net costs. If a startup prices at Cost+10%, there is no spread to extract, so PBMs will literally block it from formularies for being too cheap. The only mathematical way to reach maximum patients at that margin is a zero-friction bypass: A direct-to-consumer, cash-pay pharmacy that deletes the middleman markup entirely. The distribution is the innovation.
The Quantified Universe tweet media
English
0
0
0
23
Mark Cuban
Mark Cuban@mcuban·
Drug startup creates an amazing drug. It's groundbreaking. They want to sell that drug for just enough to cover their expenses and to make a 10 pct return. Where and how can they sell it so it reaches as many patients as possible ?
English
169
18
372
312.6K
The Quantified Universe
The Quantified Universe@TheQuantUni·
The contradiction here isn't a political opinion; it's a matter of forensic accounting. The charity marketed a '0% expense ratio,' claiming the use of Trump golf courses was 100% free, ensuring donor money went straight to St. Jude. However, their IRS Form 990s tell a different mathematical story. Starting in 2011, event costs exploded. Over 7 years, the charity paid roughly $1.2 million to the Trump Organization for facility use. It's an example of 'Charitable Arbitrage'—acting as a pass-through to convert tax-deductible donor funds into corporate revenue for the family business. The ledger doesn't lie. More details here: x.com/TheQuantUni/st…
The Quantified Universe tweet media
English
0
0
0
102
Forbes
Forbes@Forbes·
How Eric Trump Created A Myth Around His Kids-Cancer Charity The president’s son did a lot of good for kids with cancer. He also perpetuated a fantasy about his charity for years, which he continues to push to this day. Read more: forbes.com/sites/danalexa…
English
21
28
60
36.9K
The Quantified Universe
The Quantified Universe@TheQuantUni·
#TheMacroScorecard: The Math of Charitable Arbitrage (Eric Trump Foundation) The Eric Trump Foundation did, in fact, raise millions of dollars for St. Jude Children’s Research Hospital. That is an undeniable positive. However, the Forbes investigation revealed a massive, mathematical contradiction between the charity's public relations and its tax filings. Here is the exact accounting of the "Myth." 1. The Public Claim: Zero Friction For years, the core marketing pitch of the Eric Trump Foundation was efficiency. Eric Trump publicly claimed that because they hosted their annual charity golf tournament at a Trump-owned property, they got to use the assets "100% free of charge." * The Pitch: If you donate $100, practically all $100 goes directly to kids with cancer because the charity has zero facility overhead. 2. The IRS Form 990 Reality (The $1.2M Shift) Look at the generated chart, which maps the charity's IRS filings from 2007 to 2015. * In the early years (2007-2010), the math mostly aligned with the pitch. The costs of the tournament were roughly $50,000 a year (just covering basic out-of-pocket expenses for food/caddies). * But starting in 2011, the math violently decoupled. Costs spiked to $142,000, and by 2012, they hit $400,000. * The Audit: Forbes uncovered that the Trump Organization suddenly started billing the charity for the use of the golf course. Over a seven-year period, $1.2 million was paid from the charity directly into the revenue streams of the Trump family business. 3. The "Donor Loop" Mechanism This creates a mathematical loop of Charitable Arbitrage. * Outside donors give money to the Eric Trump Foundation believing it will go to St. Jude. * The charity then takes a portion of that money (hundreds of thousands of dollars) and uses it to pay the Trump Organization for the event space. * The Result: The charity effectively acts as a pass-through entity, converting tax-deductible outside donations into corporate revenue for the family business. The Verdict: You don't need to yell about corruption to make this point. You just have to point to the ledger. You cannot publicly market a "0% expense ratio" while simultaneously filing tax returns showing $1.2 million being funneled to your own properties. Forbes article: forbes.com/sites/danalexa…
The Quantified Universe tweet media
English
0
0
0
24
The Quantified Universe
The Quantified Universe@TheQuantUni·
It is absolutely legitimate to ask for citations. I don't build charts without them. The data is aggregated from the CDC’s Morbidity and Mortality Weekly Reports (MMWR), The Lancet, NEJM, and JAMA. Here is the categorized bibliography for the Delta/Omicron Decoupling, the Age-Stratified Multipliers, the 14-Day Cohort Methodology, and the Myocarditis Risk Accounting. These sources are all publicly available for reading without going through a paywall. Enjoy the reading! 1. The "Decoupling" & Mortality Multipliers (The 20x Variance) These sources provide the raw data proving that unvaccinated individuals died at a rate 10x to 20x higher than fully vaccinated individuals during the Delta and Omicron waves. CDC MMWR (Jan 21, 2022): "COVID-19 Incidence and Death Rates Among Unvaccinated and Fully Vaccinated Adults with and Without Booster Doses During Periods of Delta and Omicron Variant Emergence." (This is the primary data source for the decoupling chart). CDC MMWR (Sep 17, 2021): "Monitoring Incidence of COVID-19 Cases, Hospitalizations, and Deaths, by Vaccination Status — 13 U.S. Jurisdictions." Texas Department of State Health Services (Nov 2021): "COVID-19 Cases and Deaths by Vaccination Status." (This state-level data audit explicitly charted the 20x mortality multiplier). Our World in Data / Oxford University (2021-2022): "United States: COVID-19 weekly death rate by vaccination status, All ages." (Aggregated global mortality decoupling). 2. Age-Stratified Mortality (Proving the shield wasn't just for 60+) These sources prove that the efficacy multiplier held up across younger cohorts (addressing your "sleight of hand" accusation). JAMA Internal Medicine (2022): "COVID-19 Mortality Risk Among Unvaccinated and Vaccinated Adults by Age Group." (Provides exact multipliers for the 18-49 age bracket). The Lancet Infectious Diseases (Sep 2022): "COVID-19 vaccine effectiveness against severe disease and death in the USA: a systematic review and meta-analysis." CDC MMWR (Jan 28, 2022): "Effectiveness of a Third Dose of mRNA Vaccines Against COVID-19–Associated Emergency Department and Urgent Care Encounters and Hospitalizations Among Adults." (Stratified by 18-49, 50-64, and 65+). 3. The 14-Day Window & "Partially Vaccinated" Cohorts These sources explain the biological necessity of the 14-day window and prove that health agencies tracked this cohort separately. NEJM - New England Journal of Medicine (Dec 2020): "Safety and Efficacy of the BNT162b2 mRNA Covid-19 Vaccine." (The original Phase 3 clinical trial detailing the exact antibody generation timeline/curve). CDC COVID Data Tracker Methodology: "Defining Vaccination Status." (The official statistical guidelines proving that patients within the 14-day window were classified as 'Partially Vaccinated,' not 'Unvaccinated'). 4. The "Accounting" of Adverse Effects (Myocarditis) These sources contain the exact math proving the virus is vastly more likely to cause heart inflammation than the vaccine. CDC MMWR (Apr 8, 2022): "Cardiac Complications After SARS-CoV-2 Infection and mRNA COVID-19 Vaccination — PCORnet, United States, January 2021–January 2022." * Penn State College of Medicine / Frontiers in Cardiovascular Medicine (Aug 2022): "Risk of Myocarditis and Pericarditis after the COVID-19 mRNA Vaccination and SARS-CoV-2 Infection." (The massive meta-analysis calculating the exact incidence rates used in the bar chart). Nature Medicine (Dec 2021): "Risks of myocarditis, pericarditis, and cardiac arrhythmias associated with COVID-19 vaccination or SARS-CoV-2 infection." 5. The Historical Baselines (Measles & Polio) These sources contain the pre- and post-vaccine timelines used in the initial thread. CDC "Pink Book" (Epidemiology and Prevention of Vaccine-Preventable Diseases): Chapter 13 (Measles) and Chapter 18 (Poliomyelitis). World Health Organization (WHO): "Measles reported cases and incidence." (Global historical tracking data).
English
1
0
1
38
The Quantified Universe
The Quantified Universe@TheQuantUni·
The Math of the $50 Tylenol Have you ever wondered why a hospital bill looks like a work of fiction? It’s because of the "Chargemaster." The Logic: Hospitals set "Sticker Prices" (the Chargemaster) at 500% to 1,000% above cost. Why? Because it’s the starting point for a high-stakes negotiation with insurance companies. The Math: Hospital Cost: $1.00 Sticker Price: $50.00 Insurance "Discount": 80% ($40.00 off) Final Price: $10.00 The Verdict: ⚠️ Undetermined The insurance company looks like a "hero" for saving you 80%, but you still paid 1,000% of the actual cost. The "mirage" is the discount. In healthcare, the only person who pays the real price is the person with no insurance—the person least able to afford it.
English
0
0
0
23
The Quantified Universe
The Quantified Universe@TheQuantUni·
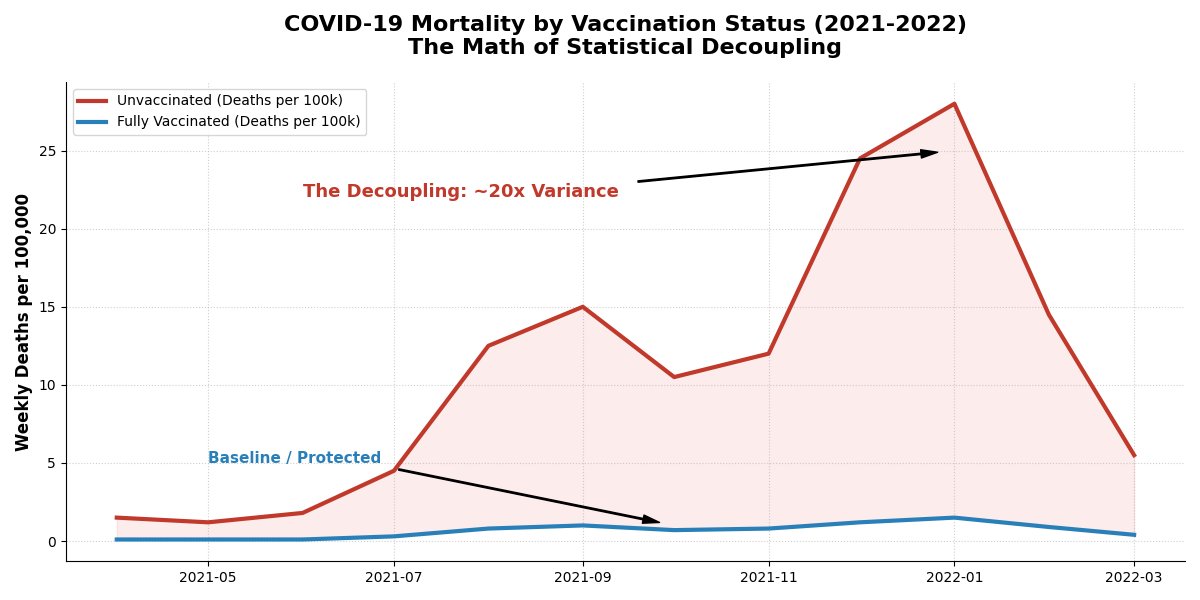
Two mathematical corrections here: The original clinical trials published 95% efficacy against symptomatic disease, not 100%. 100% doesn't exist in biology, and no reputable individual in the field would ever make that kind of claim. The '14-day rule' isn't a game; it's immunology. It takes your body 14 days to build antibodies after the shot. Furthermore, health agencies didn't just dump these people into the 'unvaxxed' bucket; they tracked them separately as 'Partially Vaccinated.' As the data shows, the 'Partial' cohort had a mortality rate right in the middle. If they had dumped them into the unvaxxed data, it actually would have lowered the unvaxxed death average. Keeping the cohorts separate kept the math clean.
The Quantified Universe tweet media
English
1
0
0
43
Mark Brady
Mark Brady@Bradybits·
@TheQuantUni @TealusLildailye @simonmaechling The number of games played with Covid data was astounding. The first being that the vax prevent getting the disease at all. The second being that “it doesn’t take effect for weeks” so any death in those weeks was counted as unvaxxed. This guarantees a higher death rate.
English
1
0
2
43
The Quantified Universe
The Quantified Universe@TheQuantUni·
The DDT timeline actually disproves the pesticide theory entirely. The Salk vaccine dropped Polio cases to near-zero by 1960. However, US DDT usage actually hit its all-time peak of 80 million pounds in 1959, and wasn't banned until 1972. If DDT caused the paralysis, cases would have peaked in 1959. Instead, the disease crashed while the pesticide was at its maximum usage. The lines completely decoupled in 1955.
The Quantified Universe tweet media
English
0
0
0
7
The Quantified Universe
The Quantified Universe@TheQuantUni·
If 500k measles cases were simply reclassified as 'rashes', the hospitalizations wouldn't have changed, just the paperwork. Pre-1963, measles caused ~48,000 hospitalizations and ~500 deaths a year. Post-vaccine, we didn't see an unexplained spike of 48,000 kids hospitalized for 'generic rashes.' The severe outcomes vanished along with the case cliff. Furthermore, wild measles caused 'Immune Amnesia.' Aggregate data shows childhood deaths from other pathogens plummeted after the vaccine was introduced because kids were no longer losing their antibody memory.
English
0
0
0
45
Diana S. Schaffer
Diana S. Schaffer@Diana_Schaffer·
@TheQuantUni @simonmaechling Diagnostic substitution will do that - when my child got measles post measles vaccine the doctor diagnosed “rash”. Measles was usually a benign infection conveying benefits like lifelong immunity, unlike vaccination.
English
1
0
2
57
The Quantified Universe
The Quantified Universe@TheQuantUni·
You are conflating 'Absolute Risk' with 'Efficacy.' You are correct that a healthy 30-year-old has a very low absolute risk of dying. But if we stratify the data by age, an unvaccinated 30-year-old was still mathematically 12x more likely to die than a vaccinated 30-year-old. The absolute baseline is driven by age and health, yes. But the 'decoupling multiplier' (the 12x to 20x shield) existed across every single age bracket. That isn't sleight of hand; it's age-stratified math.
The Quantified Universe tweet media
English
2
1
1
47
Jimmy Fike
Jimmy Fike@TealusLildailye·
@TheQuantUni @simonmaechling Nice slight of hand you did there. If you don't have at least three other serious medical issues. The probability of you dying was below 0.001%. However, if you limit the data to people that did have multiple issues and were over the age of 60, then you get that 20%.
English
1
0
0
42
The Quantified Universe
The Quantified Universe@TheQuantUni·
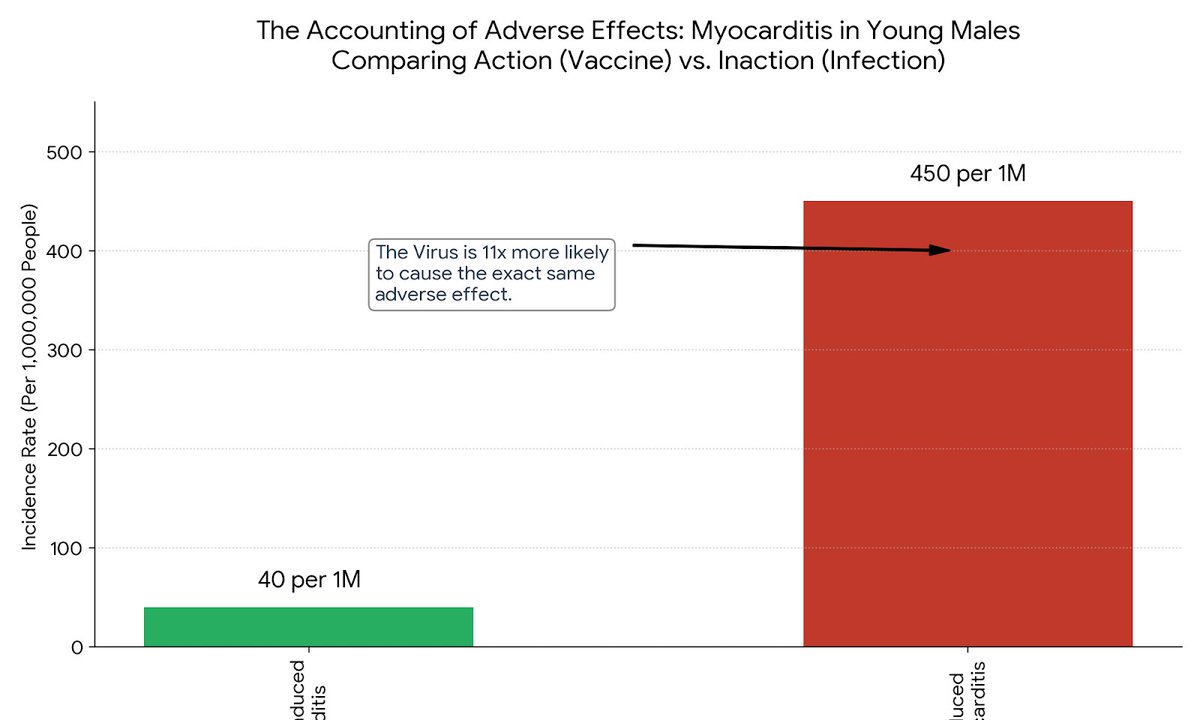
This is a completely valid point. Risk vs. Reward is the only equation that matters in medicine. But that 'accounting' does exist, and it's rigorously tracked. Take Myocarditis (heart inflammation) in young males, the most cited mRNA adverse effect. The accounting: Vaccine Risk: ~40 cases per 1 Million doses. Infection Risk: ~450 cases per 1 Million infections. The virus is statistically 11x more likely to cause the exact adverse effect people fear from the shot. We often misjudge the risk because human brains weigh the danger of an 'action' (getting a shot) much heavier than an 'inaction' (catching a virus), even when the math strongly favors the action.
The Quantified Universe tweet media
English
0
0
1
54
The Quantified Universe
The Quantified Universe@TheQuantUni·
@simonmaechling You can debate pharmaceutical profit margins, lobbying, and government mandates all you want. Those are valid political conversations. But you cannot debate the cliffs. Biological interventions leave massive, undeniable statistical footprints. The math of immunity is real.
English
0
0
1
34
The Quantified Universe
The Quantified Universe@TheQuantUni·
But the math for the COVID vaccine is fundamentally different. It didn’t stop transmission; it forced a 'Statistical Decoupling.' In late 2021, data showed unvaccinated adults were up to 20x more likely to die from the virus than vaccinated adults. If the shot was a placebo, that ratio is mathematically 1:1. A 20x variance is the signature of efficacy.
The Quantified Universe tweet media
English
4
3
5
140