

Mark Trader
57 posts

$MSCI
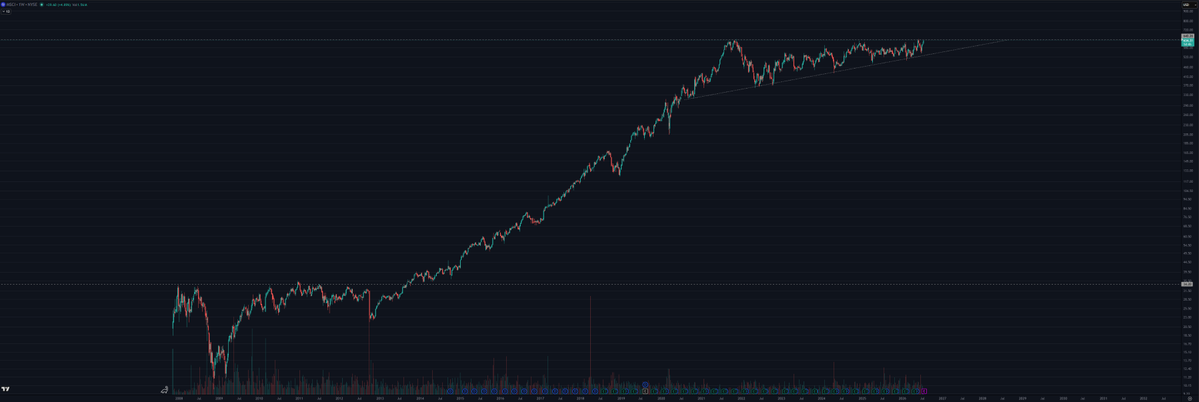
Mega opportunity for the long term book.
4y consolidation.
Last time we broke out of such a range we went from 50x within a decade.
Superinvestors:
-Polen Capital Management
-Thomas Gayner: Markel
-Li Lu: Himalaya Capital Management
-Terry Smith: Fundsmith
-Yacktman Asset Management
-Jensen Investment Management
English

I continue to struggle with my fight against cancer, and its been weeks since I had a day without suffering.
But this morning, I've decided to open up the charts & remembered #IBDLive and how much I liked that show.
So, I tuned in and ran it in the background to distract my mind.
@mwebster1971 speaking about $dell
Its a great show, you can try it for 3 months for $9.95 #IBDPartner
bit.ly/3Or1CSx

English

@ohiain Iain, are you using the price break of first 15 or 30 min candle (ORB) or are you describing if in morning there's selling, waiting for first 15 min green candle and then a break of that?
English

I will ALWAYS buy into strength.
If I'm watching the 9EMA and price slices through it like a hot knife through butter, I'm not trying to be a hero + bottom tick the exact LOD.
I wait for buyers to prove they're actually there using 15/30min pivots, then I buy the strength off the weakness & risk LOD 99% of the time.
Could I miss the exact bottom? yes, but I DON'T CARE.
I'm not trying to buy at the lowest intraday price, but I am trying to buy the moment the auction shifts from sellers back to buyers. Catching falling knives cost me years of mental pain. Waiting for confirmation has cost me a few cents... but it's saved me thousands of dollars and made me a much more patient trader.
+ it may take a couple of attempts before the trade sticks, but that's a small price to pay compared to bleeding out trying to catch every falling knife.
To my younger self - "buy strength."
English

One of the biggest lessons I’ve learned:
Every major drawdown feels like this is it.
October 2023.
April 2024.
August 2024.
April 2025.
March 2026.
Every single one felt different while you were living through it. The headlines got louder, fear spread everywhere, and it became easy to convince yourself that another 2000 or 2008 had arrived.
But here’s what I’ve noticed:
Corrections and bear markets are not the same thing.
A correction is often driven by sentiment, positioning, or macro uncertainty.
A true bear market is usually accompanied by a sustained deterioration in fundamentals:
- Earnings growth slows or turns negative.
- Companies begin cutting CapEx.
- Market leadership narrows and breaks down.
- Major indexes form persistent lower highs and lower lows.
That’s why I spend far more time studying earnings reports than financial headlines.
The market can ignore fear.
It struggles to ignore deteriorating earnings.
Could we eventually see another prolonged bear market in next 3 or 4 years? Yes.
But until I see meaningful evidence that corporate earnings, CapEx spending, and institutional leadership are breaking down, I treat sharp pullbacks as part of a bull market - not a reason to abandon my process.
The biggest gains I’ve ever made came after periods that felt the most uncomfortable.
Staying invested doesn’t mean ignoring risk.
It means knowing the difference between temporary volatility and a genuine change in trend.
That’s a distinction every investor/trader should learn.
Separate fear from facts, and you’ll separate yourself from the crowd.
H/T: @charliebilello

English
@anandragn I hope it resets. Right now looks like sloppy late-stage base at best, topping action at worst.
English


$SNDK Great to see Mike Webster talk about the exact precedent I’ve been watching, drawing the parallel to $QCOM in September–October 1999.
SanDisk remains the stock I’m most keyed in on. Not just because it has been my best winner, but because it has been the true market leader of this cycle, the exact type of stock a legend like Bill O’Neil would be watching closely, as Mike pointed out.
There are other important liquid leaders worth monitoring, including $MU, $AMD, $DELL, and a couple of others. But to me, there isn’t a more important stock in this market than $SNDK.
It remains the clearest risk-on/risk-off indicator out there. The key is to stay open-minded and keep looking at it objectively.
Appreciate your insights as always @mwebster1971


Anand@anandragn
$SNDK might be the greatest stock in market history. Every time the bull trend reclaims, the playbook feels stupid simple: slap long, forget it exists, go out and play some sport. I seriously hope this post doesn’t top the stock, though 🤞😂
English


@LeifSoreide With some tech names in 4th stage or later bases, maybe these tighter bases that haven't broken will lead to some new leadership?
English

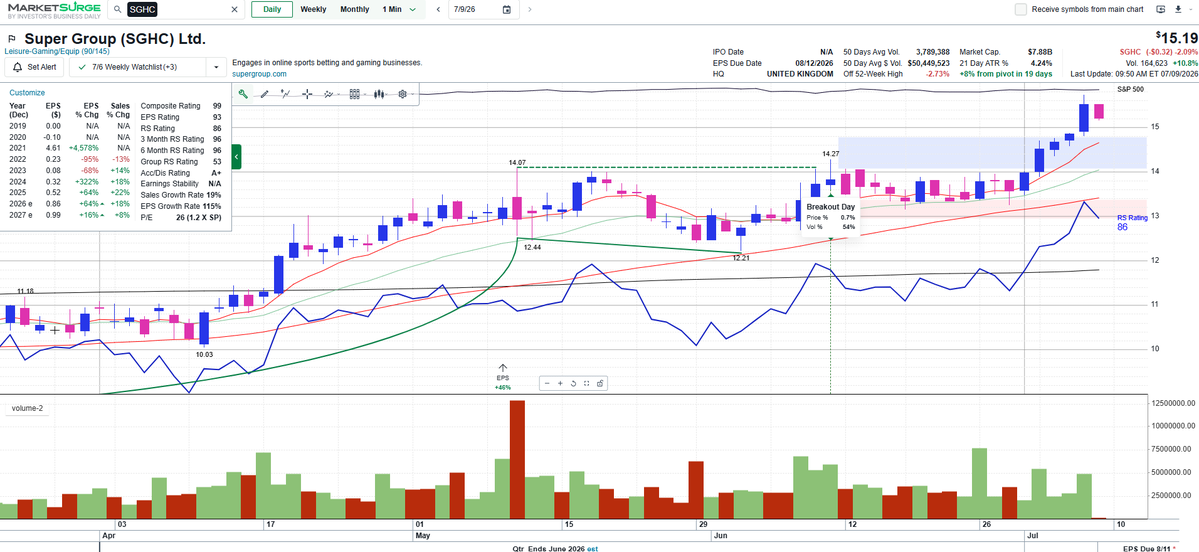
Random pattern buying in slow-moving laggards is having its day in the sun. Some signs today that the hot AI theme is coming back today after a brief vacation. Hopefully you caught some of these randos, but I missed some in random laggy groups in a name like $SGHC for example:
English
@ohiain would love some sideway for the price to get below 4 ATRs from the 50.
English
$HOOD continues to be 1 of the strongest names on my watchlist.
It's been showing incredible relative strength versus both the market and other leaders since the start of the month, which is exactly the type of behavior I want to keep leaning into.
I've been long since the low 100s, and today I averaged up, adding more exposure off the 9EMA + 110 pivot right off the open.
That's a big part of my philosophy:
I don't add to losers, I pyramid into winners.
If a stock is proving itself, holding support, and continuing its Stage 2 transition, I'll happily size into it because the market is permitting me to be more aggressive.
Pyramiding into relative strength has been 1 of the biggest contributors to my best trades over the years.
Now it's simply a matter of managing risk, letting the position work, and seeing if the market wants to reward patience with another leg higher.
Chart: $HOOD.

iain@ohiain
1 of my favorite places to initiate a position isn't the breakout itself... It's the first pullback after the b/o. That's exactly why I bought $HOOD yesterday. The first pullback after a Stage 1 breakout is often where institutions remind you why they bought it in the first place. $HOOD spent roughly 130 days building a Stage 1 base. That's months of price moving sideways while buyers and sellers battled for control. Eventually, buyers won + price broke above the range, volume expanded on up days, and the stock officially transitioned into what I would consider a Stage 2 uptrend. Now the name gets my attention. Most traders see the breakout and think they missed the move. I actually became more interested after the breakout because I know stocks don't move in a straight line forever. Healthy leaders expand, digest, and then give you another opportunity if you're patient enough to wait. The first pullback after a Stage 1 breakout is one of the highest-probability areas I know to get involved. But why? Because the stock has already answered the hardest question. It has already proven institutions are willing to accumulate shares aggressively enough to push price out of a months-long base. Now I'm simply watching to see if those same institutions are willing to defend the first test of support. That's why I pay so much attention to the 9EMA and 21EMA combo. Not because moving averages magically hold price... but because they tend to become areas where strong stocks naturally pause, reset, and reveal whether demand is still present. When $HOOD started pulling back into the 9/21EMA cluster, I wasn't rushing to buy it. I was watching it, because I wanted to see the character of the pullback. > Was volume drying up? > Were sellers becoming less aggressive? > Was the stock holding tighter than the market? > Was $HOOD showing relative strength still? > Were buyers beginning to defend the area instead of allowing price to completely lose structure? Those are the questions running through my head. I'm not buying the moving average, but I'm buying the buyers, who are pushing the stock higher. Once I start seeing buyers step back in, I immediately drop down to my execution timeframe. This is where my 15/30-minute pivots become so valuable. They allow me to react to what buyers are doing intraday. Instead of trying to catch the exact low, I'm waiting for momentum to actually begin shifting back in my favor. That gives me something every trader should be looking for: 1) A clearly defined risk level. If the pivot fails, I know I'm wrong. But if buyers continue defending the pullback, I'm positioned near the beginning of the next expansion leg. That's what I call an asymmetric opportunity. The strongest stocks almost always make you uncomfortable before they reward you. They rarely go straight up forever because they pull back just enough to shake out weak hands, create doubt, and make everyone wonder if the move is over. Then they quickly reclaim support and continue higher. That's why I love these setups so much. I'm trying to identify where institutions are likely defending the trend. Will every first pullback work? Of course not. Some will stop me out, and some will need another week or two of tightening. Some will undercut the moving averages before reclaiming them... but that's just part of trading. But after years of studying leaders and countless others, this behavior keeps showing up over and over again. - Large base. - Strong breakout. - Healthy digestion. - First pullback into the 9/21EMAs. - Buyers step in. - Momentum returns. It's a pattern I've built a tremendous amount of confidence in because I've seen it repeat across so many different leaders and market cycles. At the end of the day, my goal is 2 position myself where the trend has already proven itself, buyers are beginning to take back control, my risk is clearly defined, and the upside is still heavily skewed in my favor. That's exactly what I saw in $HOOD. And that's exactly the type of opportunity I'll continue looking for as long as the market keeps giving it to me. Chart: $HOOD.
English
@Mr_Derivatives he must not know that 50% of its parent companies assets are tied to ethereum
English

My guy Wayne bought over $3M worth of $WYFI!
Holy shiiii.
Does he know something!?
Wayne Liang@wliang
Full transparency, I’m holding 86,000 shares of $WYFI at ~$34.5 average. Actively looking to add on pullbacks to hover near ~100,000 shares. IMO retail is starting to realize what $META did… $NBIS should not have sold off like that. $WULF / Anthropic validated the entire neocloud thesis and it doesn’t seem like the market has properly priced it in. There’s a reason institutions swooped in and picked up shares instantly after the selloff began. As usual, I will add/sell as I see fit.
English
@SRxTrades I followed him until that post. I think he’s got some decent trade ideas, but 70% as swing trader and the non-broker pnl lol
English

I’m 24.
I make $1.3m per year.
I owe it all to the world's most boring trading strategy
Here's what I do (& how you can too) 🧵👇:

English

Focus on setups with a clear catalyst and reason to go up or down. Avoid pure pattern-based breakouts.
Kris Van@krisnai68
@PradeepBonde Based on your experience, what do you think is the best strategy in this kind of market? Is it worthy to take a shot on good setups or just stay out of the market until it finishes the choppy period?
English
@RichardMoglen @PradeepBonde What's his process for catching a catalyst?
English

I'll be interviewing @PradeepBonde on Episodic Pivots, Delayed Entries and Situational Awareness
What should I ask him?
English
@alphacharts365 Someone on discord yesterday said IREN is the laggard now, but I could argue CIFR was the laggard vs other neoclouds in april/may, but now looks like a leader. Just curious your thoughts on this and leaders vs laggards. I've found sometimes buying the base can work. Thank you!
English

@NickSchmidt @i_manage_risk With the Qs choppy until noon or so, what were you looking for to help you get positioned? Thanks!
English

@i_manage_risk I added back small exposure today now 34% and someone said only 34% what if we go up 3% tomorrow? 🤣 imagine bein worried bout missing a day or 2 or 3
English
@mikulkal I guess an example would be RKLB, below the 50 sma on 4/10, but nice base. Wouldn't it make sense to look at a base like that even though a lot of other stocks were at or near highs by that date? Just trying to understand leaders vs laggards better. Thank you Leos!
English

@TraderStapes Not much. I’d rather find creative entries in leaders, like pullback buys, recoveries. That is not to say I don’t have e.g. some medicals on my watchlist
English
Market Summary - WK23: Healthy damage in tech?
Undoubtedly, Thu & Fri brought heavy selling in the up-to-now leading tech-heavy sectors.
But if you zoom out to the weekly/monthly timeframe, in many cases this still looks more like a constructive pullback (so far!) than something truly damaging. At the end of the day, even the largest institutions won't keep buying forever. At some point, they cut the stream and wait for better opportunities.
At the same time, we've clearly seen larger rotation into healthcare and defensive-type sectors such as insurance, REITs, tobacco or selected consumer staples.
One thing that caught my attention during weekend screening:
A lot of the names currently setting up nice bases have relatively low RS ratings
Which leaves me with two possible interpretations:
1) We're seeing a structural shift and the previous tech leaders are done.
2) We're seeing a temporary rotation out of tech while high-RS names go through needed digestion before continuing higher.
Maybe I'm too optimistic, but I'm leaning heavily toward scenario #2
Why?
- Because for many of the previous leaders, the rally only represented breakouts from primary or second-stage bases. In software, some names barely got started
- Rotation itself doesn't necessarily signal bearishness - if anything, it confirms that the economy is functioning well enough for capital to move between sectors instead of abandoning risk altogether
- And let's not forget: AI spending, tech spending, infrastructure spending, capex... none of that suddenly disappeared. We just came out of a pretty constructive earnings season. It would be somewhat surprising if the entire theme rolled over a few weeks later as if none of it had happened.
Of course, anything can happen.
But something tells me there's still much more left to conquer here.
For now, I'm treating this as healthy damage until proven otherwise.
English
@RealSimpleAriel @CharDogg42069 The fact he got so defensive to a fair question should tell you everything you need to know.
English

@CharDogg42069 I could learn a thing or two from that salesmanship
English
Maybe there was a misunderstanding between Mark and me, but I went ahead and pulled the biggest stock market winners over the 1-, 3-, and 5-year timeframes along with their rolling 20-day average dollar volume.
Take a look at the data and tell me what they all have in common.
Sure, if you're trading a smaller account, you can get away with names doing $20–50 million in daily dollar volume. But the biggest winners have overwhelmingly come from stocks trading well above that level.
Since I was apparently talking out of my ass, I decided to pull the data and build the spreadsheet. I'm always open to discussion and differing viewpoints, but unfortunately Mark chose to resort to name-calling.
So I'll remain a well-studied chump in the meantime.
Leading groups, leading stocks, accelerating earnings, accelerating sales—these names are almost always liquid and typically trade north of $100 million in average daily dollar volume.
Again, this may simply be a misunderstanding, but the spreadsheet is attached for anyone who wants to do their own homework.
For what it's worth, I have a great deal of respect and admiration for @markminervini and everything he's built—minus a little of the backhanded disrespect.
docs.google.com/spreadsheets/d…
Mark Minervini@markminervini
That's how I made the 700,000%. With all due respect, if I could be honest. You are talking out your ass. To qualify for your $100 million cutoff, a $25 stock would need to trade approximately 4 million shares per day, and a $10 stock would need to trade 10 million. Unless your running a multi-billion dollar fund for Fidelity, your standard is totally ridiculous. Even then, it's too restrictive. I would guess that only about 400-500 stocks even trade 4-10 million shares per day. I'm done with this conversation. My advice to you is to attend my Master Trader Program. You will learn how to trade like a champ... and then you will then stop talking like a chump. Best wishes my friend. 😇🙏
English
This bull market has gotten so strong we’ve got former NBA players in on the action 🏀
kuz@kylekuzma
Yep wait till their data center build out 🔥🔥🔥 heavy capex
English