The Trading Parrot

11.2K posts

The Trading Parrot banner
The Trading Parrot

The Trading Parrot

@TradingParrot

I use charts to travel to the future 😎 🦜
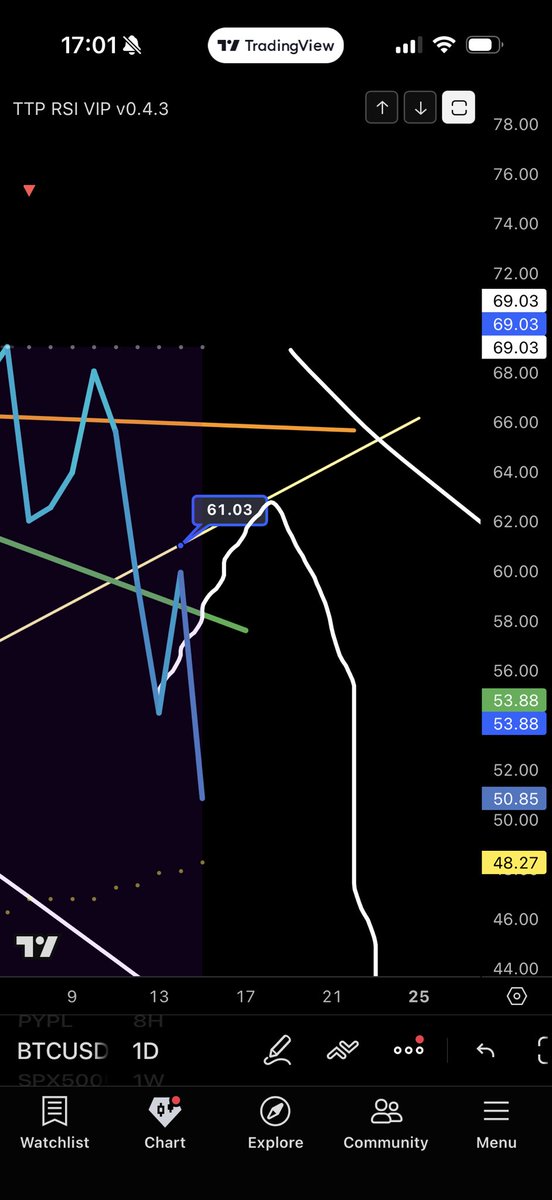
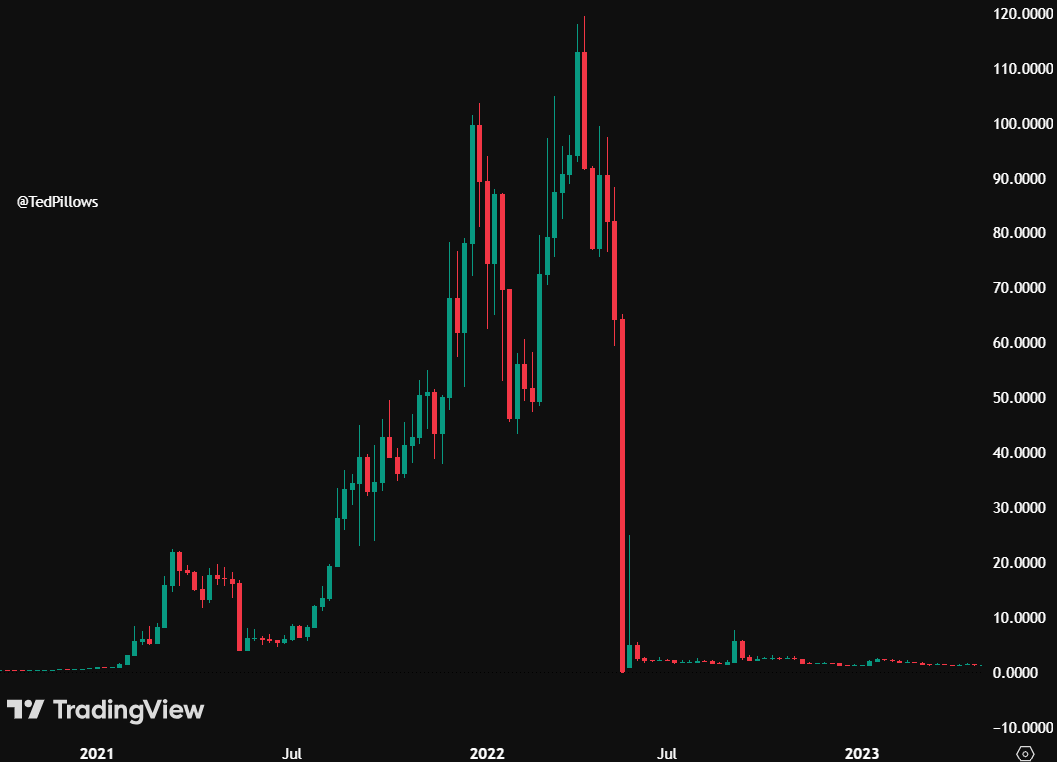
Argentina Katılım Kasım 2020
749 Takip Edilen8.7K Takipçiler
Sabitlenmiş Tweet
The Trading Parrot
The Trading Parrot@TradingParrot·
Watch Out! Nightmare Short Squeeze Incoming - 3 Signals Watch now 👉 youtu.be/F1h9xk8bKVw Watch summary 👉 patreon.com/posts/153338103 Is a nightmare short squeeze incoming for Bitcoin? The Trading Parrot reveals 3 critical signals — aggregated open interest patterns, liquidation data showing no major short liquidations yet, and the crypto fear & greed index roadmap — that could determine Bitcoin's next big move. With BTC defending $73,100 support and key resistance at $78,000, the market is at a crossroads. Don't miss this data-driven analysis before it's too late — watch now! 00:00 Introduction and Today's Alpha Overview 03:07 Aggregated Open Interest Double Bottom Analysis 06:32 Bitcoin Daily: $73,100 Defense Level 08:33 Nine Consecutive Green Days Count Reset 10:47 Loan Liquidation Regime: Bear Market Warning 13:36 Bear Market Liquidation Pattern Breakdown 16:32 Trading Ranges: Second Alpha Introduction 17:36 PNR Filter: Volume Percentile Entry Signals 20:07 SOPR and Volume Pain Signal Methodology 24:40 Current Setup: Volume Confirmation Pending 27:10 Third Alpha: Crypto Fear and Greed Index 29:25 Fear and Greed Level 10 Historical Roadmap 34:48 Fear and Greed RSI Squeeze Analysis 35:28 Open Interest, CVD, and ETF Inflows Update 37:29 Fire Charts, Order Book, and Trading Outlook #Bitcoin #BTC #ShortSqueeze #CryptoTrading #BitcoinAnalysis
YouTube video
YouTube
The Trading Parrot tweet media
English
1
2
7
551
The Trading Parrot
The Trading Parrot@TradingParrot·
BTC, ETH, SOL, XRP, SUI, FET, CHZ, HBAR, ICP, BNB, ILS1, BTCETH Altcoins Analyzed: Live TA Watch now 👉 youtu.be/Dw437Y-IkRQ In this live technical analysis session, The Trading Parrot breaks down BTC, ETH, SOL, XRP, SUI, FET, CHZ, HBAR, ICP, and BNB, covering key support levels, liquidation zones, and bear market roadmaps. With Fear & Greed at 3, Bitcoin testing $68K support, and altcoins like Ethereum and Solana defending critical necklines, this is essential watching for crypto traders navigating the current downturn. Don't miss the full analysis — watch now! 00:00 Bitcoin 4-Hour Breakdown and $68K Liquidation Target 06:28 Fear and Greed at 3 and Bear Market Seasonality 12:42 Weekly RSI Roadmap and Bear Market Foundation 14:12 Ethereum $2.1 Support vs Bitcoin Underperformance 17:25 DXY Dollar Bullish and US 10-Year Yield Analysis 22:49 HBAR Support Defense and Revenge Rally Setup 24:21 XRP Rejection at $1.5 and Channel Support Levels 27:49 ETH/BTC Ratio and Altcoin Season Conditions 32:22 BNB Head and Shoulders Risk Below $600 39:35 Israel Shekel Futures Cap and Handle Setup 43:51 Solana Weekly Breakout Retest and Altcoin Outlook 46:57 Hype DEX Analysis Short Setup and Long Thesis 51:06 Sui Accumulation Strategy and Bear Market Levels 56:13 Gold Topping and Silver M Pattern Analysis 1:04:04 ICP Bullish Divergence and $3 Recovery Target #CryptoTA #Bitcoin #Altcoins #XRP #Solana
YouTube video
YouTube
The Trading Parrot tweet media
English
0
1
2
240
The Trading Parrot retweetledi
Brave❤
Brave❤@Giga_Gab·
@TradingParrot Can the parrot 🦜 finally get 1000 likes ….. let’s goooooo !!! About time tip top alpha from him day in day out !!
English
0
2
2
261
The Trading Parrot
The Trading Parrot@TradingParrot·
In today’s video, beyond covering short-term price action and key levels, I explained three separate alpha signals. The first alpha suggests we are very close to a level where price historically tops, based on the cyclical nature of liquidations within a typical bearish regime. It didn’t quite reach the 0% line — sitting around 2% — but it’s close enough to read as a bearish signal. The second alpha indicates that we haven’t yet seen a liquidity spike during this bear flag. In a bear flag, price pushes up and is supposed to generate pain — but that pain hasn’t registered in the percentiles yet. This means we could dump from here, or we could continue higher until that signal triggers. Crucially, we do not need that signal to dump. I know many of you watched the video and concluded: “He said the signal hasn’t triggered, so we must go up.” That’s not what it means. The takeaway from that alpha is simply that we don’t yet have a quality sell signal — and I often enter positions before that signal appears. That’s it. The third alpha looks at the Fear & Greed Index. Historically, during this type of period, price tends to rally into the resistance of a downward-sloping trendline applied to the index. Concretely, that means the Fear & Greed Index should push up to around 47 — after having been below 10 — and then consolidate in the 15–18 range for a period while the market finds its bear market bottom, before eventually breaking out of the trendline and initiating the real bull run. We are not there yet. A secondary implication of this alpha is that some additional upside remains possible. So two out of three alphas were signalling that there may still be upside ahead. I understand this can seem like the alphas were “wrong” given today’s price action — but that perception only holds if you can’t distinguish between timeframes. These alphas describe a period, not a day trade call. When an alpha points up, it means upside is available — not necessarily from today. We could still see 82K next week after first visiting 65K. Nobody knows the exact path. Please be careful how you interpret these videos. If an alpha’s timeframe isn’t clear to you — whether it applies to the next few hours, the next few weeks, or the next few months — ask. I sometimes forget to specify that in the video, and I’d much rather answer a clarifying question than watch people rush to conclusions that were never part of the analysis.
English
0
2
7
305
The Trading Parrot retweetledi
The Trading Parrot
The Trading Parrot@TradingParrot·
Urgent Action: The BTC Signal That Only Appears Once Every Few Years Watch now 👉 youtu.be/XrndN5TPHHs Watch summary 👉 patreon.com/posts/153170635 Bitcoin just triggered a rare signal that has appeared only a handful of times in its entire history — 8 consecutive green daily candles since Binance listing. The Trading Parrot breaks down what this means, analyzes the 2022 vs 2025 divergence, CVD institutional selling, liquidation levels, and a live short trade entered at $74,300. Watch now to understand whether Bitcoin is heading to $82K or on the verge of a major breakdown — this is critical analysis you cannot afford to miss. 00:00 Order Fill at $74,300 and Weekly Setup Overview 04:58 Bullish vs Bearish Assessment 05:15 Inverse Head and Shoulders Pattern Analysis 07:52 Bull Flag Structure and Price Targets 10:04 Market Structure Continuation Signals 12:11 Eight Consecutive Green Days Signal 14:00 What Eight Consecutive Days Means for Bitcoin 16:01 Historical Signal Analysis on TradingView 17:07 RSI and PNR Indicator Mechanics 19:57 Indicator Combinations and Signal Confluence 22:29 Capitulation and Cycle Pattern Comparison 24:45 2022 vs Current Cycle Comparison 28:00 Short-Term Holder Realized Price Analysis 31:00 Trade Update and Closing Remarks #Bitcoin #BTC #BitcoinAnalysis #BitcoinTrading #CryptoTrading
YouTube video
YouTube
The Trading Parrot tweet media
English
1
2
14
931