Andries van Tonder

1.1K posts

Andries van Tonder banner
Andries van Tonder

Andries van Tonder

@Triedzi

Research Associate at Department of Veterinary Medicine, University of Cambridge

Cambridge, England Katılım Mayıs 2012
583 Takip Edilen382 Takipçiler
Andries van Tonder
Andries van Tonder@Triedzi·
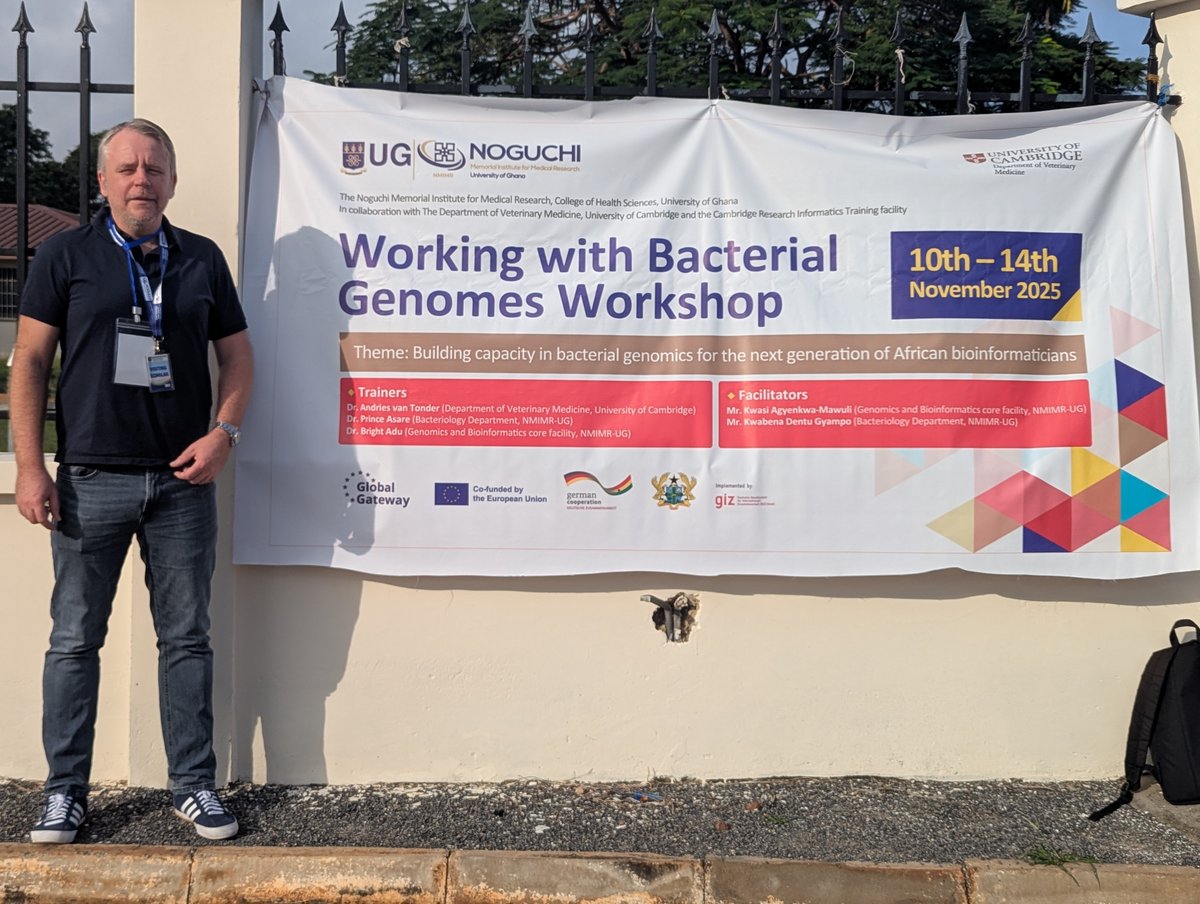
I'm very pleased to be back at Noguchi Memorial Institute for Medical Research helping run our "Working with Bacterial Genomes" course for the first time outside of Cambridge. A big thank you to the funding provided by GIZ, CRIT, Dr Prince Asare and the ongoing support from NMIMR
Andries van Tonder tweet media
English
0
1
2
51
Andries van Tonder
Andries van Tonder@Triedzi·
The next online version of our "Working with Bacterial Genomes" course is now open for registration. We aim to provide you with comprehensive training in analysing bacterial genomes covering everything from QC to clustering plasmids. Sign up here: training.cam.ac.uk/bioinformatics…
English
0
1
1
115
Andries van Tonder retweetledi
bovine tb
bovine tb@bovinetb·
Tuberculosis in found dead badgers at the edge of the expanding bovine tuberculosis epidemic. Published: 27 March 2025 nature.com/articles/s4159…
English
1
3
5
481
Andries van Tonder retweetledi
Josie Bryant
Josie Bryant@Josie_M_B·
If you have experience in sc/spatial transcriptomics with an interest in microbes....come and join our team as a computational postdoc: sanger.wd103.myworkdayjobs.com/WellcomeSang... Incredibly exciting datasets on host-microbe interactions in the lung. Pls RT and reach out if you are interested
English
2
11
6
1.8K
Andries van Tonder retweetledi
Joachim Schork
Joachim Schork@JoachimSchork·
Need to visualize multi-dimensional categorical data in R? ggalluvial, an extension of ggplot2, makes it easy to create alluvial diagrams and Sankey plots, helping you uncover patterns and flows across categories. ✔️ Plot alluvial diagrams to represent relationships between categorical variables. ✔️ Create Sankey plots to visualize flows and transitions. ✔️ Customize aesthetics, including colors, labels, and node arrangements. ✔️ Handle both wide and long-format data sets with ease. Whether you're analyzing survey responses, tracking user behavior, or exploring categorical trends, ggalluvial simplifies the creation of clear and informative visualizations. The visualization shown here is taken from the package website: corybrunson.github.io/ggalluvial/ Learn more about ggplot2 and its extensions in my online course "Data Visualization in R Using ggplot2 & Friends." Click this link for detailed information: statisticsglobe.com/online-course-… #VisualAnalytics #ggplot2 #Rpackage #DataVisualization #datascienceeducation #database #rstudioglobal #RStats #DataAnalytics #tidyverse
Joachim Schork tweet media
English
2
41
253
11.6K
Andries van Tonder retweetledi
Joachim Schork
Joachim Schork@JoachimSchork·
Visualizing gene structures in R? gggenes, an extension of ggplot2, simplifies the process of creating clear and informative gene diagrams, making genomic data easier to interpret and share. ✔️ Plot gene arrows to represent gene locations and orientations. ✔️ Visualize genomic features, including transcripts and operons. ✔️ Customize labels, colors, and layouts for clear presentations. Whether you're working on genome annotation, comparative genomics, or molecular biology research, gggenes provides a flexible and user-friendly way to display complex gene structures with clarity. The visualization shown here is taken from the package website: cran.r-project.org/web/packages/g… For a deeper dive into creating impactful visualizations with ggplot2 and its extensions, don’t miss my online course "Data Visualization in R Using ggplot2 & Friends!" Click this link for detailed information: statisticsglobe.com/online-course-… #RStats #Rpackage #DataAnalytics #ggplot2 #datastructure #DataViz
Joachim Schork tweet media
English
3
85
405
30.5K