USGS Water Resources

5.4K posts

USGS Water Resources banner
USGS Water Resources

USGS Water Resources

@USGS_Water

Observing, understanding, predicting, delivering #WaterScience 💧Comment policy: https://t.co/fdMZuJnkZx 💧Posts do not=endorsements https://t.co/SEG5ZFX36x

Katılım Nisan 2016
60 Takip Edilen7.9K Takipçiler
USGS Water Resources
USGS Water Resources@USGS_Water·
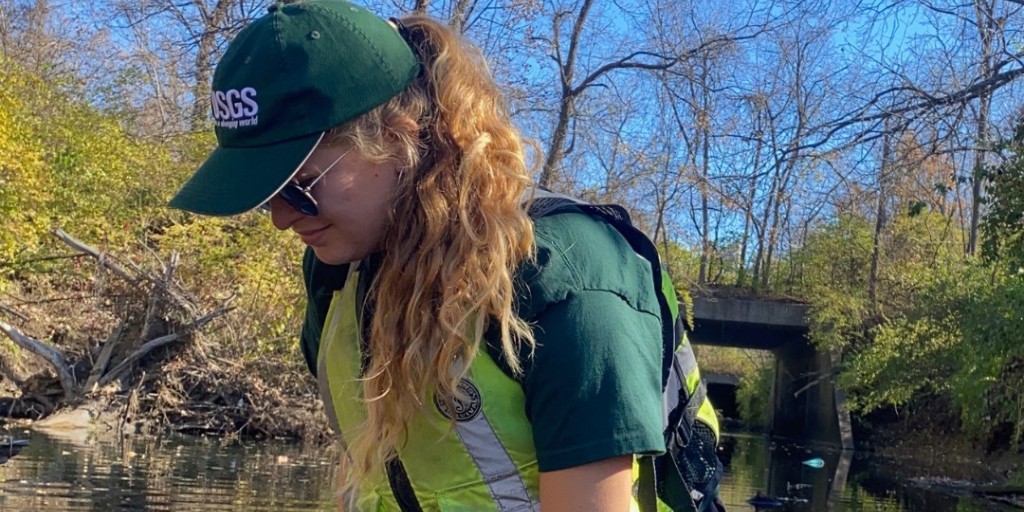
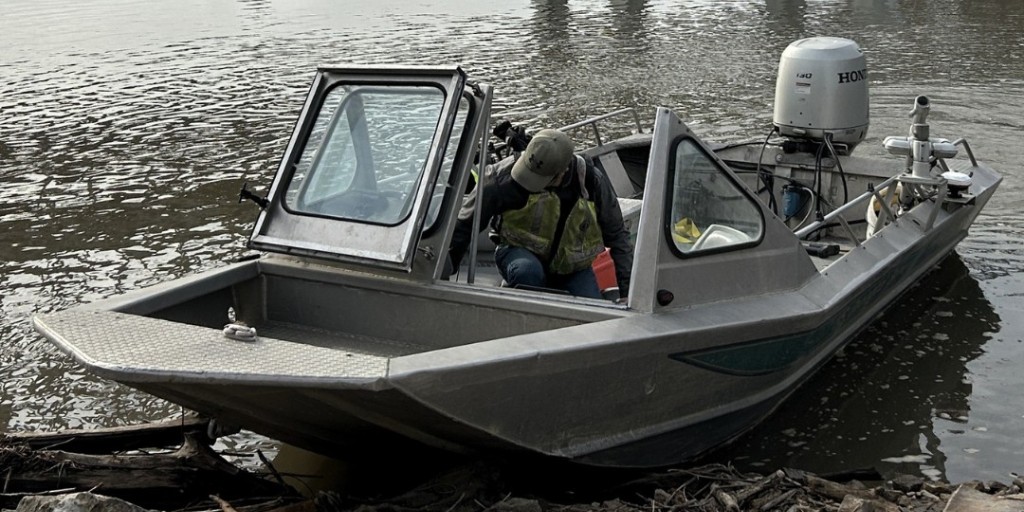
Monitoring the Mohawk: Field work at Canajoharie Creek, New York 🌊 While it looks like a quiet day on the river, USGS has been collecting samples on Canajoharie Creek, a tributary of the Mohawk River, since the 1990s. This site is part of the USGS National Water Quality Network (NWQN), a network of 102 surface water and 258 groundwater sampling locations throughout the United States. NWQN sites like this one are crucial for understanding water quality changes over time. USGS water quality sampling is essential for maintaining the health of the nation's waterways and ensuring safe water for human and ecological uses. Consistent, long-term monitoring allows us to track water quality trends, providing the data water resource managers need to make informed decisions. Learn more about the NWQN - ow.ly/JeIw50YZsNk 📷 1: Stopping to smell the flowers during routine water quality sampling at Canajoharie Creek, New York. The gage, visible in the background, is part of the USGS NQWN sampling network. 📷 2-3: Routine water quality sampling at Canajoharie Creek, New York. 📷 4: A USGS hydrologist stands along the bank of Canajoharie Creek, a tributary of the Mohawk River in New York. Photos by Sabina Gifford, USGS #FieldPhotoFriday #WaterQuality #WaterData
USGS Water Resources tweet mediaUSGS Water Resources tweet mediaUSGS Water Resources tweet mediaUSGS Water Resources tweet media
English
0
3
12
298
USGS Water Resources
USGS Water Resources@USGS_Water·
Where were you 15 years ago? We were developing new methods that have shaped our understanding of water quality across the world. USGS celebrates 15 years of WRTDS, the Weighted Regressions on Time, Discharge, and Season method. WRTDS helps scientists and water managers understand how water quality changes across seasons, flows, and watersheds. 💧 Developed in 2010, WRTDS uses a flexible, data‑driven approach that accounts for streamflow variability and seasonality, revealing how water quality constituents vary across space and time. 💧 The free EGRET package for R makes WRTDS accessible and has been downloaded more than 80,000 times across the U.S. and worldwide. 💧 With contributions from USGS, the University of Maryland Center for Environmental Science, and the Chesapeake Bay Program, WRTDS continues to inform water quality research and management around the world. To mark this anniversary, USGS authors recently published two papers on WRTDS. One provides a comprehensive review of its advancements and global applications. The other outlines a forward‑looking roadmap for the next generation of WRTDS development. Learn more - ow.ly/njr350Z2PU3 📷 1: Following recent rainfall, USGS hydrotech collects a storm sample from the Susquehanna River at Conowingo, MD. Photo by David Fisher, USGS 📷 2: A USGS hydrologist conducts horizontally-integrated synoptic water sampling of the James River at Cartersville as part of the USGS's nontidal network monitoring efforts. Photo by Rowan Johnson, USGS
USGS Water Resources tweet mediaUSGS Water Resources tweet media
English
1
1
7
283
USGS Water Resources
USGS Water Resources@USGS_Water·
Where surface water runs low, groundwater supplements water supply. Both surface water and groundwater provide critical water supplies across the United States. In surface-water limited regions, users turn to groundwater to meet water demand. But water above and below the ground can be closely connected. In the Edwards aquifer area of Texas, USGS science is providing information about surface water and groundwater connectivity, water quality, and resource vulnerability to support water availability decisions.  USGS water availability studies combine regional science to support management with national-scale science to broadly assess water resource challenges. Together, these efforts strengthen our understanding of integrated water systems and provide the science needed to protect water resources and the communities that depend on them. Read more at ow.ly/QiAo50YZIxk 📷 1: Seco Creek sinkhole in Medina County, TX provides direct recharge to the Edwards Aquifer.  #Groundwater #WaterAvailability #Texas @MySAWS
USGS Water Resources tweet media
English
1
3
8
215
LHP
LHP@Lhp2061004Lhp·
@USGS_Water Can you make your next addition to Nanatahala River in North Carolina?
English
1
0
1
17
USGS Water Resources
USGS Water Resources@USGS_Water·
1,000 cameras and counting 📷💥 The USGS has a growing network of webcams keeping watch on streams, lakes, bridges, and roads near waterways across the country. Hydrologic Imagery Visualization and Information System (HIVIS) cameras support public safety by capturing water conditions in real time, giving decision makers the information they need to plan evacuation routes, close roads, and control flooding 🌊 HIVIS cameras enable innovative research, like AI machine learning models for detecting river ice 🧊 And yes, they sometimes capture duck content 🦆 The HIVIS network now has more than 1,000 cameras online. Check out a camera near you - apps.usgs.gov/hivis/ 🎥: HIVIS timelapse of the Big Sioux River at Akron, Iowa, flooding to nearly cover bridge in June 2024. #WaterMonitoring #Innovation #HIVIS
English
4
5
20
710
USGS Water Resources
USGS Water Resources@USGS_Water·
@gregsunvibe Science for the win! 🌊It's amazing how ADCP technology has revolutionized the field! They're great for capturing flow data during floods when it's too dangerous for humans to be in the water, providing truth when it's needed most.
English
0
0
0
3
Soy Cowboy
Soy Cowboy@gregsunvibe·
I was today years old when I learnt USGS uses ADCPs for streamflow. Live data keeps water management honest.
USGS Water Resources@USGS_Water

Chasing water 🌊 Gear packed, truck loaded, and waders still damp from yesterday... This isn’t your average 9-to-5, this is the grit and grind of a USGS Hydrologic Technician. From the highest snowy peaks to the lowest coastal streams, these technicians are the boots-on-the-ground, in-the-stream team collecting the data that fuel American water science. What does it take to collect data for the nation? 🌦️ Braving the elements - From torrential rain and scorching heat to frozen rivers, hydro techs ensure the data points flow. 🛰️ High-tech fieldwork - It’s not just sticks in the water! Hydro techs use advanced sensors, ADCPs for measuring flow, and automated water-quality samplers to get accurate, real-time data. 💧 Measuring the pulse of the river - Hydro techs spend hours collecting critical streamflow data that keeps communities informed. 🧪 Water quality sampling - By collecting samples and monitoring parameters like pH, turbidity, and conductivity, they provide data federal and local agencies need to make informed water management decisions. 🛠️ Patchin’ things up - When a data logger goes down, they are technician, engineer, and/or IT support addressing the issues at hand. Whether measuring flow during a flood event or conducting a routine site visit, hydro techs are the backbone of water science. 💬 Have you seen a USGS hydro tech in the field? 📷 1: Discrete water quality, bacteria, and microbial sample collection for the Independence Storm Water project in Missouri on Adair Creek. 📷 2: Preparing to launch a boat on the Missouri River at Jefferson City, MO. 📷 3: Processing a bacteria sample collected from the Grand River near Sumner, MO, to determine Total Coliform and E. Coli concentrations in the river. 📷 4: A high-water mark captured using a known elevation from the CSG for the peak rainfall event of the year at Little Osage River near Horton MO. Credit: Jessica Todd, USGS #FieldPhotoFriday #WaterScience #WaterData

English
1
0
0
5
USGS Water Resources
USGS Water Resources@USGS_Water·
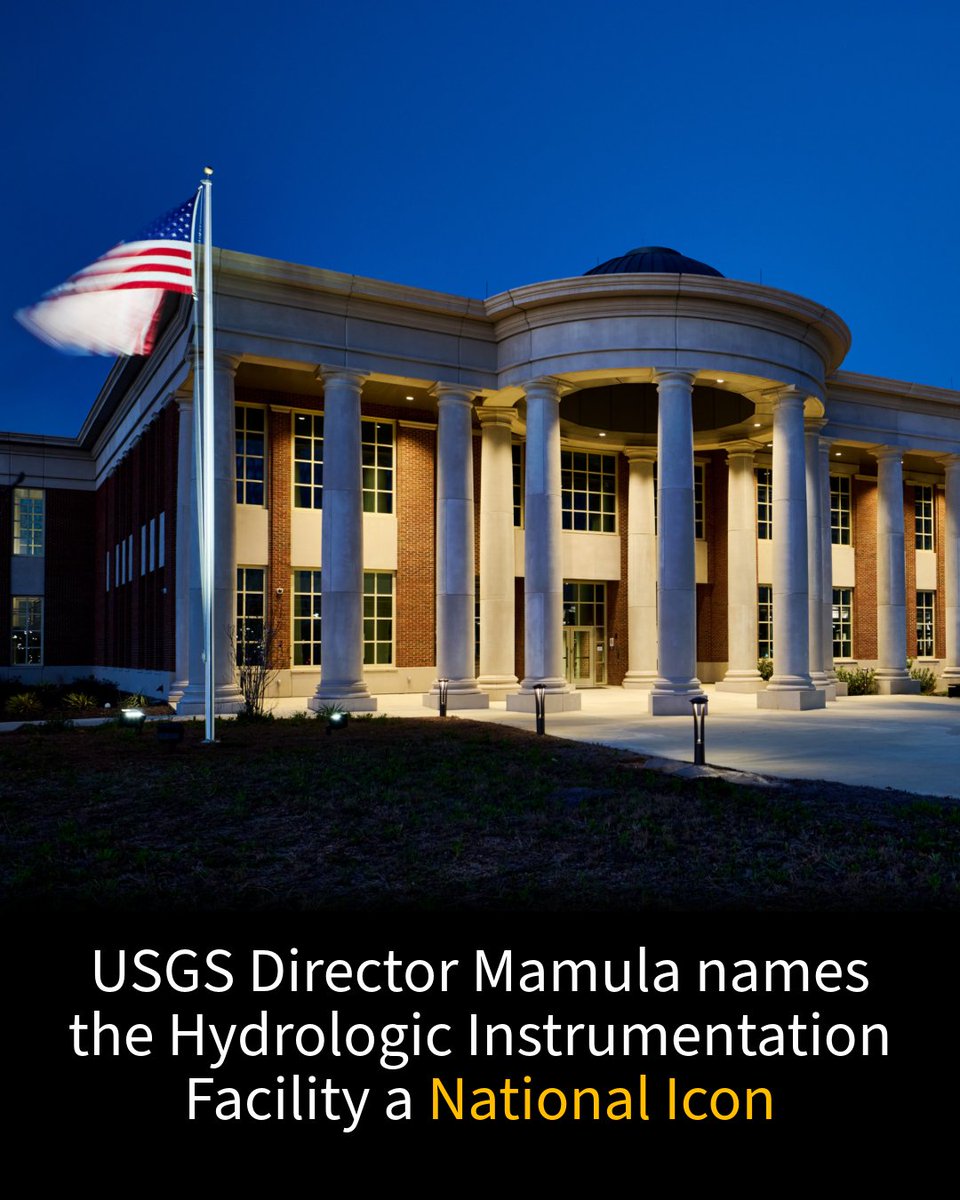
The USGS Hydrologic Instrumentation Facility (HIF): A National Icon. During a recent visit to the HIF in Tuscaloosa, AL, USGS Director Ned Mamula toured state-of-the-art labs, met with employees, and learned about the research and development of innovative water monitoring technologies. In an interview after the tour, Director Mamula highlighted the role that HIF plays in water research: “From what I saw today, Alabama is one of the leaders in the country in this endeavor. This is not just classic academic hydrology; this is way beyond that. Way, way, way beyond that.” The HIF is a state-of-the-art 92,500 sq. ft facility nestled into The University of Alabama campus, which includes the Alabama Water Institute and NOAA’s National Water Center – an area the locals call “WaterTown, USA.” The HIF includes: 💧 A 30,500 sq. ft hydraulics lab equipped with several large tow tanks, a tilting flume, and a test basin. 💧Fabrication and repair shops and testing labs that enable staff to quickly and precisely create or repair parts and sensors for water monitoring technology. 💧A warehouse that stocks and ships more than 1,400 hydrologic data collection items for use in water monitoring around the country. Visit usgs.gov/labs/hydrologi… to learn more about the HIF and stay tuned this summer while we feature several exciting events at the HIF. 📷 1: Image of the HIF at dusk. Photograph by @alabama_water #WaterScience #Alabama #Hydrology
USGS Water Resources tweet media
English
0
1
6
175
USGS Water Resources
USGS Water Resources@USGS_Water·
Chasing water 🌊 Gear packed, truck loaded, and waders still damp from yesterday... This isn’t your average 9-to-5, this is the grit and grind of a USGS Hydrologic Technician. From the highest snowy peaks to the lowest coastal streams, these technicians are the boots-on-the-ground, in-the-stream team collecting the data that fuel American water science. What does it take to collect data for the nation? 🌦️ Braving the elements - From torrential rain and scorching heat to frozen rivers, hydro techs ensure the data points flow. 🛰️ High-tech fieldwork - It’s not just sticks in the water! Hydro techs use advanced sensors, ADCPs for measuring flow, and automated water-quality samplers to get accurate, real-time data. 💧 Measuring the pulse of the river - Hydro techs spend hours collecting critical streamflow data that keeps communities informed. 🧪 Water quality sampling - By collecting samples and monitoring parameters like pH, turbidity, and conductivity, they provide data federal and local agencies need to make informed water management decisions. 🛠️ Patchin’ things up - When a data logger goes down, they are technician, engineer, and/or IT support addressing the issues at hand. Whether measuring flow during a flood event or conducting a routine site visit, hydro techs are the backbone of water science. 💬 Have you seen a USGS hydro tech in the field? 📷 1: Discrete water quality, bacteria, and microbial sample collection for the Independence Storm Water project in Missouri on Adair Creek. 📷 2: Preparing to launch a boat on the Missouri River at Jefferson City, MO. 📷 3: Processing a bacteria sample collected from the Grand River near Sumner, MO, to determine Total Coliform and E. Coli concentrations in the river. 📷 4: A high-water mark captured using a known elevation from the CSG for the peak rainfall event of the year at Little Osage River near Horton MO. Credit: Jessica Todd, USGS #FieldPhotoFriday #WaterScience #WaterData
USGS Water Resources tweet mediaUSGS Water Resources tweet mediaUSGS Water Resources tweet mediaUSGS Water Resources tweet media
English
0
2
14
253
USGS Water Resources
USGS Water Resources@USGS_Water·
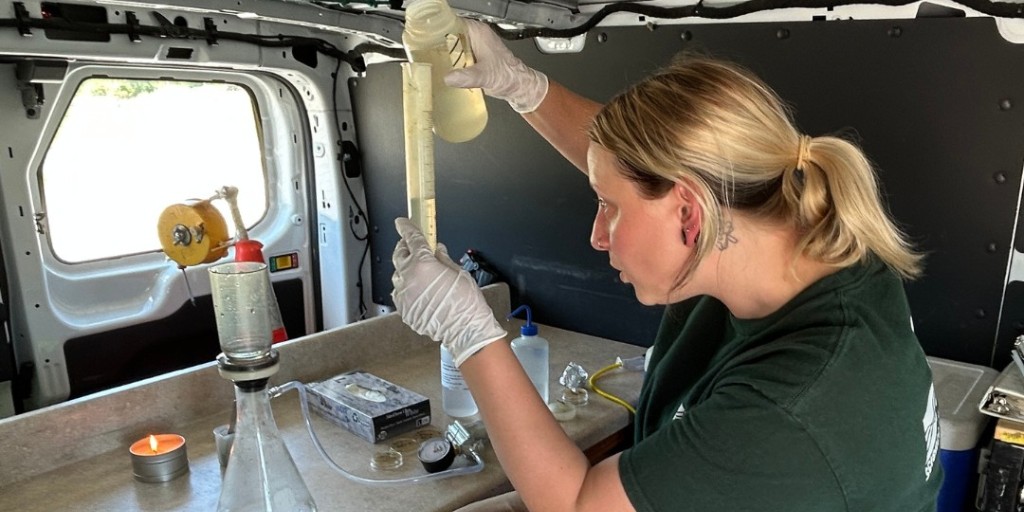
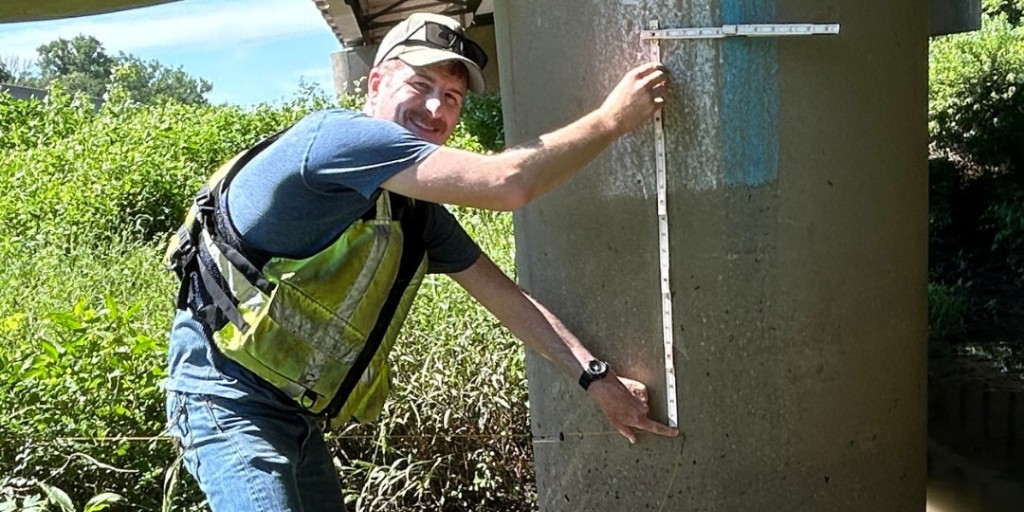
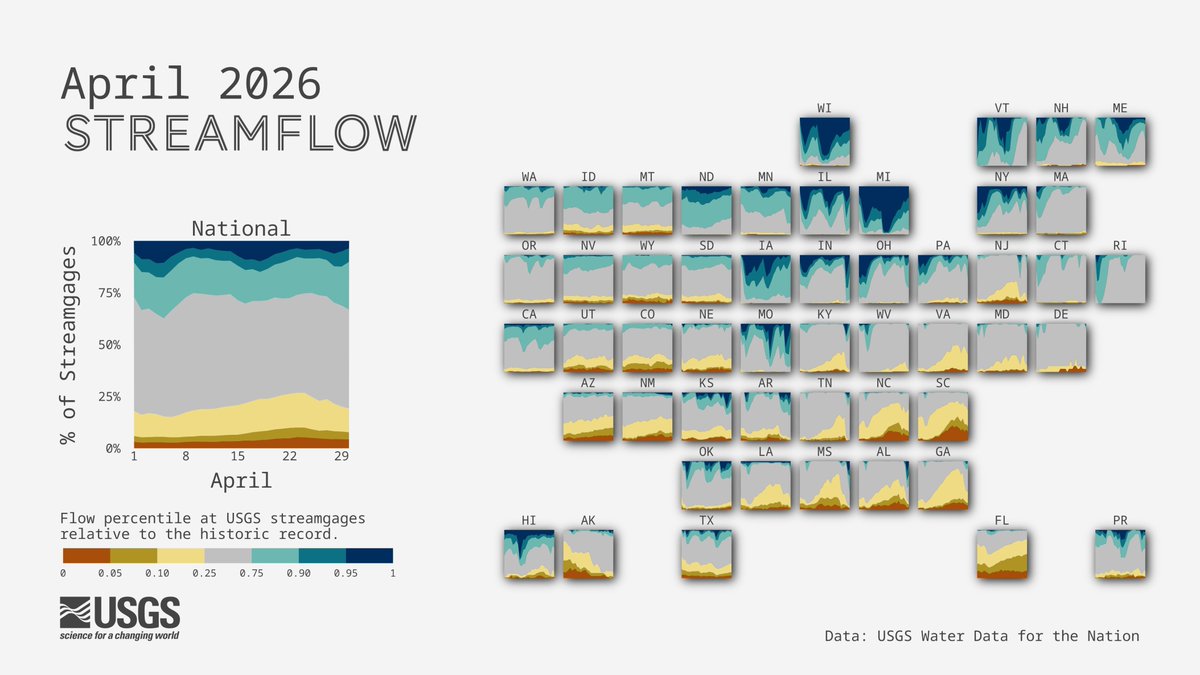
April streamflow conditions across the U.S. 💧 In April, wet conditions expanded across much of the Midwest and Northeast, while dry conditions persisted across parts of the Southern and Southwestern U.S. Notable weather patterns included: 🚧 Torrential rainstorms in Hawaii brought flash flooding and some record stream heights 🌧️ Repeated storm systems brought sustained rainfall to the Midwest and Northeast 🌊 High streamflow developed across parts of the central U.S. as runoff increased ☀️ Drier conditions continued across portions of the Southwest and southern Plains Find more water data visualizations on the USGS VizLab - water.usgs.gov/vizlab 📸 Combined visual showing a tile chart for national streamflow conditions by flow percentiles at USGS streamgages relative to the historic record across the U.S. Flow percentiles are broken up into seven bins from 0-100% where increased percentiles indicate wetter conditions. To the right, streamflow conditions for the U.S. are shown with a tile chart for each state. #WaterData#rstats#dataRetrieval
USGS Water Resources tweet media
English
1
3
10
327
USGS Water Resources
USGS Water Resources@USGS_Water·
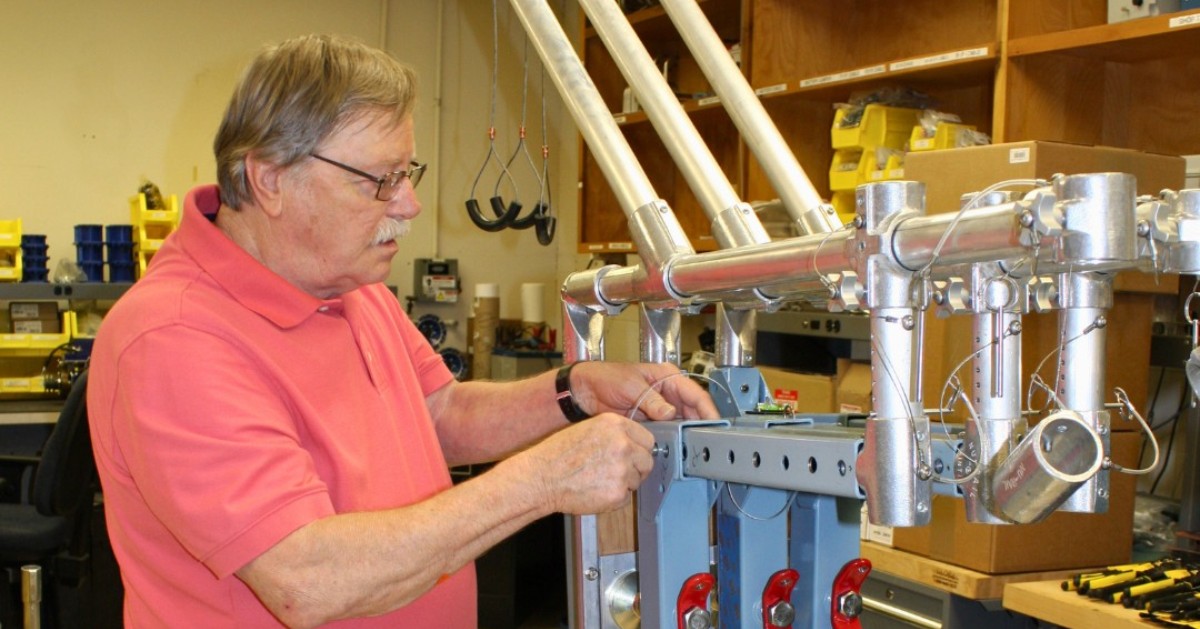
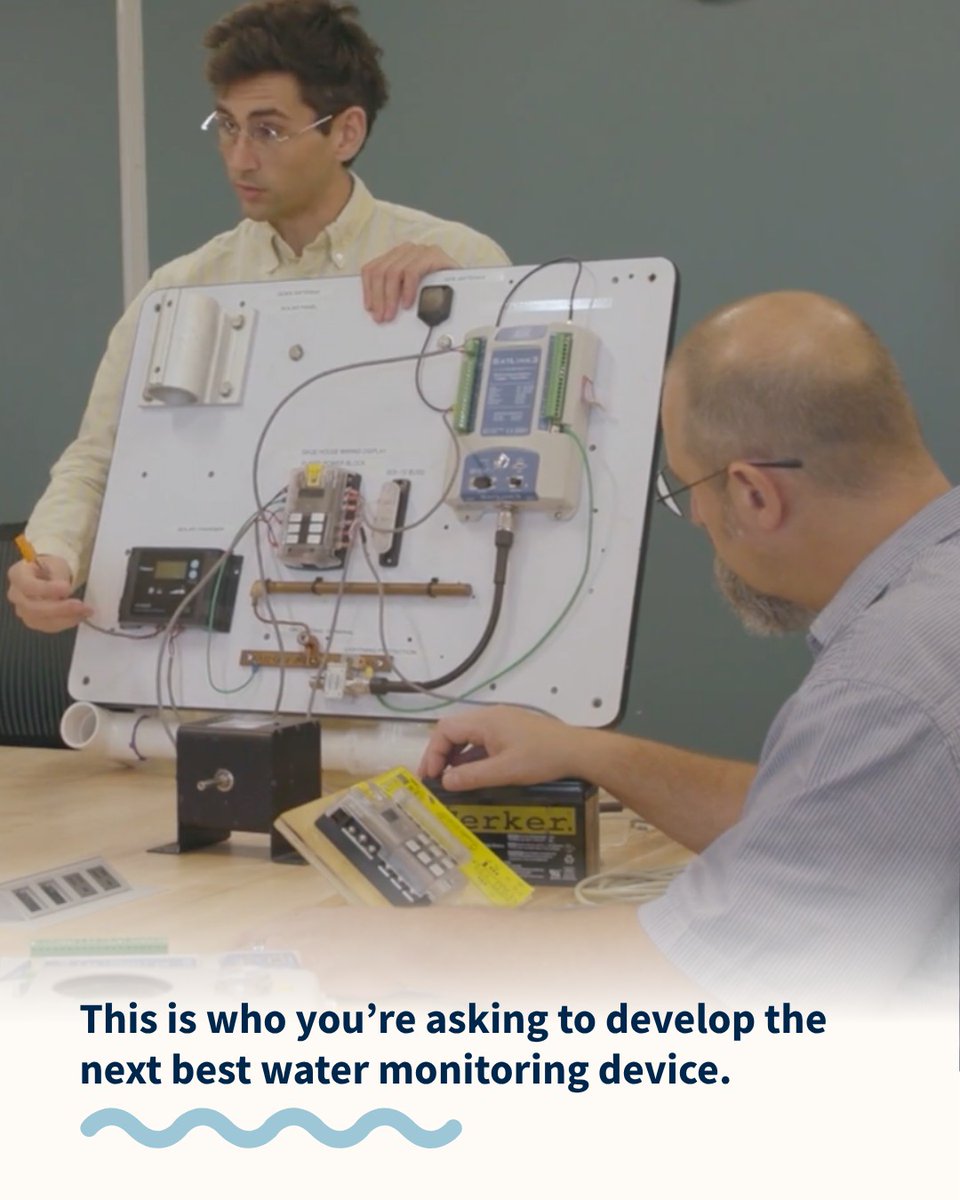
This is who you’re asking to develop the future of water monitoring. Whether training the next generation of hydrologists, installing sensors in remote rivers, or coding next-gen platforms, USGS scientists are leaders in water monitoring technology innovation, moving USGS beyond legacy systems into a high-tech future. 🛰️ Next Generation Water Observing System (NGWOS) experts are leading the way in sensor innovation, delivering high-fidelity, real-time data on water quantity, quality, and use to the nation’s most critical basins. 🛠️ The Hydrologic Instrumentation Facility (HIF) is the national center for provisioning essential water monitoring equipment, conducting cutting-edge hydrologic research, and training current and future hydrologists of America. 🤖 Data Scientists pair physical science with AI and machine learning to predict water temperature and availability with new precision, providing resource managers with tools to manage changing conditions. 🚁 Aerial innovators leverage UAS technology to provide a bird’s-eye view of our nation’s water, delivering high-fidelity data from hazardous or remote sites while keeping our teams safely out of harm’s way. 🌐 Water Data for the Nation (WDFN) developers are modernizing decades of data to build a faster, mobile-friendly, and API-driven experience for everyone from emergency managers to weekend kayakers. 📷 1: Preparing to deploy an Autonomous Underwater Vehicle (AUV) in the Delaware River for autonomous water-quality data collection. 📷 2: Preparing a wingtra lidar flight at the Darby Creek landfill Superfund site on March 27, 2025. 📷 3: A USGS scientist standing by the Colorado River above Roaring Fork River at Glenwood Springs, CO, gage shelter. 📷 4: Assembling one of three Rapid Deployment Gage (RDG) mounts. Photo by Joanne Jones, USGS #PSRW2026 #FacesOfUSGS #Innovation
USGS Water Resources tweet mediaUSGS Water Resources tweet mediaUSGS Water Resources tweet mediaUSGS Water Resources tweet media
English
2
2
9
411
USGS Water Resources
USGS Water Resources@USGS_Water·
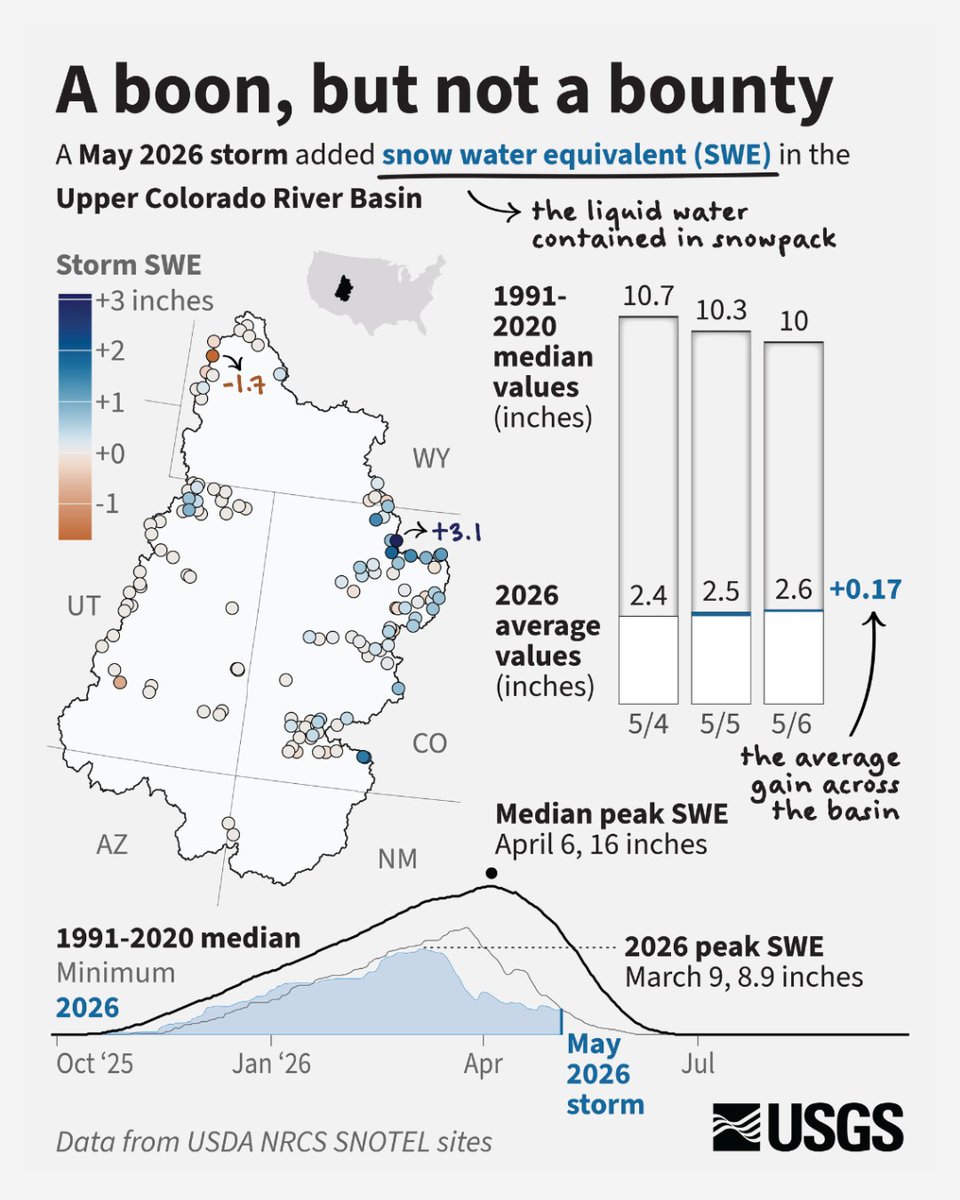
A boon, but not a bounty. ❄️💧 After a dry winter defined by record-low snowpack and an early March melt-out, recent snow (May 5-6) in the Rocky Mountains provided a temporary boost to Snow Water Equivalent in the Colorado River Basin. ❄️ Over 2 feet of snow fell in some northern mountainous areas. ❄️ The storm lifted Colorado's statewide snowpack from the lowest on record, giving the Colorado River Basin a much needed, but small, boost in Snow Water Equivalent, the liquid water contained in snowpack. ❄️ While this storm is a small victory, it’s not enough to overcome a dry water year. Every drop counts! 💧 View the Infographic on the USGS VizLab - water.usgs.gov/vizlab 📷 Infographic showing added Snow Water Equivalent in the Upper Colorado River Basin as a result of the May 2026 snowstorm. Data from USDA NRCS SNOTEL sites. #Colorado #Drought #Snowpack
USGS Water Resources tweet media
English
0
4
10
307
USGS Water Resources
USGS Water Resources@USGS_Water·
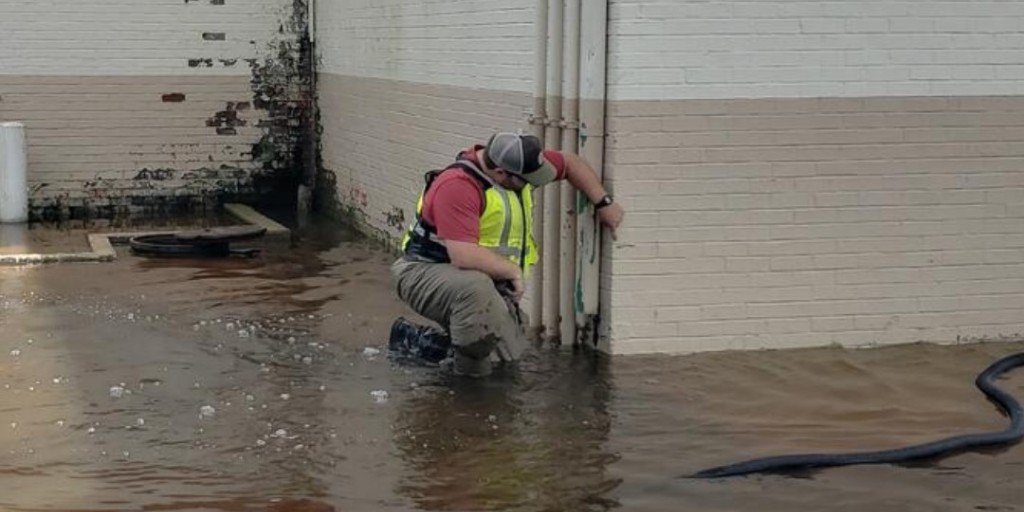
This is who you’re asking to track rising water levels. When waterways flood, trusted information can save time, property and lives. USGS hydrologists, technicians, and scientists work in flooding conditions to measure rivers, maintain streamgages, document flood impacts, and help provide real time water data communities rely on. During Public Service Recognition Week, we recognize the people behind the science who help before, during and after flooding events. Today wraps up our focus on the folks behind USGS water science from mapping our nation's shorelines to responding to flood events. Which career path would you choose? What other water-related careers are you interested in hearing more about? Let us know in the comments! 📷 1: A USGS hydrologic technician installs storm surge sensor prior to Hurricane Irene landfall. Storm surge sensors help capture water levels during coastal flooding and major storms. 📷 2: A USGS hydrologic technician adjusts equipment while preparing to make a river measurement from a cableway. Cableways help technicians safely measure fast-flowing rivers during high-water conditions. 📷 3: A USGS scientist repairs a streamgage downstream of Addicks Reservoir at Buffalo Bayou in Texas after flooding from Hurricane Harvey. Streamgages provide critical real-time water data during flood events. A USGS hydrographer measures a high-water mark on a building in North Carolina after flooding caused by Hurricane Florence. High-water marks help document flood extent and improve future preparedness. 📷 4: A USGS scientist repairs a streamgage downstream of Addicks Reservoir at Buffalo Bayou in Texas after flooding from Hurricane Harvey. Streamgages provide critical real-time water data during flood events. #PSRW2026 #FieldPhotoFriday #Flooding
USGS Water Resources tweet mediaUSGS Water Resources tweet mediaUSGS Water Resources tweet mediaUSGS Water Resources tweet media
English
0
3
12
334
USGS Water Resources
USGS Water Resources@USGS_Water·
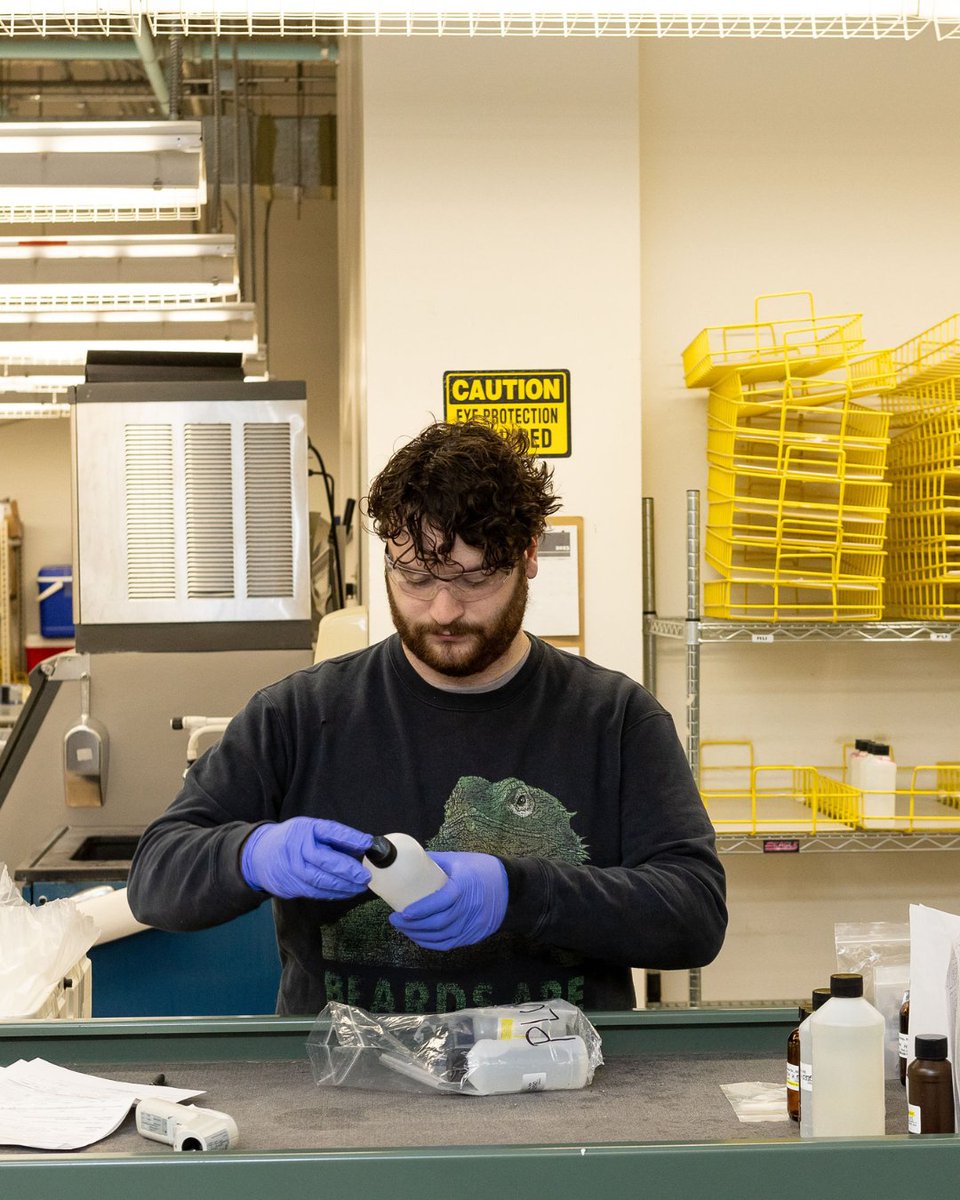
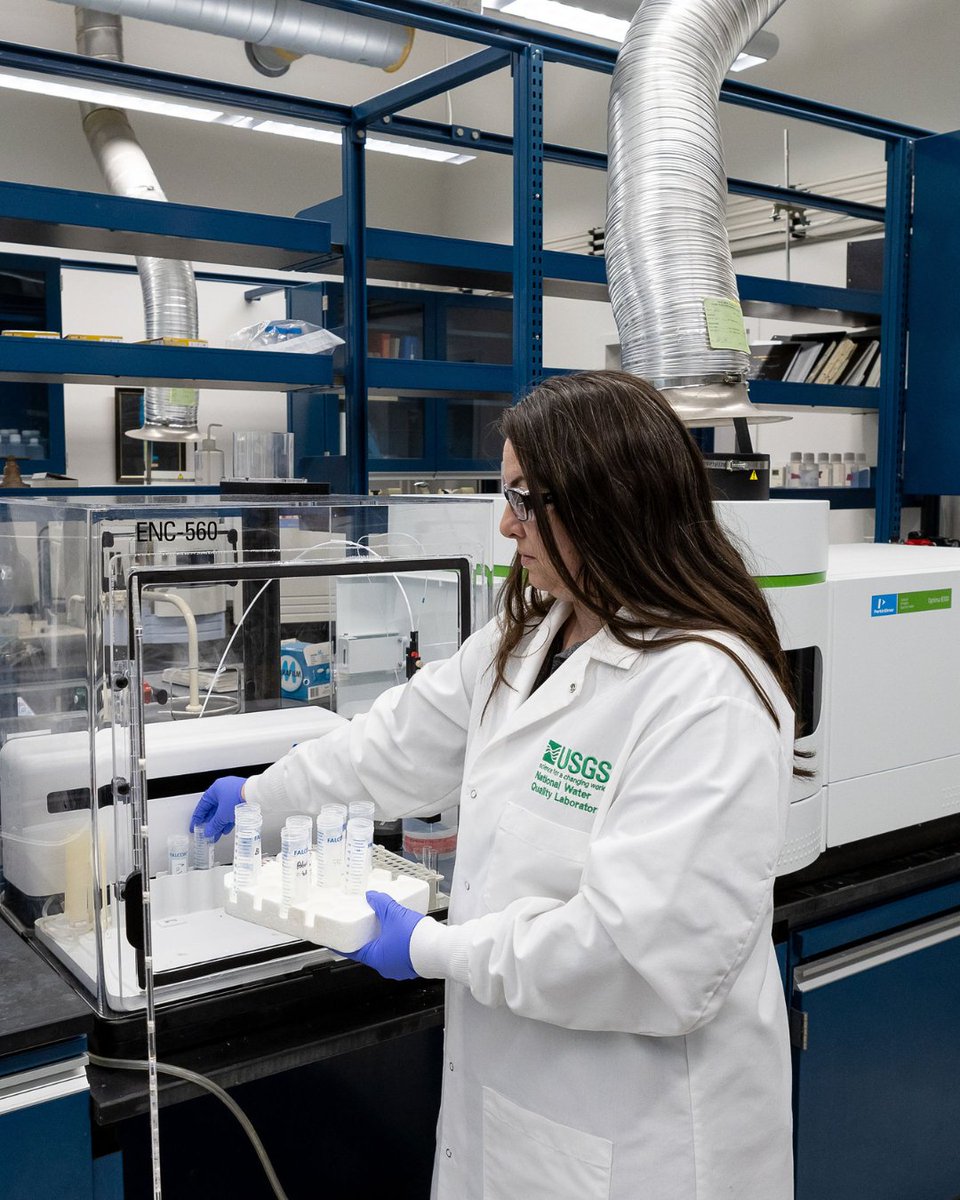
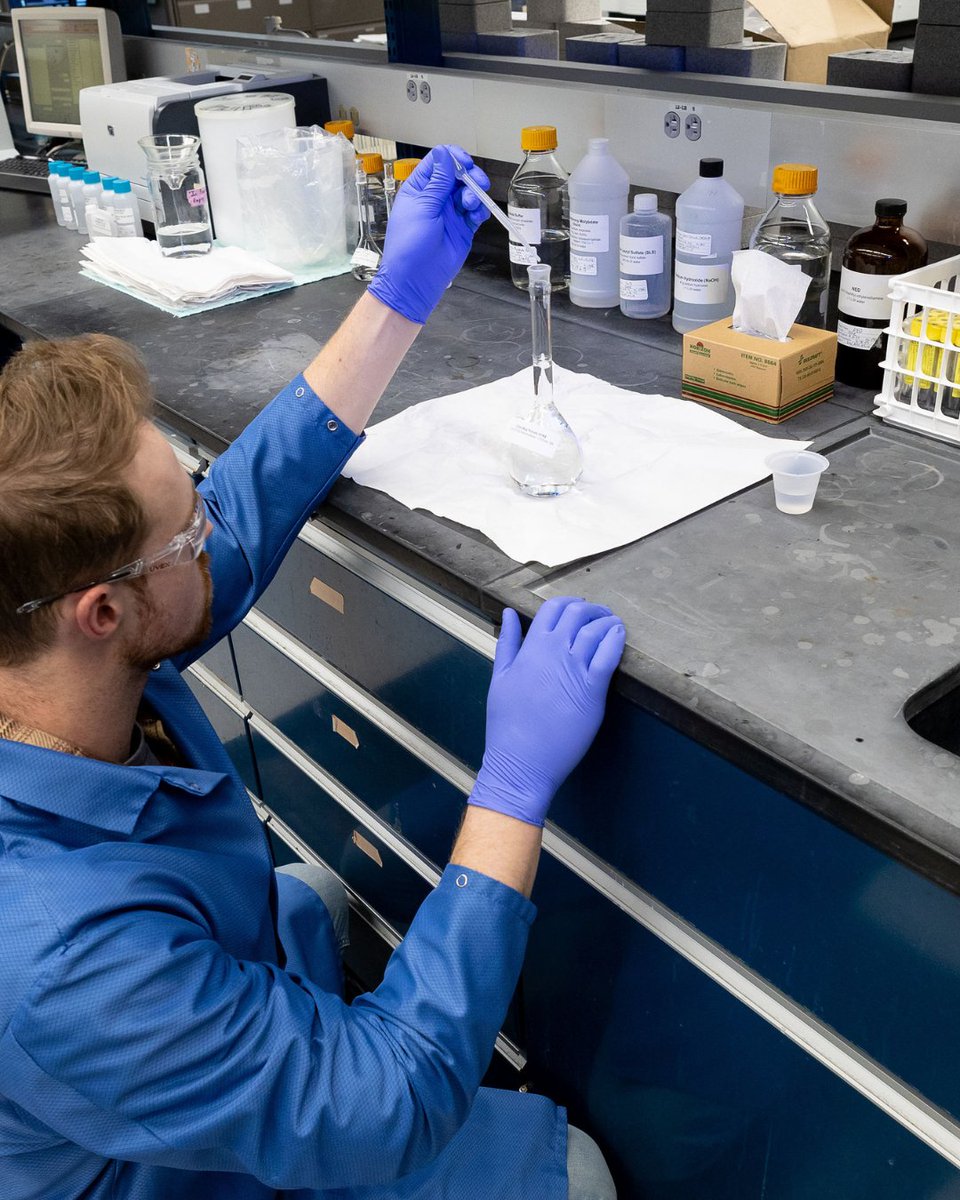
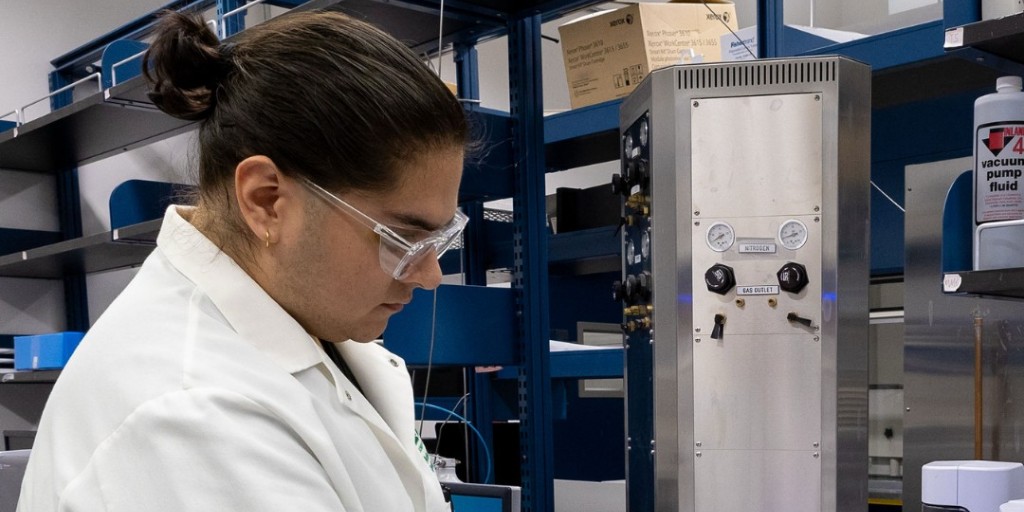
This is who you’re asking to analyze the Nation’s water. For over 40 years, the USGS National Water Quality Laboratory (NWQL) in Lakewood, Colorado has delivered the high‑quality data that power water science across the country. ⚗️ NWQL specializes in ultra‑sensitive chemical analyses of water, sediment, and tissue plus identification of aquatic invertebrates that can reveal ecosystem health. 💧 USGS scientists at NWQL process nearly 39,000 samples and produce about 1.8 million analysis results every year, supporting USGS science in every state and territory. 👩‍🔬 Behind the data is a diverse team of chemists, biologists, technicians, and support staff whose expertise keeps the Nation’s water‑quality information accurate, trustworthy, and cutting‑edge. Their work is recognized nationally and internationally. Celebrating the people behind the science during Public Service Recognition Week. Learn more about the NWQL - ow.ly/fCX850YUuz0 📷 1: USGS scientist documenting incoming water‑sample shipments at a processing station. 📷 2: USGS scientist adjusting instrumentation on an analyzer during a water‑quality testing procedure. 📷 3: USGS scientist loading vials into an analysis system at the National Water Quality Laboratory. 📷 4: USGS scientist preparing a volumetric flask solution for analysis using precise pipetting techniques. #PSRW2026 #WaterQuality #WaterChemistry
USGS Water Resources tweet mediaUSGS Water Resources tweet mediaUSGS Water Resources tweet mediaUSGS Water Resources tweet media
English
1
3
12
311
USGS Water Resources
USGS Water Resources@USGS_Water·
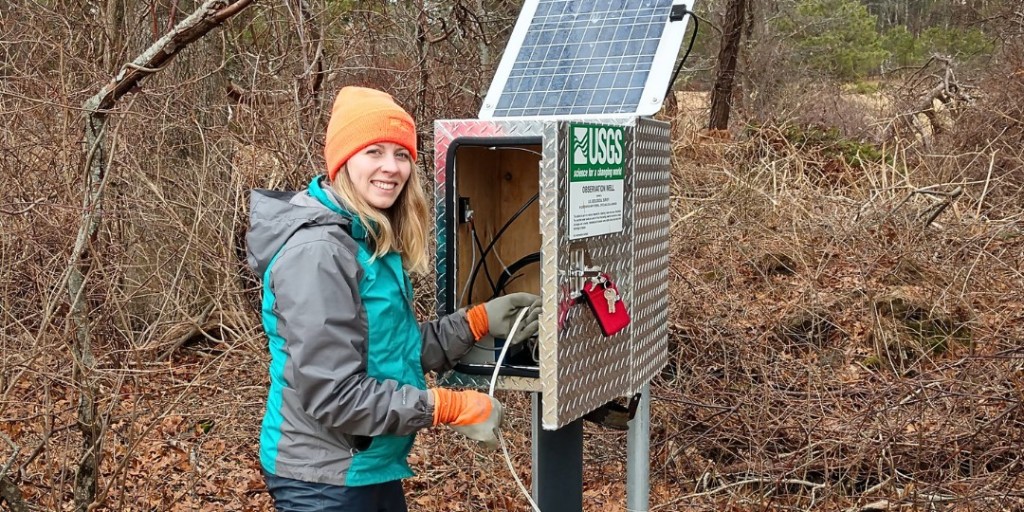
This is who you’re asking for water data. Whether you’re checking river conditions for a weekend float, engineering a bridge to withstand a 100-year flood, tracking groundwater levels, or managing a city's drinking water, USGS water science experts are behind the data. We are a dedicated team of hydrologists, technicians, and scientists on the ground (and in the water) collecting data that drive decisions that safeguard our economy, protect lives and property, and ensure the sustainable management of our nation's most vital resource. We take pride in serving the public through: 📍 Monitoring and collecting data at more than 16,000 monitoring locations across all 50 states, Puerto Rico, Guam, and the U.S. Virgin Islands 🛠️ Precision maintenance of national monitoring networks 🚧 Rapid response during flood events to ensure the collection of critical, real-time streamflow data Thank you to our USGS Water Team for your dedication to water science and the communities we serve. Explore USGS water data - dashboard.waterdata.usgs.gov 📷 1: USGS hydrologic technicians collect data and water samples from the Coeur d'Alene River, Idaho. Photo by Derek Kondratowicz, USGS 📷 2: A Hydrologic Technician stands in Kebo Brook after making a streamflow measurement and conducting training with staff from Acadia National Park. Photo by Nicholas Stasulis, USGS 📷 3: A Geoscientist-in-the-Park Guest Scientist for the National Park Service services a USGS groundwater well located within the Mill Creek basin near the Herring River in Wellfleet, Massachusetts. 📷 4: A USGS hydrographer makes an acoustic streamflow measurement from a cableway at streamgage 10308200, East Fork Carson River below Markleeville Creek, near Markleeville, CA. Photo by Bryce Redinger, USGS #FacesOfUSGS #PSRW2026 #WaterData
USGS Water Resources tweet mediaUSGS Water Resources tweet mediaUSGS Water Resources tweet mediaUSGS Water Resources tweet media
English
1
3
14
333
USGS Water Resources
USGS Water Resources@USGS_Water·
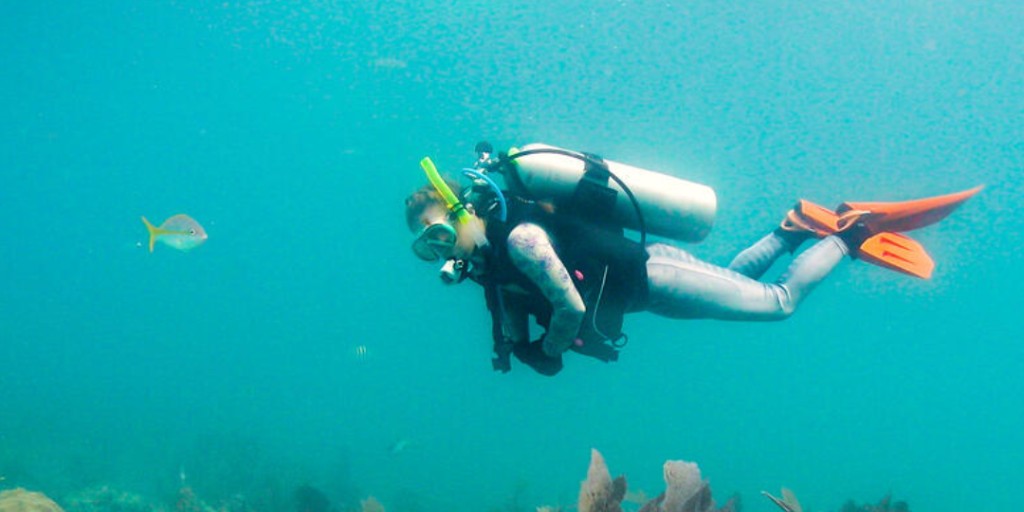
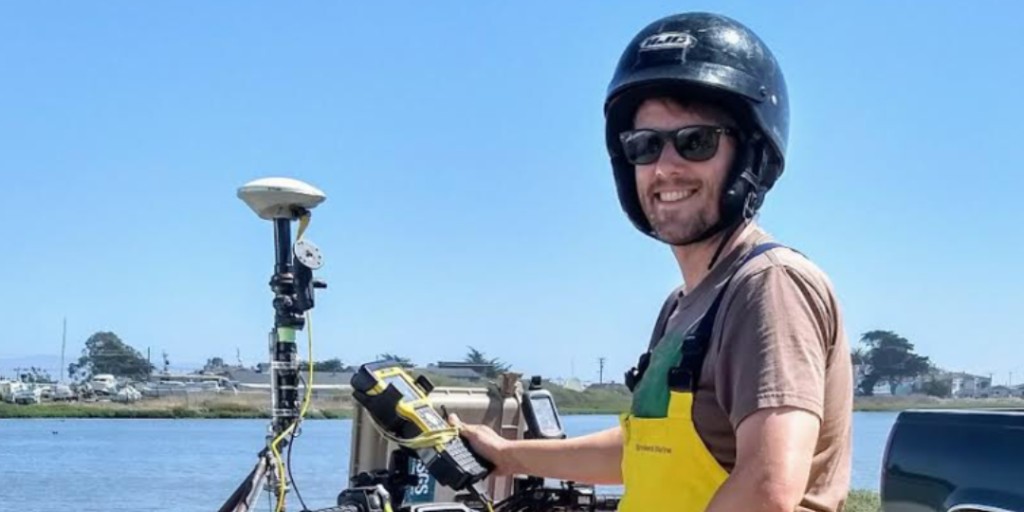
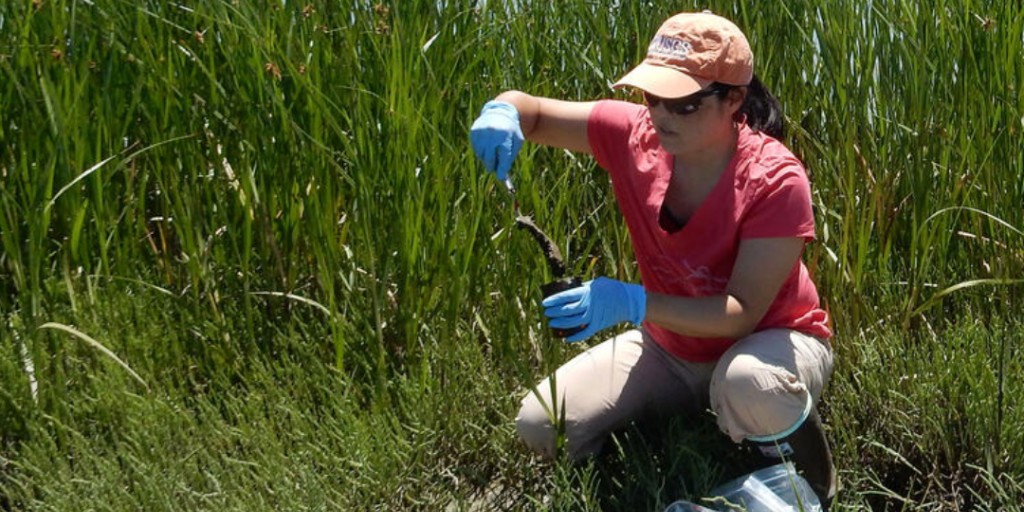
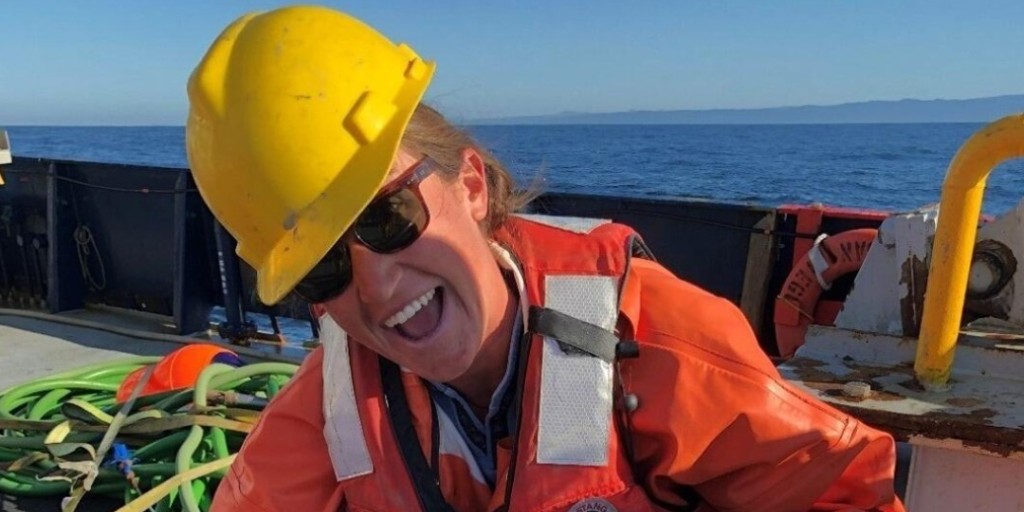
This is who you’re asking to measure shoreline dynamics. More than 120 million people – that's about 40% of the United States’ population – live in a county bordering an ocean or the Great Lakes. Living that close to the shore can be a bit risky: Powerful storms can generate surge, waves, and currents that can move large amounts of sediment; can destroy roads, buildings, and other critical infrastructure; and can alter natural habitats. That’s where our scientists come in! The USGS performs a range of studies that document, assess, and model coastal change, risk, and vulnerability. The USGS Coastal and Marine Hazards and Resources Program (CMHRP) supports preparedness, emergency response, and the protection of people and resources in coastal and ocean environments. The CMHRP work is centered around three major science centers to monitor shorelines coast-to-coast: 📍 The CMHRP Pacific Coastal and Marine Science Center in Santa Cruz, California 📍The CMHRP St. Petersburg Coastal and Marine Science Center in Florida 📍The CMHRP Woods Hole Coastal and Marine Science Center in Massachusetts Learn more about USGS coastal science - usgs.gov/programs/cmhrp 📷 1: USGS student contractor swimming over a coral reef during research surveys in Florida. Photo by Ilsa B. Kuffner, USGS. 📷 2: USGS oceanographer sits on an all-terrain vehicle with a precision GPS and other equipment to create a high-definition profile of the shoreline in California. Photo by Andrew Stevens, USGS. 📷 3: USGS marine geochemist collects a sample of exposed mud in a marsh near Sonoma Creek, California, to understand effects of wildfire on coastal wildlife. Photo by Leticia Hallas, USGS. 📷 4: USGS research geologist on board the Marine Vessel Bold Horizon with a piston core sample collected offshore of northern California/southern Oregon to help characterize marine geohazards like tsunamis and earthquakes. Photo by Jenna Hill, USGS. #PSRW2026 #Hazards #MarineScience
USGS Water Resources tweet mediaUSGS Water Resources tweet mediaUSGS Water Resources tweet mediaUSGS Water Resources tweet media
English
0
1
10
211
USGS Water Resources
USGS Water Resources@USGS_Water·
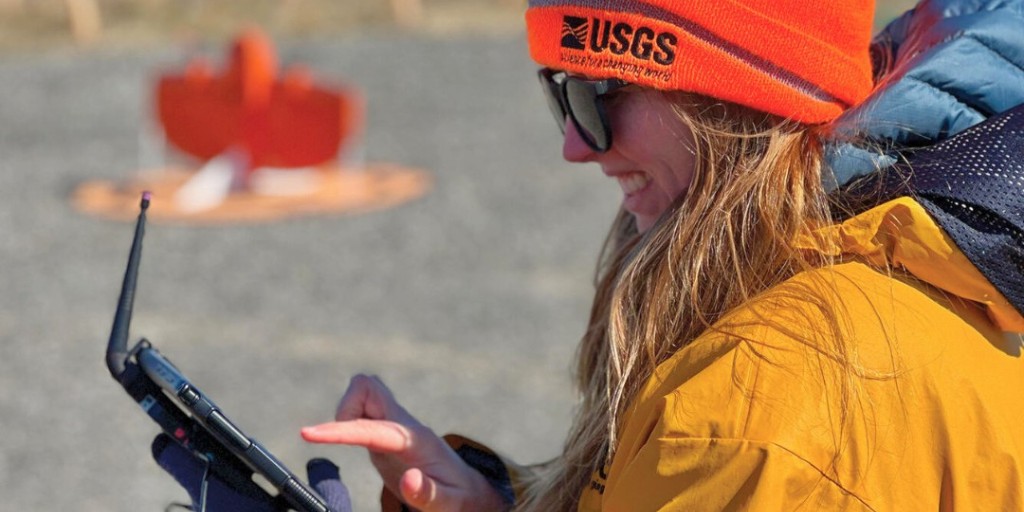
This is who you’re asking to watch America’s waters. Join us to celebrate Public Service Recognition week as we show you the faces behind all the amazing water science that we do here at USGS Water. 🗓️ Monday – we'll dive into how USGS scientists monitor and measure our nation’s shorelines on both coasts. 🗓️ Tuesday – take a look at the folks behind all the near real-time data that we deliver. 🗓️ Wednesday – come along with us as show you some of the work that we do to monitor water quality across the U.S. 🗓️ Thursday – meet some of the scientists maintaining USGS’s role as a leader in water monitoring technology. 🗓️ Friday – wrap up the week while we introduce you to some of the crews that respond to flooding events. Want to dive in the ocean to map the seabed or fly water monitoring drones in remote areas? Share with us in the comments what your dream water-related job would be! 📷 1: USGS ocean engineer and oceanographer make adjustments to a computer controlling two video cameras on the roof of the Dream Inn, a hotel overlooking Monterey Bay in California. Photo by Shawn Harrison, USGS. 📷 2: USGS Hydrologic Technician performing a vertical profile and routine maintenance on continuous water quality monitors on the Norwalk River at Maritime Aquarium Near Southern Norwalk, CT. Photo by Samantha Robinson, USGS. 📷 3: USGS scientist preparing samples for water quality analysis at the National Water Quality Laboratory, Colorado. 📷 4: USGS scientists demonstrating water monitoring technology at the Hydrologic Instrumentation Facility in Alabama. #FederalService #WaterScience #ThisIsWhoYoureAsking #PSRW2026
USGS Water Resources tweet mediaUSGS Water Resources tweet mediaUSGS Water Resources tweet mediaUSGS Water Resources tweet media
English
0
2
12
236
USGS Water Resources
USGS Water Resources@USGS_Water·
From 19th-century pen and paper to 21st-century innovative technology, this gage's history has it all! 📜➡️📱 One of five gages operated by USGS on Lake Champlain, the gage at Rouses Point, New York, has monitored the Richelieu River, the sole outlet of Lake Champlain, since March 1871. 🗓️ Historic highlight - Flood events of 2011 💠 May 4, 1869: Previous record high of 102.1 feet set 💠 April 13, 2011: Lake Champlain reached flood stage, remaining above this level for 67 days! 💠 May 6, 2011: New record set, with the lake cresting at 103.20 feet above mean sea level. With over 150 years of daily data, this monitoring location provides long-term hydrological insights and is crucial for assessing the impact of high-water levels on both New York and Canadian communities. Operated in cooperation with the International Joint Commission, it doesn't just look back, it powers current scientific research, flood management, emergency response, and infrastructure planning. 🌊✨ 📈 Explore the data - waterdata.usgs.gov/monitoring-loc… 📷 1 & 2: In 1938, the USGS modernized the Rouses Point, New York, monitoring location on Lake Champlain by building a new gage house. 📷 3: Gage during the period of record flood event in May 2011. 📷 4: The flood-hardened gage in May 2014. #LakeChamplain #WaterData #FieldPhotoFriday
USGS Water Resources tweet mediaUSGS Water Resources tweet mediaUSGS Water Resources tweet mediaUSGS Water Resources tweet media
English
0
2
9
230