Sabitlenmiş Tweet
0xTrader
6.1K posts

Yes, high risk high reward bet on polymarket. War is a simulation and half of it is poker. Hormuz is my last target for a big(10x) return.
0xTrader@UpXlong
Silently this war will end and hurmoz will be opened at background. There is no other scenario. Simulation is working perfectly. My bet is still valid. Risk reward ratio is very high.
English

My bet is still open, Iran will change mouth soon, second part of bet will work exactly like expected. Mission is wti crude oil below $80!
0xTrader@UpXlong
I betted on a ceasefire from USA till March 31. Everything is against me right now. Risk reward ratio is very high. I will keep it till last minute. I created my own war simulation. Let's see if it works..
English

A newly created wallet named "kynbz" spent $18.7K betting on "US x Iran ceasefire by March 31 or April 15" 9 hours ago.
polymarket.com/0x91710b66a05f…

English

*TASNIM: HORMUZ WON'T RETURN TO PRE-WAR STATE THROUGH PSYOPS
English

ISRAEL MILITARY SPOKESMAN: WE EXPECT 'WEEKS' MORE OF FIGHTING AGAINST IRAN AND HEZBOLLAH
English
@FirstSquawk So only solution is attack twice with a time lag. I mean first attack must be from somewhere else, then second in Israel. This brings odds to 99% probability which is already perfect. Otherwise, I think it will drop to 70-80% in the future.
English

ISRAEL SAYS OVER 90% MISSILES INTERCEPTED, ACKNOWLEDGES AIR DEFENCE NOT FULLY FOOLPROOF
English

DENMARK WAS READY TO BLOW UP AIRFIELDS TO STOP A U.S. INVASION OF GREENLAND
English
US REJECTED PUTIN OFFER FOR IRAN, UKRAINE QUID PRO QUO: POLTICO
English
@Bones_Trader777 @astronomer_zero If it can hold it, up move can continue.
English


$BTC
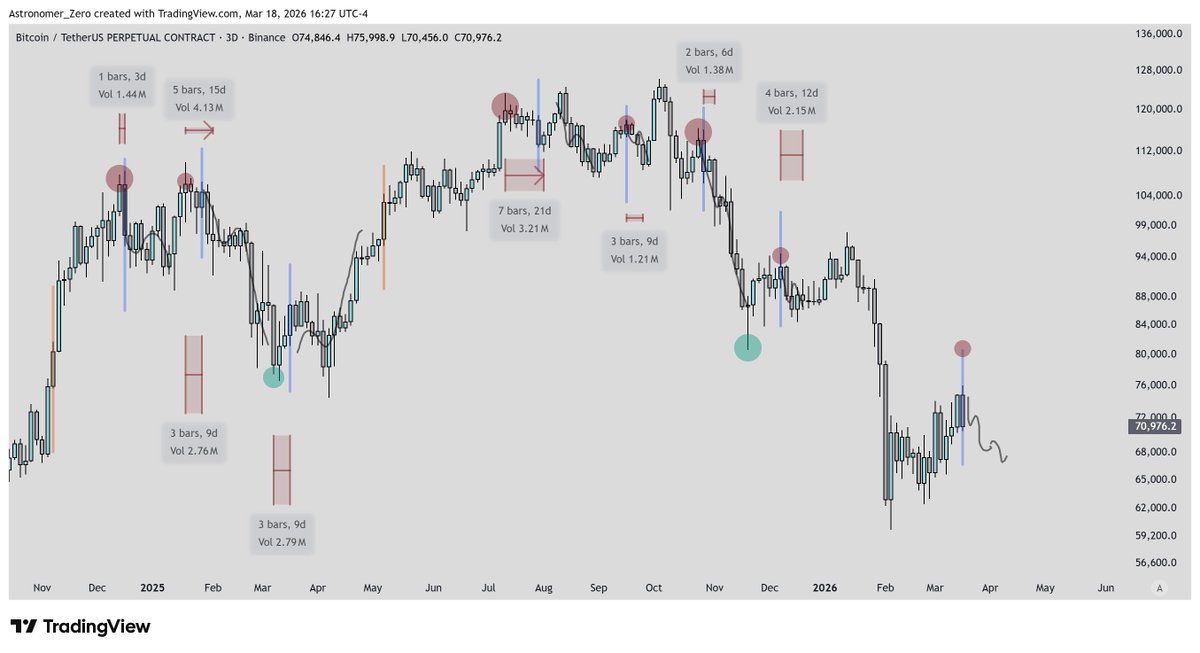
The FOMC reversal doing its work once again. Still simply waiting before longing again.
The edge I have been showing to you for a long time, and which has spread around everywhere, last lengthy post on it was indeed one of my most viewed post I ever created.
But because no one really takes action on the calls going around, I am not concerned of people taking my edge and it spreading because the edge isn't used properly and money isn't gained from it.
The result: the reversal simply worked out again. From uptrend to downtrend, with the top appearing before the FOMC reversal.
Why does this reversal happen? What are the mechanics? I explained them many times before. But in short: it is to make everyone excited and trick them into thinking FOMC will be bullish, because price is going up, right? And because the announcement is always dubious, it can be interpreted and will be interpreted into the direction price goes, every time. This happens with every type of high impact news event btw. But because during FOMC, there is a lot of speech, it is the easiest event for price to be manipulated around.
Then, once FOMC takes place, price already reversed, almost every time and keeps going for a while.
That is why I am waiting to long again, and our 76k key level remains the point of resistance until it is resolved.
It also created a range deviation, which means midrange, i.e. our 65k target is still coming potentially, which is where I would want to long next.
Do keep in mind that time is more important than price, and so if price stalls and ranges before, there's no need to wait for 65k.
The blind don't get rewarded. Only the smart do.
So I generally plan to wait for midrange, but if we stall before and draw out time, I am happy to long earlier, after the duration FOMC reversals to the downside typically take, has passed.
Ah yes, and final note, because it always comes up in the comments: "so you are bearish Astro".
I don't know how to make it any more clear, but every high timeframe post I created has been bullish since the start of this range, because I believe it will break to the upside. Timing is key however, and the time is not "Today", yet.
Astronomer@astronomer_zero
$BTC There is an 87.5% chance $BTC has bottomed For the ones who have been following me for a while, know this analysis already. But given that it's one of those days where $BTC is slightly red on the day, and everyone (literally) is putting out their posts that they expect lower, all saw this move down coming, even pulling up some old quotes where they vaguely called the top, lower their targets, or we simply see large cynicism without much content, I figured I'd continue my lone bull stance as we have come across another confluence, on top of all the confluences we have already given as to why I believe $BTC has bottomed, and won't hit the low 70's, let alone the 60's or 50's. In fact, we openly and in live time entered fully long "against all odds" and against the majority on this platform. Aim is to freshen up the timeline, give some hope, because yes it's easy from a successful traders standpoint to act cool on social media and write a few forced posts that don't mean all that much and just attempt to make it look like someone called something where that behavior only shows the opposite. It's harder to actually help people out and give them conviction with a type of analysis that historically outperforms the results of what even paid groups offer these days, here for free. Will keep this slightly shorter since you will find this type of analysis in the past under my name (keywords: FOMC reversal analysis astronomer), but followers doubled since last time so a quick recap never hurts. The analysis The analysis is quite simple, yet powerful. All it requires is flip on a daily (or 2 daily in my case to keep the chart clean) timeframe, plot out all the dates FOMC meeting appeared, and see what price did. This shows that indeed price tends to reverse when time is nearing into FOMC. The caveat is that the price reverses before or at the very latest, right at the FOMC day. That's exactly why it works so well. People usually expect a reversal after FOMC (due to the "news" it brings). Yet we know the market is forward pricing, hence why it catches the majority off guard. Works almost every time, 14 out of 16 times in fact (or 87.5% of the time), but data goes much further (I like to keep it recent for purposes of balancing up-to-date-criticism and sample size). And the time difference the bottom happens versus the FOMC day, is usually 0 to 5 2D bars before the exact date, as shown on the chart. Given the next FOMC is the 19th of March, that means the low is in the latest that day and the earliest the 5th of March. We're right in the middle of that timeframe. And because we hit major high timeframe levels from my end on the high timeframe (see $BTC macro analyses), because cyclical analysis expects a low shortly (any day now) both on the daily and weekly, and because a 0 bar difference i.e. a reversal on FOMC itself is rare, the chances only increase that the low is in. Sentiment wise, fear is peaking to hilarious levels. Even "Reputable" traders are protecting their reputation with some random cautionary posts out of nowhere. I don't blame anyone's methods, but I take it as a great sign of a bottom. Personally, I prefer just looking at the data, act on it as ideally as possible, with high conviction whether I end up winning or losing. NFA.
English
IRAN’S SUPREME LEADER SURVIVED STRIKE BY MINUTES
Mojtaba Khamenei narrowly survived U.S. and Israeli missile strikes that hit his residence in Tehran after stepping outside moments before the attack, according to leaked audio reported by The Telegraph.
The strikes — which killed his father Ali Khamenei and several senior Iranian officials — hit the compound on Feb. 28 with multiple missiles. Mojtaba Khamenei was wounded in the leg, while his wife and son were killed.
The recording, attributed to an official in the former leader’s office, says the attack targeted several locations in the complex and appeared aimed at eliminating the entire leadership.
English