
Visual Studio Debugger retweetledi

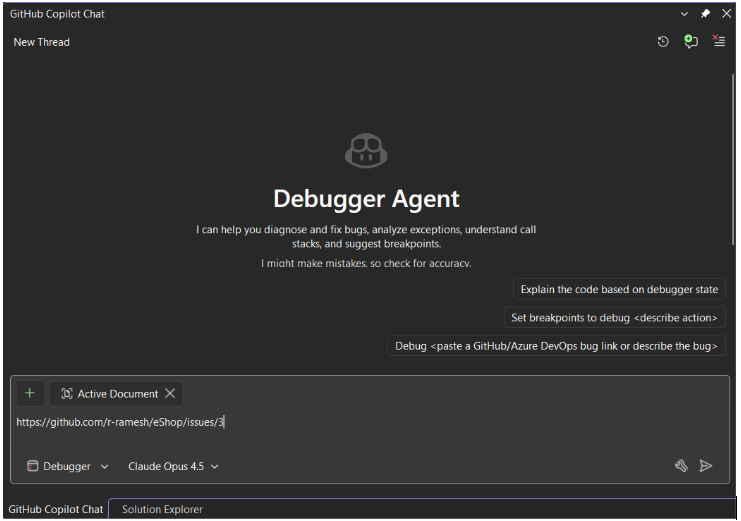
Debugging isn’t just about fixing code; it’s about reducing uncertainty. We’re taking a massive leap toward solving that problem by introducing a new, upgraded, guided workflow within our existing Debugger Agent in Visual Studio.
Mark Downie lays it out for us... buff.ly/9s962D2

English