Eric from the netherlands

2.7K posts

Eric from the netherlands

Eric from the netherlands

@ValueEric

Started investing in november 2020: Profit nov 2020- dec 2021: 245% 2022: 47% 2023: 42% 2024: 17% 2025: 54% Ambition to become a full time investor.

Netherlands Katılım Mayıs 2021
1.7K Takip Edilen1.7K Takipçiler
Sabitlenmiş Tweet
Eric from the netherlands
Eric from the netherlands@ValueEric·
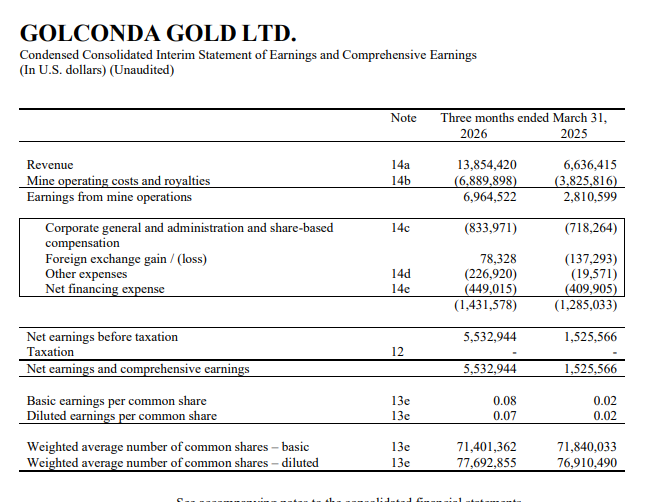
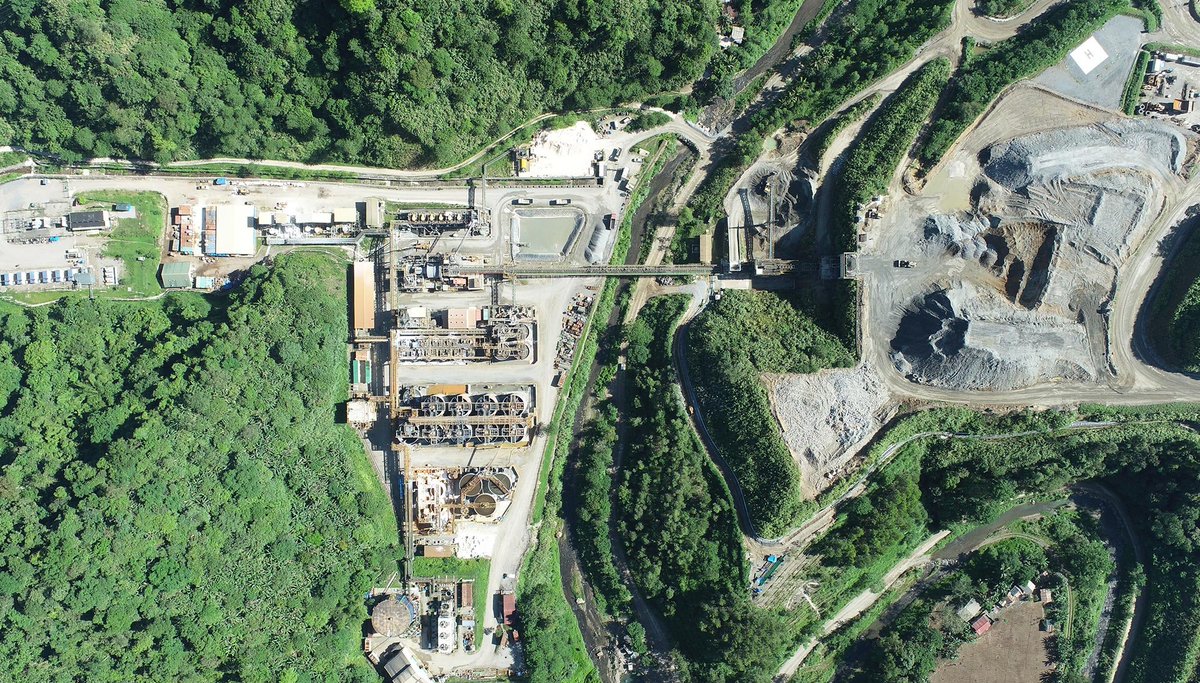
$GG.V Valuation: Galaxy: 175M (10 * net profit 2026, so without value for extra growth) Summit: NPV at spot prices * 50% = 60M Minus: net current assets = -/- 12M Total: 220M USD = 300M CAD = SP 4,18 SP now (+457% potential) Made it my biggest position! Thanks @Premski_SGP!
English

7
5
21
9.6K
Eric from the netherlands retweetledi
🏴‍☠️
🏴‍☠️@calvinfroedge·
$GG.V up 16% today in Canada as they ended Q1 debt free Revenue doubled vs the previous year Earnings quadrupled More to come as production ramp continues This was one of my highest conviction mining picks
🏴‍☠️ tweet media
English
8
5
97
7.6K
Eric from the netherlands retweetledi
Fred Kosters
Fred Kosters@FredKosters·
$PGLD.v - The production increase to 150 koz of gold and 40-50M pounds of copper per year will reduce unit costs (AISC per ounce). When the PEA was released in October 2025, the AISC at Oct. spot prices landed at 1,509/oz on a by-product basis (net of copper credits). This number should come down due to higher gold production and higher Cu credits. In a 1,200 AISC and 4.5k gold scenario, $PGLD.v achieves a staggering annual AISC margin of USD 495M = CAD 677M vs. a fully-diluted market cap of only CAD 273M. The AISC margin will be even higher in the first two years due to an increased mill throughput of 14 mtpa.
Mikael W@MikaelWi1

Excellent news from P2Gold #PGLD Increasing throughput to 12-14 Mtpa. Year 1 and 2 they will operate at 14Mtpa, implement mill year 3. Upcoming FS will be a monster! newswire.ca/news-releases/…

English
2
6
42
5K
Eric from the netherlands retweetledi
IFCM MicroCap
IFCM MicroCap@IntelligentCM·
Good update with Golconda Gold $GG $GGGOF $130m market cap/EV Should do $30m USD EBITDA @ $4300 Au NCIB should start May/June In this valuation investors also get the US asset spinoff late 2026/Early 2027 likely worth another $200m+ for free Disc: long youtu.be/oFDSWpotE2g?si…
YouTube video
YouTube
English
0
2
9
2.4K
Eric from the netherlands retweetledi
Antonio (Resource Talks)
Antonio (Resource Talks)@ResourceTalks·
When gold is at record highs and the balance sheet is full, the pressure on a producing company to do something with the money is big. I even see it on here. Investors want growth. Bankers want to finance something. The board wants a legacy project. The CEO wants a bigger company. Etc etc. All of those incentives mean more spend, and none of them are specifically asking whether the spending will generate a return for the shareholder sitting on the other end of the share register. A bull market does not make every deployment of capital sensible. It makes every deployment of capital feel sensible, which is a meaningfully different thing. Ask management to explain how they're dealing with the bull market, beacuse it's not the MO for most of the operators. Most of them spend their lives in bear markets and running a company during a bull market (and spending efficiently during one) is not the same. A company that deploys bull market cash flow into high-return, and make-sense expansion is compounding returns. A company that deploys it into acquisitions, corporate overhead, and projects that only work at spot (or 5X spot) is spending your upside on their ambition. Those two companies look similar in a rising market and very different in a flat one. Ask & dig. I did, in my recent interview with @GolcondaGoldLtd $GG.V. The CEOs answer is in the clip below. The full interview is on YT and wherever you get your podcasts.
English
0
2
17
3K
Eric from the netherlands
Eric from the netherlands@ValueEric·
$WGR.AX Western Gold Resources, why this is my biggest position @1975eric/note/p-189245921?utm_source=notes-share-action&r=sezru" target="_blank" rel="nofollow noopener">substack.com/@1975eric/note…
English
3
2
17
2.4K
Eric from the netherlands retweetledi
Iñigo Ezponda
Iñigo Ezponda@inigoezponda·
$MTL.L Another stock currently in my watchlist (not buying yet but in some months I will be buying it probably) for my family portfolio. Metals Exploration PLC, trading in London , currently maintains a Market Capitalization of $520 million USD, supported by a cash position of $60 million USD, resulting in an Enterprise Value of $460 million USD. The investment profile is defined by a critical transition from a depleting asset to a fully permitted development project. INVESTMENT CASE: The legacy Runruno Gold Project in the Philippines will reach the end of its useful operational life in 2026. The terminal production modeling for Runruno assumes a processing throughput of 5,000 tonnes per day (TPD) operating at a 92% availability factor, processing 1,679,000 tonnes annually. Applying an average ore grade of 1.45 grams per tonne (g/t) yields 78,250 contained ounces. With the existing BIOX circuit achieving an 81% recovery rate, final recovered production is calculated at 63,382 ounces for 2026. Upon the exhaustion of this ore body at the end of 2026, the Philippine operations will cease to contribute to the corporate cash flow. To replace the depleting Runruno asset, $MTL.L are pivoting entirely to the La India project in Nicaragua, with initial production scheduled for 2027. This acquisition fundamentally alters the operational scale and resource longevity of the company. The production methodology for La India is modeled on a processing throughput of 4,000 TPD operating at a 93% availability factor, resulting in 1,357,800 tonnes processed per annum. The targeted ore sequence features a robust average grade of 3.6 g/t, generating 157,155 contained ounces annually. Utilizing standard carbon-in-leach (CIL) processing, the metallurgical recovery rate is established at 92.2%. Multiplying the contained ounces by this recovery percentage yields a stabilized recovered production volume of 145,000 ounces per annum. This structural upgrade eliminates the prior single-asset depletion risk and introduces a verified Life of Mine (LOM) of 12.4 years in the study. Furthermore, the expansion potential there is massive, lot of targets to discover and expand. 12.4 years is the mine-life of the study but there are a lot more resources to be included into reserves and to be mined. The financial mechanics of the transition rely on deploying the $60 million USD cash position alongside the terminal free cash flow from the Philippines to internally fund the Nicaraguan build-out without triggering shareholder dilution. The initial CAPEX requirement for La India is quantified at $165 million. By combining existing net cash reserves with the final 2026 operational margins from Runruno, the company possesses the balance sheet capacity to execute construction. The core efficiency metric for the 2027 La India operation is an optimized All-In Sustaining Cost (AISC) of $1,176 per ounce (the one of the study, at current prices is going to be more in the range of 1600$, take that into account). Applying a current gold price assumption of $4,500 per ounce, the asset generates a forward AISC margin of $3,324 per ounce. Multiplying this per-ounce margin by the annualized production volume of 145,000 ounces equates to a projected annual AISC Margin of $481.9 million starting in 2027. VALUATION: When measured against the projected 2027 Nicaraguan AISC margin of $481.9 million, the current Market Capitalization of $520 million USD dictates that the company is trading at a forward Market Cap to AISC Margin multiple of 1.07x. Equity valuation models dictate that an unhedged, fully funded producer with a +12-year LOM and an annual margin approaching half a billion dollars should structurally trade at a multiple of 3.0x to 4.0x its annualized margin. Applying a conservative 3.0x multiple to the projected $481.9 million margin yields an implied target Market Capitalization of $1.44 billion. Utilizing a 4.0x multiple expands the target capitalization to $1.92 billion. The current $520 million valuation mathematically reflects a legacy discount assigned to the dying Runruno asset, failing to fully price in the step-by-step margin generation of the Nicaraguan production profile launching in 2027. 3x AISC margin multiple gives us an almost 200% upside from this point without any increases in gold price. Of course I assumed here a smooth ramp up, this is essential for the rerate.
Iñigo Ezponda tweet mediaIñigo Ezponda tweet media
English
0
3
17
2K
Eric from the netherlands retweetledi
O B
O B@OriginalBraila·
Excellent numbers and progress from $MKO.v $MAKO in the US. juniorminingnetwork.com/junior-miner-n… The draft Environmental and Social Impact Assessment has been submitted to the Guyana Environmental Protection Agency, and the Company will commence construction at Mt. Hamilton in Nevada over the course of the next few weeks. Mako is currently debt free with a cash position of US $96.1 million and generating a significant amount of cash from its 2 operating assets. These financial resources are currently more than sufficient to complete the development of both of the Company's development assets."
English
4
13
97
7.6K
Eric from the netherlands retweetledi
Iñigo Ezponda
Iñigo Ezponda@inigoezponda·
Analyzing the Troilus Mining project ( $TLG and $TLG.TO) in Quebec, Canada, a Tier-1 mining jurisdiction with a massive existing brownfield infrastructure advantage. One of the cheapest large developers in Canada. The investment case is empirically based on the May 2024 Feasibility Study data, updated late-2025 corporate disclosures, and evaluated under gold price environments reaching up to $5,000 per ounce. The case relies strictly on quantitative metrics, isolating the margin effect and development stage to visualize the extreme operational leverage this asset holds against its current equity pricing. Key Metrics & Valuation Disconnect The underlying foundation consists of Probable Mineral Reserves totaling 380 million tonnes (Mt) containing 7.26 million ounces of gold equivalent (Moz AuEq) at an average grade of 0.59 g/t AuEq (0.49 g/t Au, 0.058% Cu, 1.0 g/t Ag). The current Market Cap sits at approximately US$640 million, with an Enterprise Value (EV) of roughly US$717 million. When evaluating the LOM average annual production of 303,000 AuEq ounces over a robust 22-year Life of Mine (LOM), the valuation disconnect becomes immediately apparent. The initial CAPEX required for construction is US$1.074 billion, backed by an incredibly low Life of Mine Total Sustaining Capital of just US$276.6 million over the 22-year period. Total operating cost per tonne of ore is modeled at US$19.06/t, resulting in a highly competitive All-in Sustaining Cost (AISC) of US$1,109 per ounce. Economic Studies, Free Cash Flow & NPV Sensitivity The Feasibility Study anchors its economic metrics on a highly conservative base price of US$1,975 per ounce, yielding an after-tax NPV5% of US$884 million, a 14% after-tax IRR, and cumulative Free Cash Flow (FCF) of US$2.2 billion. However, NPV and FCF sensitivity to the underlying asset's price reveals massive operational leverage. At spot prices, cumulative FCF over the mine's life is estimated to exceed US$3.4 billion, generating over US$200 million in average annual FCF. More critically, during the core production years (Years 3 to 8), free cash flow generation surges to US$300 to US$400 million annually. Executing a direct linear extrapolation toward a US$4,500/oz macro scenario, the company's net present value would comfortably exceed US$5 billion. Crucially, this valuation is based on a 22-year mine life that incorporates only the 7.26 million AuEq ounces of Probable Reserves representing just over 55% of the company's total ~13 million AuEq ounce global resource. When factoring in this massive un-mined resource inventory, the implied Price-to-NAV (P/NAV) multiple indicates that the current market pricing represents barely 10% to 12% of the company's theoretical fundamental value, severely discounting both the spot price margin and the asset's multi-decade reserve replacement potential. Operational Mechanics: Throughput, Grades, and Recovery The steady production profile is dictated by a large-scale processing design of 50,000 tonnes per day (TPD). Operating 365 days a year, the facility will process 18.25 million tonnes of ore annually. Applying the Probable Reserve grade of 0.59 g/t AuEq and factoring in a blended metallurgical recovery averaging 87.5% across the primary pits (Z87, J, X22), the production capacity is mathematically locked. Processing 18.25 million tonnes at 0.59 g/t AuEq yields roughly 346,182 mined ounces per year, which, post-recovery, translates directly to the 303,000 payable AuEq ounces per year guidance. Potential Annual AISC Margins & Dilution-Adjusted Valuation Upside Applying escalated gold price assumptions fundamentally alters the capital structure logic. At US$4,000 per ounce, the absolute net margin is US$875.9 million annually. At US$5,000 per ounce, the margin expands to US$1.17 billion annually. Isolating a US$4,500 per ounce gold price environment, the net margin sits at US$3,391 per ounce. Multiplied by the 303,000 AuEq annual production profile, $TLG and $TLG.TO generate a potential annual AISC margin of US$1.027 billion. In a Tier-1 Canadian jurisdiction, possessing a massive resource base and a 22-year permitted reserve life, a de-risked producing asset is easily valued at a 4x multiple of its annual AISC margin. Applying this 4x multiple to the US$1.027 billion annual margin establishes a theoretical target Market Cap of approximately US$4.11 billion. To accurately assess the upside against the current US$640 million Market Cap, we must account for the remaining development capital. The initial CAPEX is US$1.074 billion. With the US$1.0 billion senior debt facility in place, the remaining CAPEX shortfall is US$74 million. If the company raises this remaining US$74 million entirely through equity issuance at the current valuation, the fully diluted equity base (the post-money valuation baseline) becomes US$714 million usd. Comparing the US$4.11 billion target valuation against this fully diluted US$714 million equity base reveals an implied upside of 5.75x (a 475% return). Even factoring in maximum theoretical shareholder dilution to cover the final CAPEX delta, the operational leverage at $4,500 gold dwarfs the dilution impact. Exploration Potential The modeled 22-year LOM incorporates only the 7.26 Moz AuEq Probable Reserves, leaving the remaining ~45% of the global tonnage underlying the 435-square-kilometer Frotêt-Evans property outside of the current economic study. Recent drilling has demonstrated the deposit remains structurally open at depth and along multiple strikes. The vast resource inventory indicates an objectively high probability of expanding the mine plan, ensuring reserve replacement that could extend operations well beyond Year 22 without requiring additional plant expansions. Permitting, Financing, and Development Timeline Looking at the critical path to commercial production, the fundamental hurdle for any large-scale mining development is securing the initial capital expenditure without destroying shareholder value through hyper-dilution. Developers facing billion-dollar CAPEX walls routinely suffer massive valuation discounts because financing risk is the primary point of failure. For $TLG and $TLG.TO , this overarching financing risk is practically eliminated. The US$1.074 billion initial CAPEX is almost entirely accounted for. The company recently upsized its debt financing mandate to a US$1 billion senior debt facility, backed by a syndicate of European export credit agencies including Société Générale, KfW IPEX-Bank, and Export Development Canada. Complementing this, a massive C$172.5 million bought-deal public equity offering was closed in late 2025, fully funding the company through the basic engineering phase, eliminating near-term dilution risk, and validating commercial viability alongside an offtake Memorandum of Agreement with Aurubis AG. With financing risk effectively neutralized, valuation hinges solely on the execution timeline. The asset possesses a severe structural advantage due to its brownfield nature, leveraging over US$500 million in historical infrastructure, including a 50 MW electrical substation and historically authorized tailings capacity. This drastically lowers the environmental footprint and radically simplifies the Environmental and Social Impact Assessment (ESIA) barriers compared to a greenfield build. The development timeline is mapped sequentially: detailed engineering advancing through 2026, aligning perfectly with the targeted issuance of final construction permits and a Q1 2027 target for full-scale construction mobilization.
Iñigo Ezponda tweet mediaIñigo Ezponda tweet media
English
1
5
20
3.1K
Eric from the netherlands retweetledi
Fred Kosters
Fred Kosters@FredKosters·
$MKO.v (Mako Mining) is one of the cheapest gold producers on a forward EV/FCF basis. Current EV is 482M based on a fully diluted mcap of 560M and a YE ’25 net cash position incl. receivables of 78M (all numbers in USD). At 4.5k gold and depending on the production start and ramp-up speed of Mt. Hamilton and Eagle Mountain, Mako will generate 250-300M in total FCF in the next 3 years (2026-2028), assuming pre-production capex of 70M for Mt. Hamilton and 130M for Eagle Mountain. At the mid-point of this FCF range (275M), Mako’s EV will decrease from currently 482M to only 207M by YE 2028. With all 4 mines fully ramped-up, Mako’s annual FCF runrate as from YE 2028 will be 330M USD at 4.5k gold. That translates into a forward (YE 2028) EV/FCF multiple of only 0.6x. Or in other words: By YE 2028 Mako’s forward annual FCF yield is a whopping 1.6x its entire EV.
English
13
11
108
14.6K
Eric from the netherlands retweetledi
James Simmons FCILT | ESLog
James Simmons FCILT | ESLog@jsimmons_27·
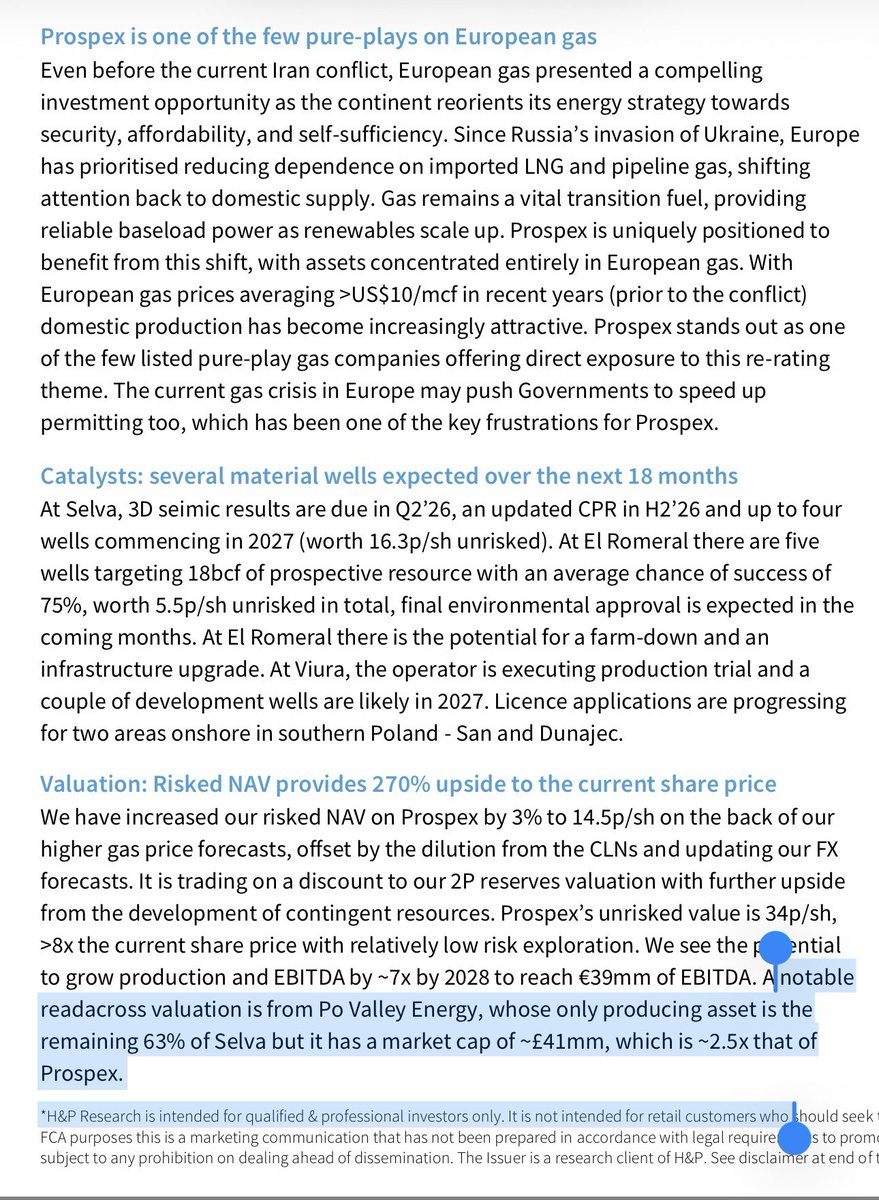
@ProspexEnergy #PXEN @energy_po valuation is X2.5 that of @ProspexEnergy Just shows what an utter disgrace the previous leadership was 👇 Likewise shows it’s trading at a massive discount Thank you Hannam & Partners for telling shareholders what we all knew Major Tom now in charge
James Simmons FCILT | ESLog tweet media
English
1
1
6
745
Eric from the netherlands retweetledi
James Simmons FCILT | ESLog
James Simmons FCILT | ESLog@jsimmons_27·
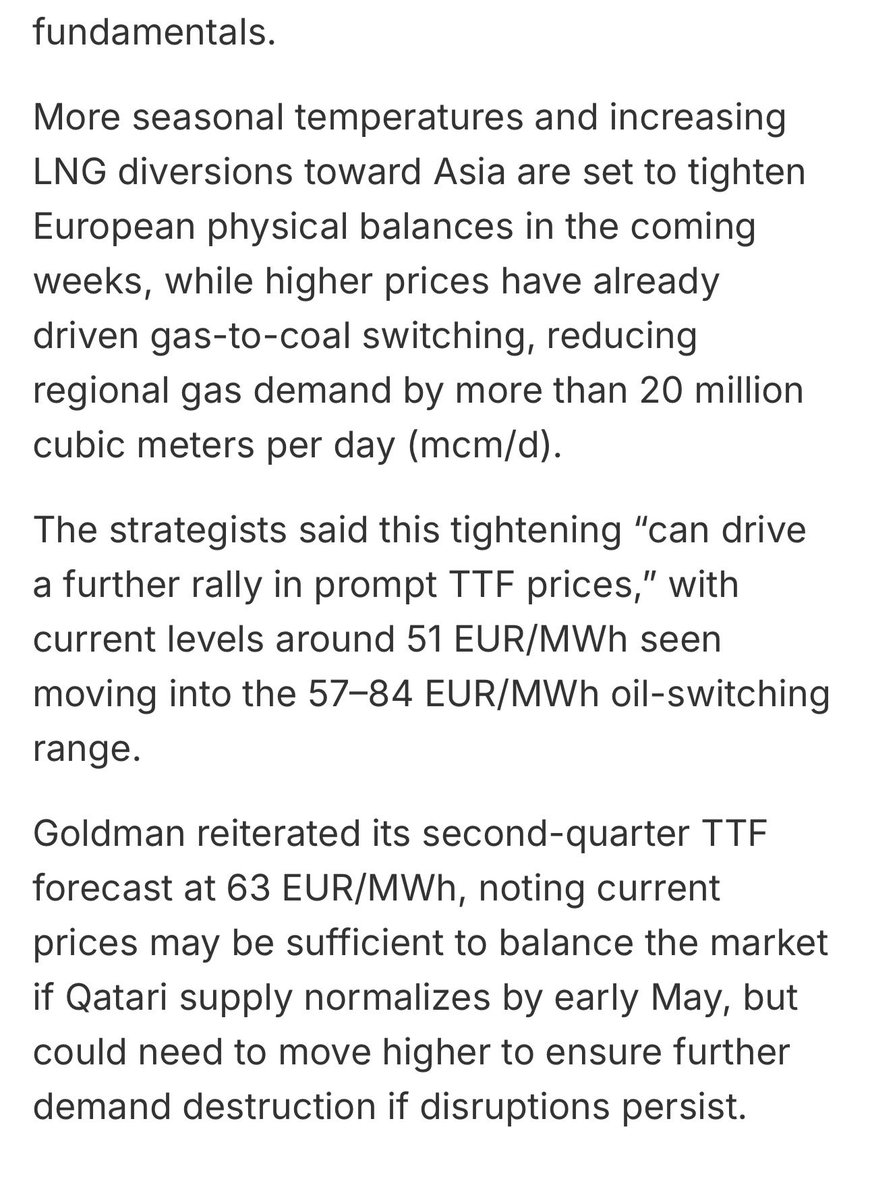
@MBdaytrading #PXEN TTF Q2 price tightening could see €57-€84 TTF pricing Producer & Developer of EU Gas Mcap just on production & reserves is many multiples from here Remember 40p H&P valuation based on €30 TTF
James Simmons FCILT | ESLog tweet media
English
1
2
5
1.1K
Eric from the netherlands retweetledi
Henrik
Henrik@Henrik115·
Market seem to not buy Asante Gold $ASE.v production outlook of 400k oz or see some other issue. I still believe they will get to that run rate of 100k oz per quarter sooner or later in H1-26. This company is valued at 1/3 of the lowest peer among 400k oz producers.
Henrik tweet media
English
10
2
32
5.5K
Eric from the netherlands retweetledi
Shanaka Anslem Perera ⚡
Shanaka Anslem Perera ⚡@shanaka86·
Oil is up 34.5 percent in a week. Gold is up 2.3 percent. That divergence is the single most important signal in global markets right now and almost nobody is reading it correctly. The consensus explanation is that dollar strength from oil driven inflation is capping gold. Energy costs denominated in dollars increase global dollar demand. Higher inflation delays Fed rate cuts. Gold rises on the war premium but falls on the rate repricing. Net result: modest gain while oil screams higher. Mechanically correct. Strategically incomplete. In every major oil shock driven by Middle Eastern conflict since 1973, gold’s response has followed a two phase pattern. Phase one: gold underperforms oil because the dollar strengthens on the same inflation that drives the oil surge. The correlation between oil and gold compresses from its crisis average of 0.6 to something lower. In the current war the correlation has run at roughly 0.4 since February 28. Phase two arrives when the market realizes the disruption is structural rather than transient. When the forward curve shifts from pricing a spike to pricing a plateau. When inflation is no longer a fear but a fact embedded in input costs and food prices. When central banks run out of room to hold rates steady against a supply shock they cannot fix with monetary tools. The dollar ceases to be a haven. The correlation snaps back. Gold reprices to match the structural reality that oil already priced. In 1973, oil quadrupled between October and March. Gold rose six percent during the embargo itself. Then gold rose 73 percent over the following twelve months as the structural inflation embedded. In 1990, oil doubled during the Kuwait invasion. Gold rose six percent during the crisis. Then gold held its gains while oil collapsed when the war ended in weeks. The difference between 1973 and 1990 is duration. The embargo lasted months. The Gulf War lasted weeks. Gold’s phase two only detonates when the market accepts that the disruption is not transient. Now apply the mechanism test. Hormuz is closed not by Iranian gunboats but by the withdrawal of commercial reinsurance. Reinsurance returns on actuarial timelines, not political ones. The DFC backstop covers six percent of the exposure gap. The ships have not moved. Futures are pricing 30 to 60 day resolution. The mechanism says months. If the mechanism is right and the market is wrong about duration, gold is currently in phase one of a 1973 pattern, not a 1990 pattern. The 2.3 percent gain is not gold failing as a hedge. It is gold waiting for the market to catch up to the mechanism. Goldman Sachs has a year end target of $6,300 set before the war. If the Hormuz closure persists beyond 90 days, that target is conservative. The oil chart says the supply shock is real. The gold chart says the market believes it is temporary. One of them is wrong. The reinsurance mechanism says it is gold that has not yet priced reality. The lag is the trade. open.substack.com/pub/shanakaans…
Shanaka Anslem Perera ⚡ tweet media
Shanaka Anslem Perera ⚡@shanaka86

US oil just posted its largest weekly gain since records began in 1982. Up 34.5 percent in five trading sessions. WTI blew through $92 a barrel on Thursday, adding twelve dollars in nine hours. What the market is calling a short squeeze is actually a price discovery event for a world that just lost twenty percent of its petroleum supply and has no mechanism to get it back on the timeline traders are pricing. The airline index tells the story the oil chart only implies. US carrier stocks are down 22 percent from last month’s highs. Bear market territory in eight trading days. Deutsche Bank published a note comparing current jet fuel crack spreads to the 2005 hurricane spike that bankrupted Delta and Northwest Airlines. The crack spread sits between $85 and $95 a barrel. Deutsche Bank’s warning was specific: absent near term relief, airlines around the world could be forced to ground thousands of aircraft. The Dow dropped 1,500 points this week. Goldman Sachs estimates a sustained move to $100 oil would slow global growth by 0.4 percentage points and add half a point to a full point of inflation worldwide. The Federal Reserve meets on March 18 with an impossible mandate: energy driven inflation demanding tighter policy while a growth shock demands looser policy. There is no rate decision that is correct in both dimensions simultaneously. Here is the part the price action has not absorbed. This is not 1973. In 1973 the oil embargo was a political act reversed by a political decision. This is not 1990. In 1990 the supply disruption was ended by military force. In 2026 the supply disruption was caused by the withdrawal of commercial reinsurance from the Strait of Hormuz, and reinsurance withdrawal does not respond to political declarations or military demonstrations. Seven P&I clubs cancelled war risk coverage effective March 5. The DFC announced a $20 billion backstop on March 6. JPMorgan estimates the actual exposure gap at $352 billion. The backstop covers less than six percent of the insured value at risk. The ships have not moved. Oil futures are pricing a 30 to 60 day resolution. The reinsurance mechanism requires months of verified safe maritime conditions, actuarial recalculation under a new geopolitical baseline, and sufficient aggregate capitalization before underwriters will restore Gulf coverage at commercially viable rates. The gap between the market implied timeline and the mechanism implied timeline is the most significant positioning opportunity currently visible across asset classes. The 34.5 percent weekly gain is not the shock. The shock is that the gain reflects the market beginning to understand the mechanism but not yet pricing its full duration. Every prior energy disruption in modern history was resolved by either a political reversal or a military operation. This one requires the rebuilding of a financial architecture that seven letters from seven insurance offices in London dismantled in 72 hours. Markets are pricing a spike. The mechanism describes a plateau. The difference between those two shapes across a forward curve is where the real money moves. open.substack.com/pub/shanakaans…

English
37
175
825
182.8K
Eric from the netherlands retweetledi
Fred Kosters
Fred Kosters@FredKosters·
@Henrik115 will have his own opinion on $ATY.v, but since I have done some work on the company, I'd like to point out the following with regard to Atico: At 5,000 gold, 6 copper and 80 silver, $ATY.v's after-tax FCF looks like this: 1. El Roble (9koz Au, 10M lbs Cu, 40koz Ag per year): 108M revenue - 63M all-in costs incl. royalties and mining taxes - 9M corporate G&A (cash part) and net interest cost - 12.6 M corporate income tax = 23.4M USD after tax FCF = 32M CAD 2. La Plata (9koz Au, 10M lbs, 220koz Ag, 13M lbs Zn): 176.6M revenue - 50M all-in costs incl. royalties and mining taxes - 31.7 M corporate income tax = 94.9M USD after tax FCF = 130M CAD 3. Total after-tax FCF: 162M CAD. Fully diluted mcap: 73M CAD. Result: Annual after-tax FCF is 2.2 times fully diluted mcap. Important to point out that this is after-tax FCF at the aforementioned metal prices. $ATY.v's after-tax FCF yield (FCF : mcap) at these prices will be higher than $ORV.to's FCF yield. That said, Orvana is further ahead with in the production curve. Atico's La Plata project has obtained all major permits, but FID and financing are still outstanding. La Plata won't come online before 2028.
English
1
3
12
1.7K
Eric from the netherlands retweetledi
Affan
Affan@feynzz·
#AA4 gets acquired at a higher price than what I thought it was worth. Completely different to #AVAP with a bunch of A380s and reliant on just two customers. The scale of M&A in this sector has surprised me. Only a matter of time....
English
3
2
12
2.2K
Eric from the netherlands retweetledi
Silver Santa
Silver Santa@Silver__Santa·
$SAM.TO $SHVLF - STARCORE Not for the colorblind. Permit in March. Production silver 500-700 GT in June. Doubling production to 40,000 oz AU EQ. New ore sorter with lower AISC, higher production, and higher grade. Latest news talked about 5 gt Au instead of earlier 1 gt Au. Worth 100m. Should be worth 400-500m. No Capex. Plant already running. One of my biggest positions.
Correlation Economics@GoldForecast

I think people need colors to understand things.😹 The starship Enterprise is currently in the 4X bingo zone ($86 silver and $5200 gold).🎲♠️🎯 $SAM.TO

English
3
7
33
8.2K
Eric from the netherlands retweetledi
Affan
Affan@feynzz·
#AVAP A lot to go through but few things that stand out for me: -The interim loss includes final amortisation of gain on 2021 debt modification of $4.1m and one-off loss recognised on redemption of bonds of $8.8m, that is c$13m one-off (16p per share p.a.) that won't continue. -They have recognised a $1.4m gain on delivery of the ATR 72-600 in December, that proves I was correct in my understanding that Black-Scholes is nuance, their deposits were valued at c$3m per aircraft but they make more on each delivery. 4 more due this year, expect similar uplifts for all 4 of them. This is despite them recognising another $5m Black-Scholes loss on ATR purchase rights, it shows accounting not following reality, more hidden value. -Shame about Air Braathens buts its only 2 ATRs and don't think would be an issue to re-lease or sell. -Shame also about the total loss on one A220-300 but insurance covers full book value of $33m so no real loss, cash could be used for new planes or more buybacks. -I see even more value, maybe its just me but I like being against the crowd
English
1
1
13
1.7K
Eric from the netherlands retweetledi
Affan
Affan@feynzz·
bloomberg.com/news/articles/… Another lessor acquired by a bigger fish. M&A is rampant in the sector. Only a matter of time for #AVAP.
English
3
2
11
2.4K
Eric from the netherlands retweetledi
Henrik
Henrik@Henrik115·
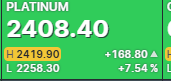
And now Platinum is on the run. #THS $THS.l already producing 160k oz PGMs and 1,8mt chrome which also ripped higher. They invested 180m$ in Karo that will soon close financing and have 15months to full producion 220k oz PGM (~70% ownership). 1/2
Henrik tweet media
Henrik@Henrik115

Tharisa making a lot of cash on Rhodium #ths $ths.l

English
3
3
25
4.2K