Value Options Letter
101 posts

Value Options Letter
@ValueOptionsLtr
Weekly options-income research for serious self-directed investors. Value-lens, live track record, real trades. Free primer → https://t.co/hudn0gQmz7


Every single midterm year since 1974. Same pattern. 1974 Ford: −35% 1978 Carter: −15% 1982 Reagan: −17% 1986 Reagan: −10% 1990 Bush: −20% 1994 Clinton: −8% 1998 Clinton: −22% 2002 Bush: −34% 2006 Bush: −8% 2010 Obama: −17% 2014 Obama: −10% 2018 Trump: −20% 2022 Biden: −27% 2026 Trump: ??? Every single one had a significant drawdown. Every single one recovered. The long-term chart kept going up. The question for 2026 is not if it recovers. The question is whether you will still be invested when it does.


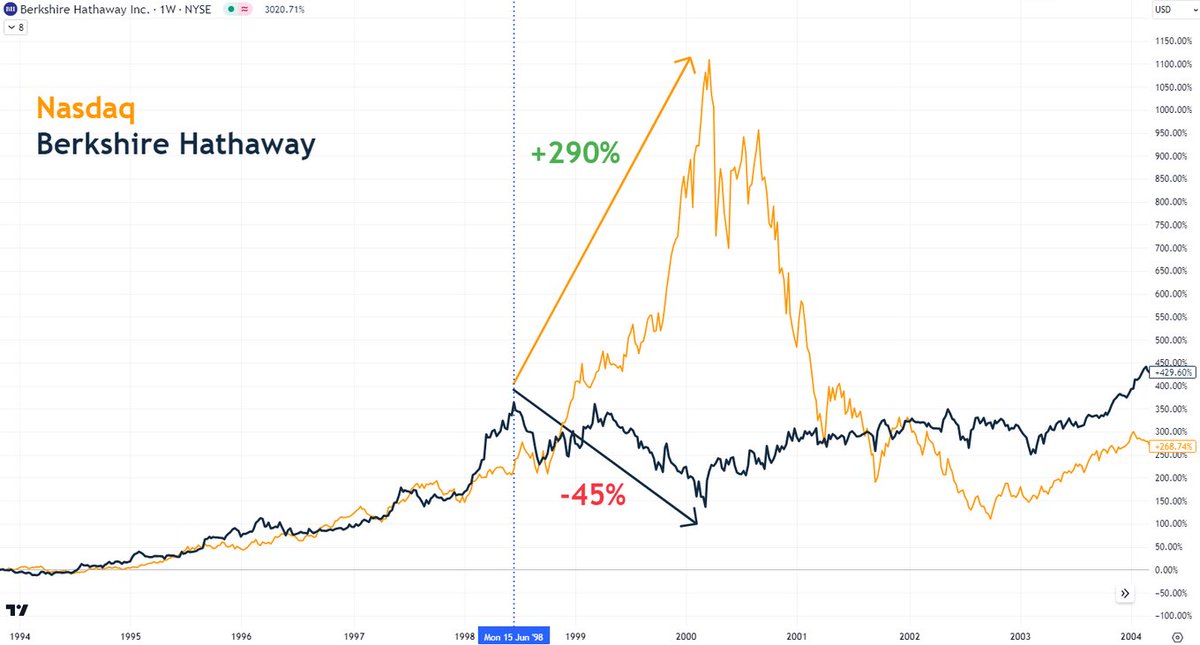
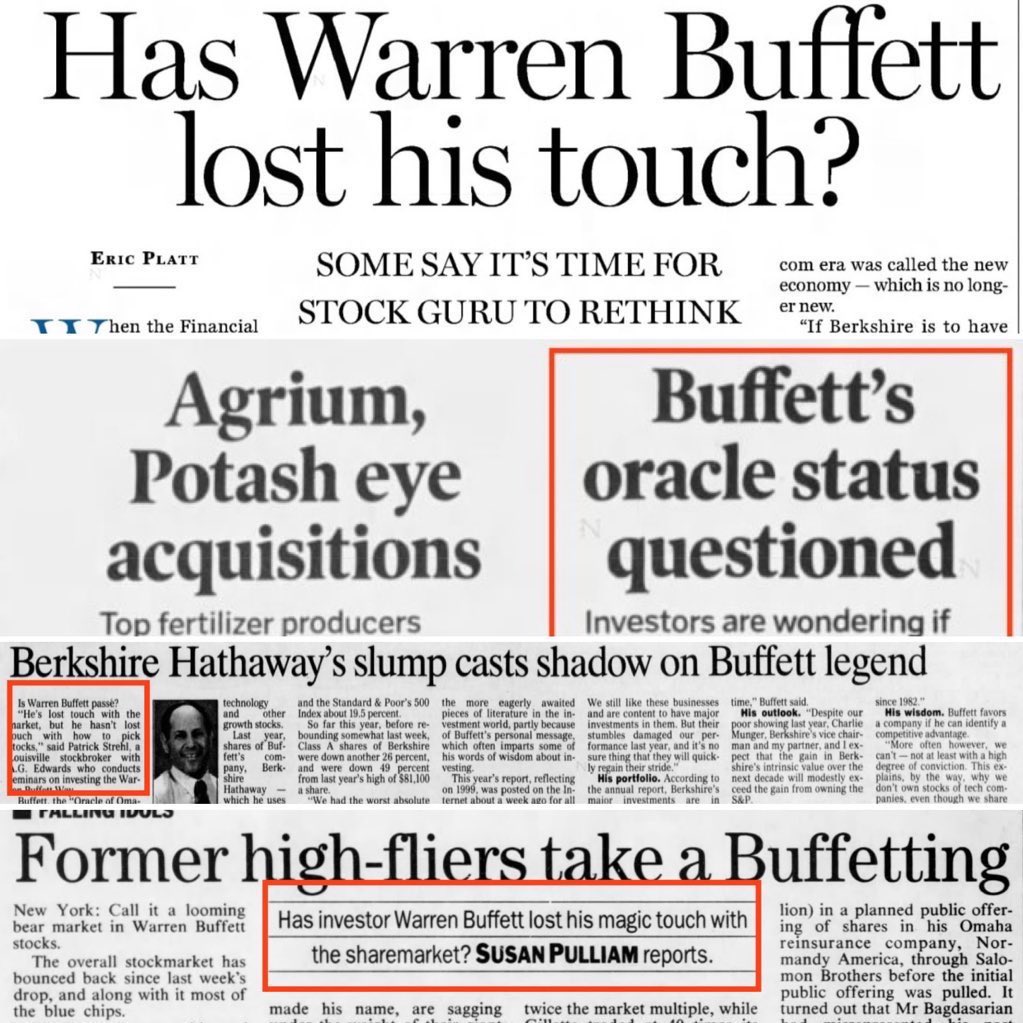
In the twenty months leading up to the March 2000 peak: • Nasdaq 100: +290% • Berkshire Hathaway: -45% The greatest investor of all time underperformed the most exciting index of his generation by 335 percentage points in less than two years. Many sold Berkshire to buy tech. You know how the story ended. The Nasdaq crashed 80%. Berkshire recovered and kept compounding. By 2004, Berkshire was up 430% from the start of that period. The Nasdaq was up 270%. Buffett didn't change. The crowd did. The crowd lost.