Bull/Bear Whateva Man

1.2K posts

Bull/Bear Whateva Man

Bull/Bear Whateva Man

@VoltsNuts

the world Katılım Haziran 2017
30 Takip Edilen94 Takipçiler
Bull/Bear Whateva Man
Bull/Bear Whateva Man@VoltsNuts·
@PradeepBonde Pradeep, it's possible to make EP or 9 million work if you are a working person? Meaning doing trading part time? How would you do it? Thank you
English
0
0
1
17.8K
stockbee
stockbee@PradeepBonde·
low of entry day
Inwood@InwoodTx

@MagnoliaBerumen @PradeepBonde Pradeep for stop loss on entry day 1 is your EP low the current low of the day after gap … or do you base it on the previous overnight low ( extended hours trading ) as the ep low for day 1 entries ? ? Thank you for you time :) huge fan
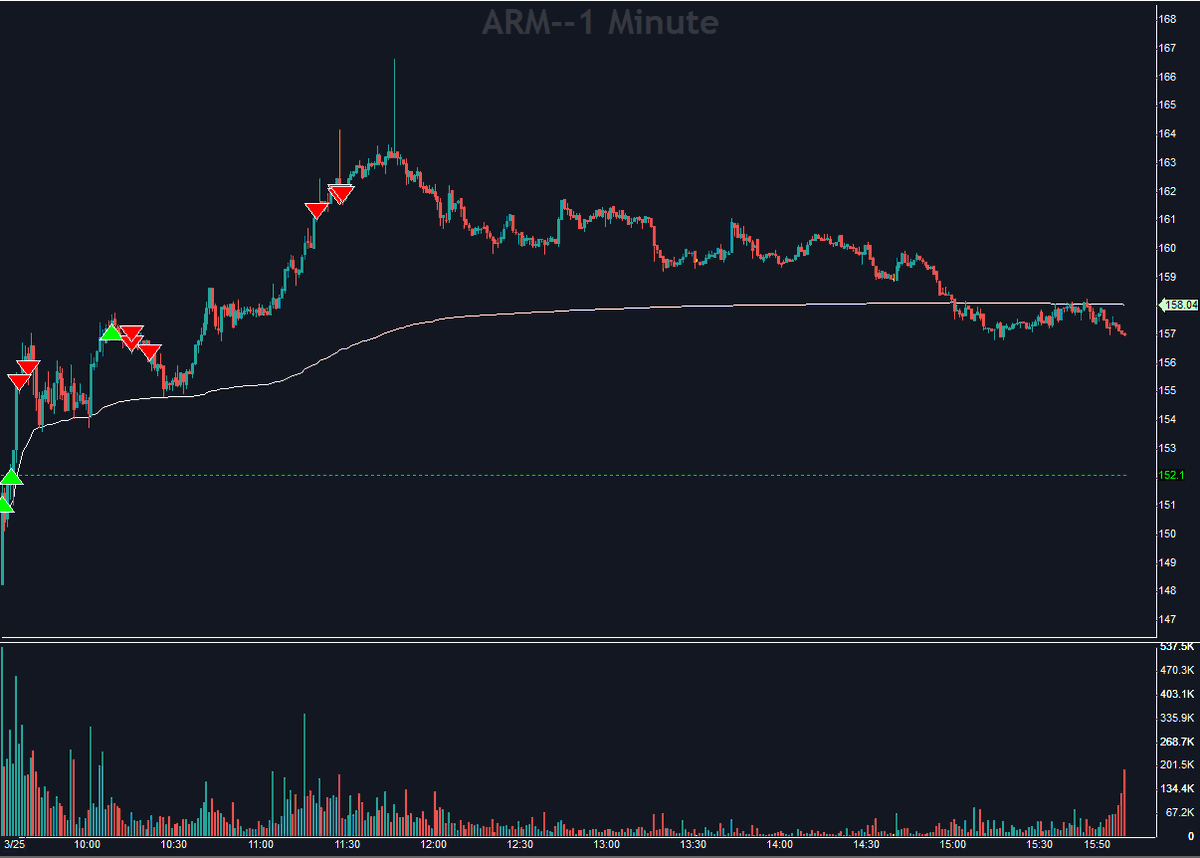
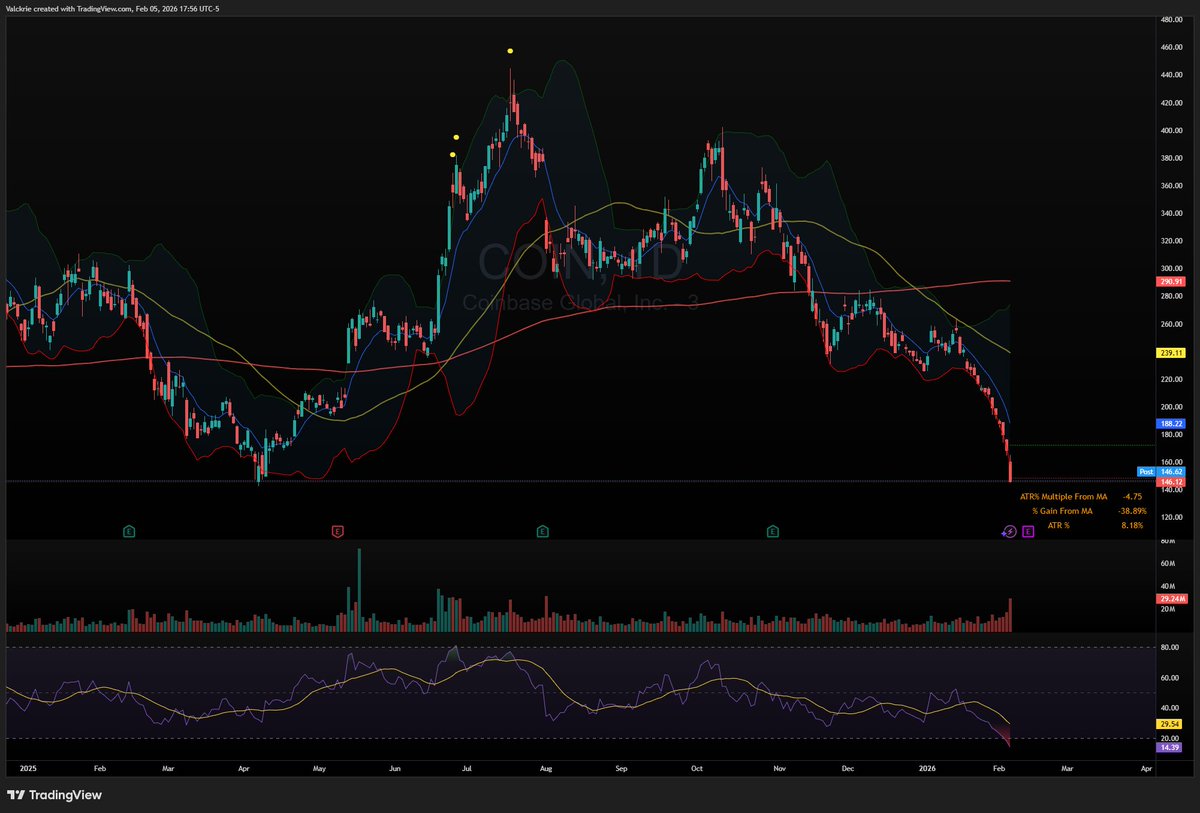
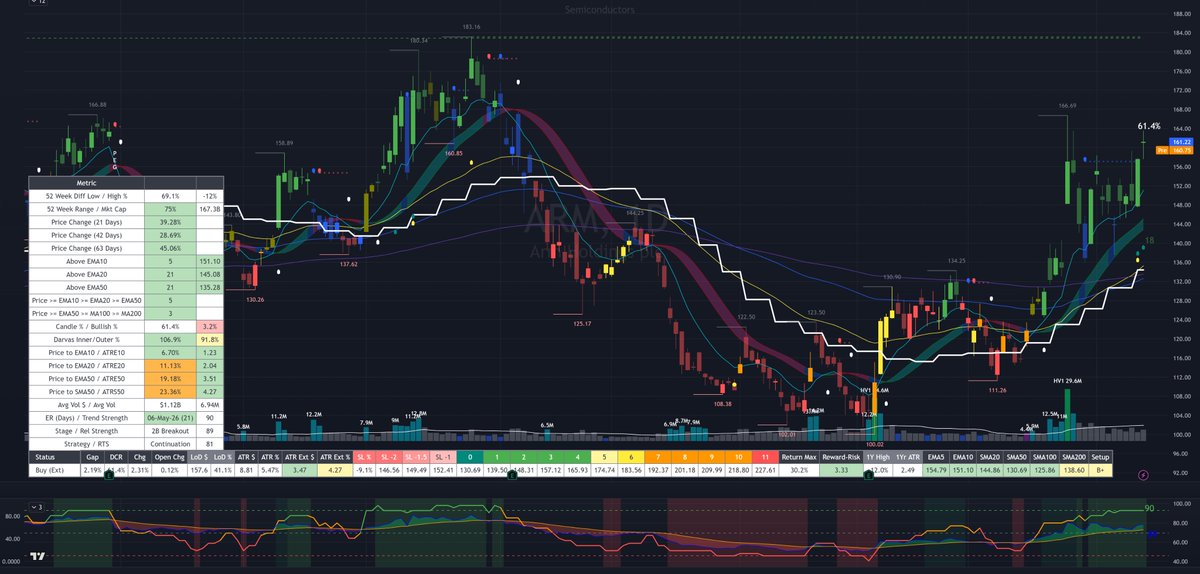
English
2
3
35
16.6K
Bull/Bear Whateva Man
Bull/Bear Whateva Man@VoltsNuts·
@TaPlot I know it looks good because it's tight. But when compared with soxx this thing should be up big time in last 10 days. How do you trade of between low risk entry and lagard in a theme? Curious to know how you think about this stuff
English
1
0
0
37
Bull/Bear Whateva Man
Bull/Bear Whateva Man@VoltsNuts·
@SteveDJacobs Wow amazing you answer, thank you will read that again. It helps and thanks for all the interesting stuff you share daily
English
0
0
1
90
Steve Jacobs
Steve Jacobs@SteveDJacobs·
Relative Trend Strength - Is It A Watchlist? 🤨 The Relative Trend Strength (RTS) grades stocks based on two components: 1) Relative* Strength 2) Trend Strength It is NOT a watchlist but rather a categorization of all stocks into grades A+ to G based on their Relative Trend Strength (RTS). Stocks in the A+ columns, particularly the red font (7x or greater ATR-to-SMA50 and purple font (5x to 7x ATR-to-SMA50) are already over/too extended to initiate new positions ... they are great if you are in from much lower which some people are. Watchlist stocks are highlighted in orange/yellow cell colors. There are currently none in the $QQQE because as you stated, and I fully agree with you, many stocks have run significantly in the past 5-10 days and it would be healthy to have a pullback to ascending moving averages and/or sideways consolidation/digestion. The RTS can be useful for determining market health and sentiment - currently ~ 1/3 are on the left side but some stocks such as $GOOG and $NVDA are D- so there may be some opportunities arise here if they improve (and move to the left columns). Looking at a combined universe of $SPY and $QQQ, it can be seen that there are a handful of watchlist stocks such as $SATS $ARM $MU - it doesn't mean rush out and buy them - they are just (what I consider) favorable setups that could be watched for pilot positions based on your own personal entry tactics. Market trump sector/industry and sector/industry trump individual stocks. Given the recent strength in the market there may be some digestion/sideways/pullbacks on the horizon. Energy ( $XLF) is already at a 20-day low, along with $XOM and $CVX etc. If the conflict ends and the strait of Hormuz is reopened fully to all traffic, the flow of oil, gas and fertilizers will be restored (over time) and the market may get a further bump. Maybe this will lead to sector/industry rotation. Nobody knows ... the goal is to follow price and volume action to determine objectively the new True Market Leaders (TMLs) as they emerge. * More correctly it is Absolute Strength (AS) as it is comparing the strength of all stocks to each other and not to an index or benchmark.
Steve Jacobs tweet mediaSteve Jacobs tweet mediaSteve Jacobs tweet mediaSteve Jacobs tweet media
Bull/Bear Whateva Man@VoltsNuts

@SteveDJacobs I know it's just a watchlist, but don't you think many stocks now need a little rest? Many are 5 or even 10 days up in a row. How do you enter when the market is like this?

English
1
5
28
3.1K
Bull/Bear Whateva Man
Bull/Bear Whateva Man@VoltsNuts·
@SteveDJacobs I know it's just a watchlist, but don't you think many stocks now need a little rest? Many are 5 or even 10 days up in a row. How do you enter when the market is like this?
English
1
0
1
3.6K
Steve Jacobs
Steve Jacobs@SteveDJacobs·
📈 Relative Trend Strength: Nasdaq-100💪 $QQQ A+ Setups $WDC $STX $INTC $MRVL $LRCX $KLAC Relative Trend Strength grades stocks based on their Relative Strength AND Trend Strength. A+ stocks have both the highest RS AND strongest price structure trend. Red font => over-extended 7x ATR-to-SMA50 or greater Purple font => extended 5x ATR-to-SMA50 or greater Blue font => below average ATR
Steve Jacobs tweet mediaSteve Jacobs tweet mediaSteve Jacobs tweet mediaSteve Jacobs tweet media
English
1
4
19
2K
TrendSpider
TrendSpider@TrendSpider·
Back to planet Earth $ORCL
TrendSpider tweet media
English
27
60
840
86.1K
Bull/Bear Whateva Man
Bull/Bear Whateva Man@VoltsNuts·
@Valckrie To your trades, is the theme the most important factor of all? Daily chart or other factor?
English
0
0
0
73
Valckrie
Valckrie@Valckrie·
$LWLG new swing today with $9 breakout Some other positions from this week: $SNDK bought on ceasefire news afterhours $CRWG bought on the META deal
Valckrie tweet mediaValckrie tweet mediaValckrie tweet media
English
2
1
30
2.6K
Steve Jacobs
Steve Jacobs@SteveDJacobs·
@VoltsNuts Thanks 🙏 Unfortunately, most of Python code and Excel work was built manually before AI, howeverI do leverage AI now (sooo much easier!) The process is outlined here: x.com/SteveDJacobs/s…
Steve Jacobs@SteveDJacobs

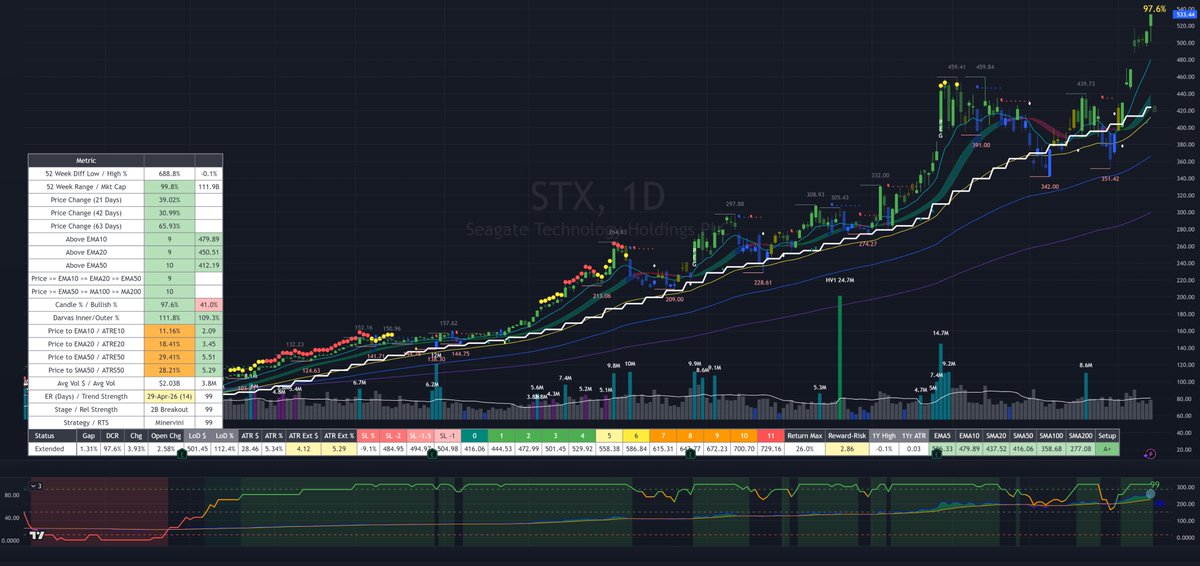
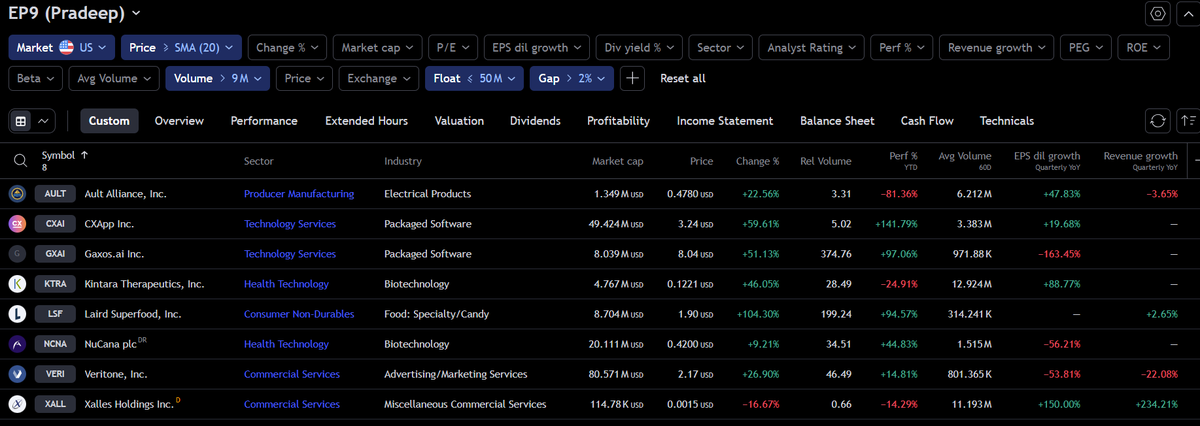
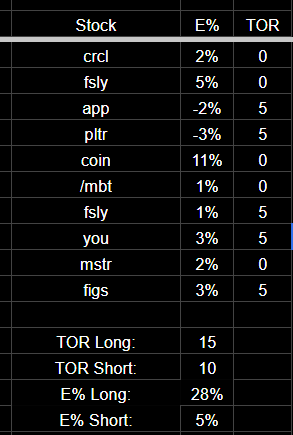
@finviz_com , @tradingview , Python & Excel The dashboards/analysis shared are automatic and nearly real-time (around 10-15 seconds delay) - I just drop in live data from Finviz and TradingView The process in summary is: 1) Full data extract from Finviz and TradingView after market close 2) The Finviz extract is loaded into Python (as a dataframe) where it is transformed, enriched (via scraping of websites like Yahoo and Zacks) and the analyzed. This results in a dataset/frame of daily and weekly data/analysis. The process takes around 90 minutes as it includes pulling the most recent 10-years worth of historical price data for each of the $1B+ stocks (around 2500 at the time of writing). 3) During market hours, the intraday $1B+ stock data is downloaded from Finviz and TradingView. This data, along with the daily/weekly snapshot from Python are loaded and analyzed (automatically) in Excel and the dashboards shared here are generated. Hope this makes sense - any questions just shout.

English
1
0
1
52
Bull/Bear Whateva Man
Bull/Bear Whateva Man@VoltsNuts·
@TaPlot Can you elaborate more with an example of how progressive exposure works for you? Thanks
English
0
0
0
165
TA 📈
TA 📈@TaPlot·
Hmmm, I believe I've been vocal that I've been mostly in cash for days besides small pilot stuff here and there? Side note.... I don't wait for the "market" to start up trending before I put on trades. I wait for my pilot positions to tell me what to do. I have also been clear about that. $spy $qqq $iwm
BackToBasix@Tommy24222689

@TaPlot dude markets are still downtrending . why are you forcing trades
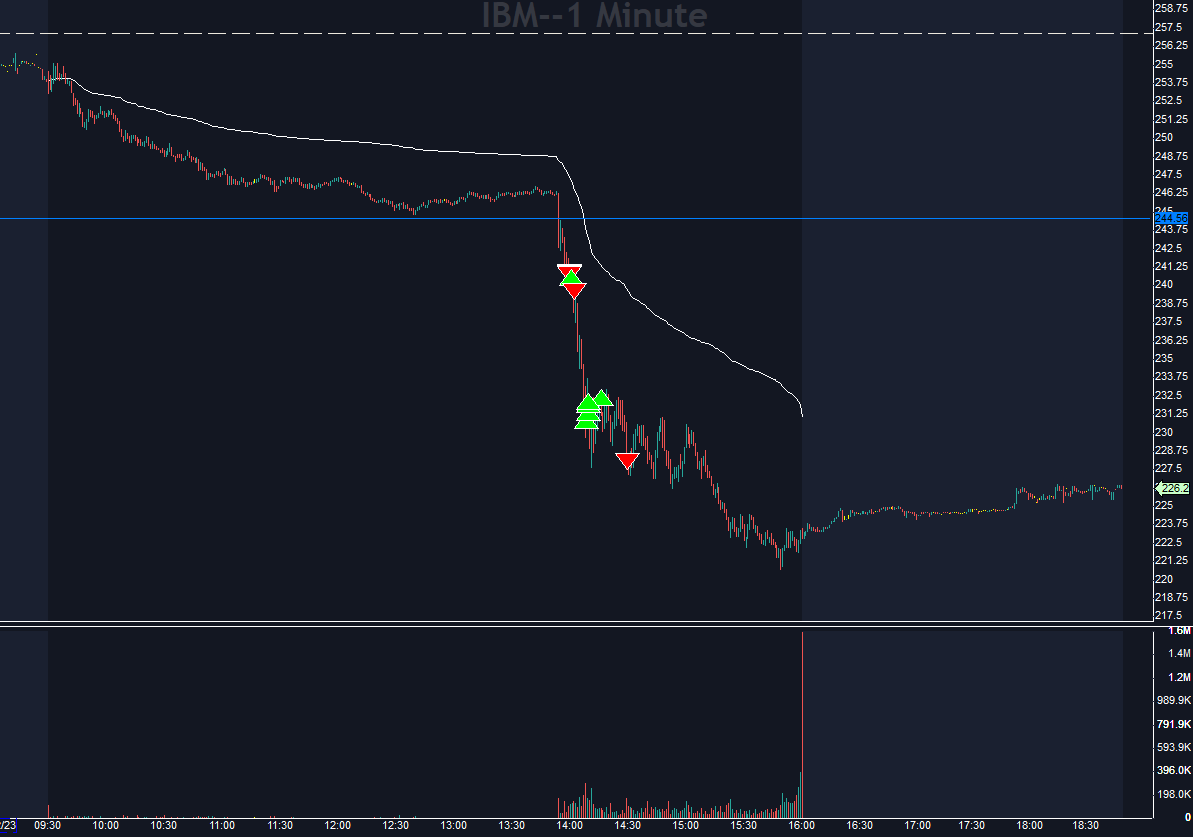
English
5
0
87
10.8K
Mansi
Mansi@drmansipd·
port: nothing for me to do today. feel i have enough exposure long and short. will the stops decide my fate.
Mansi tweet media
English
2
0
17
1.9K
Bull/Bear Whateva Man
Bull/Bear Whateva Man@VoltsNuts·
@ZaStocks What daily routine do you recommend to sharpen theme identication before the big moves?
English
0
0
1
459
Za
Za@ZaStocks·
Theme identification is arguably the most important element of being a market participant. Memory, photonics, optics, energy, etc. have been the biggest winners of late and one thing to note is that ALL of the names in each group have seen monstrous gains. You don’t need to be in the leading name, you can be in “secondary” names within a leading theme and still win. A rising tide lifts all boats. Theme > individual setup.
English
26
34
427
29.2K
Bull/Bear Whateva Man
Bull/Bear Whateva Man@VoltsNuts·
@Valckrie So in order to interpret the news, is important not to think much about the news itself and more about how the market it's been reacting to similar news recently? I'm asking if this is an habitual way to trade news or is something that is happening now and is not normal behavior?
English
0
0
0
36
Valckrie
Valckrie@Valckrie·
@VoltsNuts anything anthropic touches has been sold off on fears of disruption in the past couple of weeks. just following the market narratives and what is important atm
English
1
0
3
113
Bull/Bear Whateva Man
Bull/Bear Whateva Man@VoltsNuts·
@TheOneLanceB With optons,they need to move more than the expected move during the option expiration time. Lets say your images are any day current stocks/tickers and the expected value for your strategy, then you need to play only the best EV trades in order to make money with options
English
1
0
1
853
Lance Breitstein 🇺🇸🌎
Lance Breitstein 🇺🇸🌎@TheOneLanceB·
TRADE SELECTIVITY HEAT MAP Last week I did an annual review with an options trader that used to be on the prop side. He could easily increase his pnl by 200% with one simple change. The essence of the feedback I gave was this: Most traders aren’t selective enough. They play too many -EV hands. Optimal equity traders are very selective. As an options trader, you need to be even more selective. This visualization, using poker hands as an analogy, is worth a million words. Who cares to explain this and why it’s even more critical for options traders?
Lance Breitstein 🇺🇸🌎 tweet mediaLance Breitstein 🇺🇸🌎 tweet mediaLance Breitstein 🇺🇸🌎 tweet media
English
20
28
286
40.9K
Bull/Bear Whateva Man
Bull/Bear Whateva Man@VoltsNuts·
@Valckrie What would you look for to enter? How do you define backside or what you want to see in order to enter long these?
English
0
0
0
46
Valckrie
Valckrie@Valckrie·
Some crazy selloffs setting up for major capitulation bounces soon $IGV $BTC $COIN $HOOD Record low RSI levels across the board
Valckrie tweet mediaValckrie tweet mediaValckrie tweet mediaValckrie tweet media
English
4
1
45
12.8K
Ray Trades
Ray Trades@rsinvestgr67812·
@jfsrev @PradeepBonde this is his cash cow. I was introduced to 9M EP in his bootcamp few years back and shows that those stocks can make a phenomenal move after she setup the 9M EP if is is a good old fugazi story it can run triple digits
English
1
2
31
17K
Jeff Sun, CFTe
Jeff Sun, CFTe@jfsrev·
'EP 9 Million' emerged as a concept introduced by @PradeepBonde in November 2023, following his independent research suggesting that such stocks typically exhibit doubling behavior within a year. This intriguing and innovative idea can be implemented via a straightforward intraday scan based on a few key criteria, notably, a trading volume of 9 million within the initial hour. I have been keeping a back watchlist of the daily scan result and the results are really eye catching. But worth noting there will be lots of nanocap names, so there could be still room to further tighten the criteria based on 'market cap' filter. Would love inputs and discussion from anyone that has already been engaging this trading strategy.
Jeff Sun, CFTe tweet media
English
32
48
368
80.2K
Mansi
Mansi@drmansipd·
Been a rough start to the year. Hard to get any tractions on longs or shorts. My stats for the last 30 trades: The only defense against such periods to cut size. Cut cut cut until the easy dollar environment returns. The shallower your drawdown, the easier to surf back at ATH.
Mansi tweet media
English
5
0
28
2.5K