
William A. Wallace, Ph.D.
2.8K posts
William A. Wallace, Ph.D.
@WilliamWallace
operational 📍∴→
Katılım Ekim 2014
81 Takip Edilen32K Takipçiler
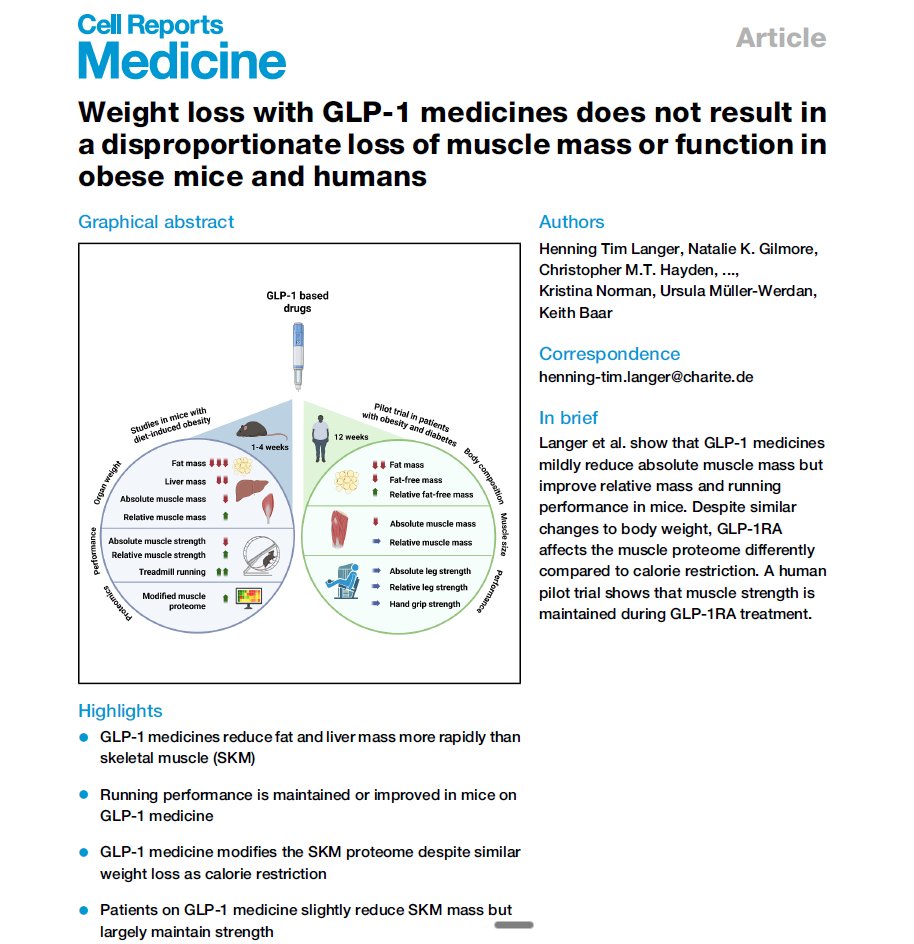
Muscle size decreased slightly on GLP-1 drugs. Muscle strength did not (in humans).
Most of the lean mass lost in mice was in the liver, which shrank as stored fat was cleared.
English
Your B12 test measures two things and can't tell them apart.
70-80% of circulating B12 is bound to haptocorrin. Your liver clears it. It never reaches cells.
20-30% is bound to transcobalamin. That's the fraction that actually gets delivered. Clinicians call it holoTC.
Standard serum B12 tests sum both. A "normal" result can still mean cellular deficiency, and it misses roughly 25-30% of true deficiency cases.
The better tests:
-HoloTC measures the active fraction directly
- MMA (methylmalonic acid) rises only when cellular B12 is genuinely insufficient. Functional gold standard.
- Homocysteine also rises in deficiency but also with low folate, low B6, MTHFR variants, kidney issues, aging. Less specific.
Who should care: adults 60+, long-term metformin users (10-30% go deficient), PPI users, vegetarians/vegans, anyone with unexplained fatigue, neuropathy, cognitive changes, or macrocytic anemia.
If you've been told your B12 is normal and symptoms don't fit, ask for holoTC and MMA.
Sources:
Nexo, Am J Clin Nutr 2011: pubmed.ncbi.nlm.nih.gov/21593511/
Fedosov, Clin Chem Lab Med 2015: pubmed.ncbi.nlm.nih.gov/25536667/

English
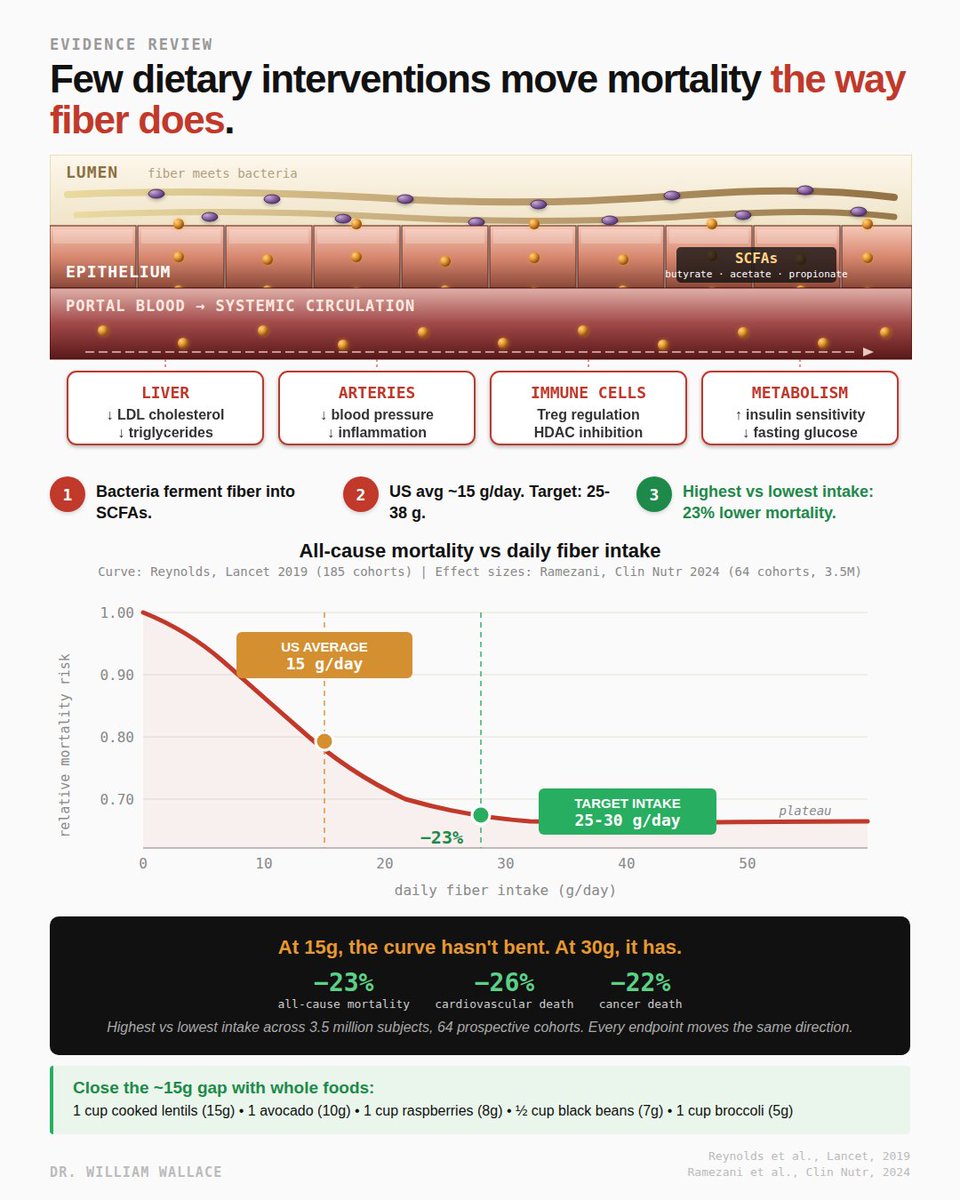
Fiber gets treated as nutrition advice and rarely as a mortality intervention. The meta-analysis data suggests it should be both.
The 2024 Ramezani systematic review in Clinical Nutrition pooled 64 prospective cohorts totaling 3.5 million subjects. Comparing highest fiber consumers to lowest:
- All-cause mortality: 23% lower
- Cardiovascular mortality: 26% lower
- Cancer mortality: 22% lower
Every endpoint measured moved in the same direction. Effect sizes of this magnitude from observational data on a single nutrient are rare.
The 2019 Reynolds Lancet dose-response meta-analysis (185 prospective cohorts) fills in the curve shape. Mortality risk drops sharply from 0 to about 25 g/day and plateaus. Below 25g, each additional gram is associated with measurable risk reduction. Above 30g, the curve is mostly flat. The inflection point sits almost exactly where IOM set the daily target: 25g women, 38g men.
US adults average ~15 g/day, halfway up the curve, not at the top. About 95% fail to hit target. Closing that gap is arguably the single largest preventable nutrition-related mortality signal in the current evidence base.
The mechanism operates on two parallel tracks. Direct effects: viscous soluble fibers (beta-glucan, psyllium) bind bile acids in the intestinal lumen and increase fecal excretion, forcing the liver to pull cholesterol from circulation to synthesize replacements. This is how fiber lowers LDL, independent of bacteria.
Fermentation effects: colonic bacteria ferment fibers into short-chain fatty acids (acetate, propionate, butyrate). Propionate reaches the liver via bloodstream and appears to inhibit cholesterol synthesis, a second pathway behind fiber's lipid effects. Butyrate regulates gene expression in immune cells, supports regulatory T cell populations, and fuels the cells lining the colon. SCFAs also signal through receptors on immune cells, enteroendocrine cells, and fat cells, influencing insulin sensitivity and inflammation.
Caveats. Evidence is observational, not randomized. Fiber intake correlates with diet quality, activity, body weight, smoking, and socioeconomic factors, all independently tied to mortality. Adjustments don't fully eliminate confounding. Causal claims need caution. Large-scale RCTs on hard mortality endpoints do not exist. What IS well-supported: higher fiber intake is associated with lower mortality, the relationship is graded by dose, and associations are consistent across dozens of independent cohorts.
Subgroup finding worth knowing. In Ramezani, insoluble fiber showed stronger associations than soluble. Fiber from nuts and seeds specifically was associated with 43% lower cardiovascular mortality.
Close a 10-15g gap with food: 1 cup cooked lentils (~15g) + 1 avocado (~10g) + 1 cup raspberries (~8g) + ½ cup black beans (~7g) + 1 cup broccoli (~5g). One legume, one whole grain, one fibrous vegetable daily moves most adults from 15 to 30 g/day.
For the magnitude of mortality associations backed by this scale of observational evidence, few single nutrients compare.
Ramezani, Clin Nutr, 2024: pubmed.ncbi.nlm.nih.gov/38011755/
Reynolds, Lancet, 2019: pubmed.ncbi.nlm.nih.gov/30638909/
English
Taurine is one of the most studied amino acids in metabolic research and one of the least discussed outside it. The 2024 Tzang meta-analysis in Nutrition & Diabetes pooled data from randomized controlled trials of taurine supplementation and measured every major marker in the metabolic syndrome cluster. The results are more consistent and more clinically meaningful than most people realize.
Taurine is a sulfur-containing amino acid. The body synthesizes it from cysteine, but endogenous production does not always meet demand, which is why it is classified as conditionally or semi-essential. It is concentrated in the heart, brain, retina, and skeletal muscle. Plasma and tissue taurine levels are consistently lower in people with type 2 diabetes, obesity, and cardiovascular disease than in healthy controls, a pattern documented across multiple populations.
The 2024 meta-analysis pulled from randomized trials using doses between 0.5 and 6 grams per day. Against placebo, taurine supplementation significantly reduced systolic blood pressure by 4 mmHg. Diastolic blood pressure fell by 1.5 mmHg. Triglycerides dropped by 18.3 mg/dL. Total cholesterol fell by 8.3 mg/dL and LDL cholesterol by 6.5 mg/dL. Fasting glucose decreased by 5.9 mg/dL. The HOMA-IR index, a measure of insulin resistance, fell by 0.69 units. Fasting insulin decreased by 1.5 mU/L. HbA1c trended down by 0.34 percent, a borderline signal. Every endpoint moved in the direction that favors metabolic health. No effect on body weight or BMI, which actually strengthens the mechanistic case because the benefits are not mediated by weight loss.
For context on magnitude, a 4 mmHg systolic reduction is roughly what you would expect from first-line antihypertensive monotherapy at standard doses. An 18 mg/dL triglyceride drop is comparable to what EPA/DHA at 2 to 4 grams per day produces. A 0.69 HOMA-IR reduction is a substantial insulin sensitivity improvement. These are not marginal biomarker shifts. They are clinically relevant changes hit by a single amino acid with no observed safety signal.
The mechanisms that map to these outcomes are well characterized in the literature. Taurine enhances endothelial nitric oxide availability and modulates vascular tone, which plausibly explains the blood pressure reduction. It conjugates with bile acids in the liver and promotes fecal bile acid excretion, increasing hepatic demand for cholesterol as substrate and reducing circulating cholesterol and triglyceride loads. It appears to support pancreatic beta-cell function and improve insulin signaling at peripheral tissues, which maps onto the observed improvements in fasting glucose, fasting insulin, and HOMA-IR.
The caveats worth knowing. Trial sizes have generally been modest, typically 20 to 100 participants per arm. Durations have ranged from days to a year, and most are in the weeks-to-months range, so we do not have long-duration hard cardiovascular endpoint data from randomized trials. Populations skew toward metabolic syndrome, type 2 diabetes, obesity, and hepatic dysfunction rather than the healthy general population. Effects in healthy individuals without metabolic impairment may be smaller or harder to detect. A 2025 meta-analysis in overweight and obese adults identified 3 grams per day as the threshold below which glycemic improvements become inconsistent, suggesting dose matters.
The broader point. Taurine has meta-analysis-level evidence for improving blood pressure, lipids, glycemic control, and insulin sensitivity simultaneously, with no weight or safety trade-offs. It is remarkable how little that data shapes the way this amino acid is discussed.
Tzang, Nutr Diabetes, 2024: pubmed.ncbi.nlm.nih.gov/38755142/
Guan, Eur J Pharmacol, 2020: pubmed.ncbi.nlm.nih.gov/32871172/
Ran, Nutrients, 2025: pubmed.ncbi.nlm.nih.gov/39796472/

English
@mxmelfimov I wrote an article on this that lives on my website that sums up the state of the marketing claims
English

@williamwallace Correct me if I’m wrongly get it: there is no difference to take mg threat or glycinate intern of total magnesium level in brain and blood flow? Why people say threonate the only one mg can go through brain barrier?
English
Every magnesium form you take gets absorbed through the same two pathways. The channels don't know what brand you bought.
The form affects how much magnesium dissolves and dissociates in your gut. There is little evidence (in humans) it affects where that magnesium goes once it's in the blood.
If chelates were truly chaperoning magnesium through peptide transporters, that would be a novel finding

English
Image source:
pubmed.ncbi.nlm.nih.gov/29123461/
English
Big fan of lithium orotate, but lithium orotate as a defined molecular salt (what you would buy on a shelf) is not naturally occurring.
Lithium, at least in water, is found naturally as a hydrated cation alongside (but not paired with) whatever anions are present in the geochemical environment - e.g., carbonate, bicarbonate, sulfate, chloride, etc
Vance 🌞⚡️@VanceE
Lithium Orotate might be the most underrated mineral. - Displaces Aluminum from the brain - Improves B12 absorption - Boosts BDNF - Improves Mood - Helps behavioral issues - Aids in Neuroinflammation and Neuroprotection - May improve sleep This is not the same as the Lithium medication prescribed for BPD. This is naturally occurring and not dosed at super physiological levels. 5-20mg is sufficient.
English
The plant vs animal protein debate is one of the loudest arguments in nutrition. The actual research is quieter, and the answer is more boring than either camp would prefer.
If you hit your total daily protein target from varied sources, your muscle cannot tell whether it came from a chicken breast or a bowl of lentils.
Hevia-Larraín 2021 (Sports Med). 38 young men, 19 vegans and 19 omnivores, 12 weeks resistance training, 1.6 g/kg/day. Vegans supplemented soy, omnivores whey. Equivalent gains in muscle mass and strength.
Monteyne 2023 (J Nutr). 22 young adults, 10 weeks, ~2.0 g/kg/day. Three endpoints, same answer three different ways. Lean mass: 2.6 kg omnivore vs 3.1 kg vegan. Thigh volume: 8.3% both. Muscle fiber CSA: 33% vs 32%. Myofibrillar protein synthesis rates, measured directly with deuterated water, also equivalent.
The mechanism is straightforward. Protein breaks into amino acids during digestion. Once in circulation, leucine from a black bean is identical to leucine from a ribeye. Plant proteins have lower leucine density (~7% vs 9-11%), so you need slightly more per meal to hit the same leucine pulse. Not dramatically more. Slightly more.
Morton 2018 meta-analysis (49 studies, 1,863 participants) placed the plateau for resistance training gains at 1.62 g/kg/day, CI up to 2.20. Both RCTs above tested within this range.
Caveats worth knowing.
Both RCTs were in young adults. Older adults develop anabolic resistance. Per-meal leucine dose matters more after ~65. Young adult data does not automatically transfer to the sarcopenia-prone population.
Both studies used high-quality plant sources (soy, mycoprotein). A real-world vegan diet built on rice and wheat may not produce the same outcomes without deliberate variety and higher total intake.
Muscle outcomes are not the whole story. Animal protein comes packaged with nutrients entirely absent or poorly bioavailable from plants. B12. Heme iron. Creatine. Taurine. Carnosine. Preformed retinol. EPA/DHA (plants only provide ALA, converted at ~5-10%). A plant-heavy diet is not deficient, but it requires deliberate strategy and often supplementation.
The practical takeaway. Most people in this debate are at 0.6-0.8 g/kg/day while arguing about ratio. Fix total intake first. Source ratio is a rounding error by comparison.
Sources:
pubmed.ncbi.nlm.nih.gov/33599941/
pubmed.ncbi.nlm.nih.gov/36822394/
pubmed.ncbi.nlm.nih.gov/28698222/

English
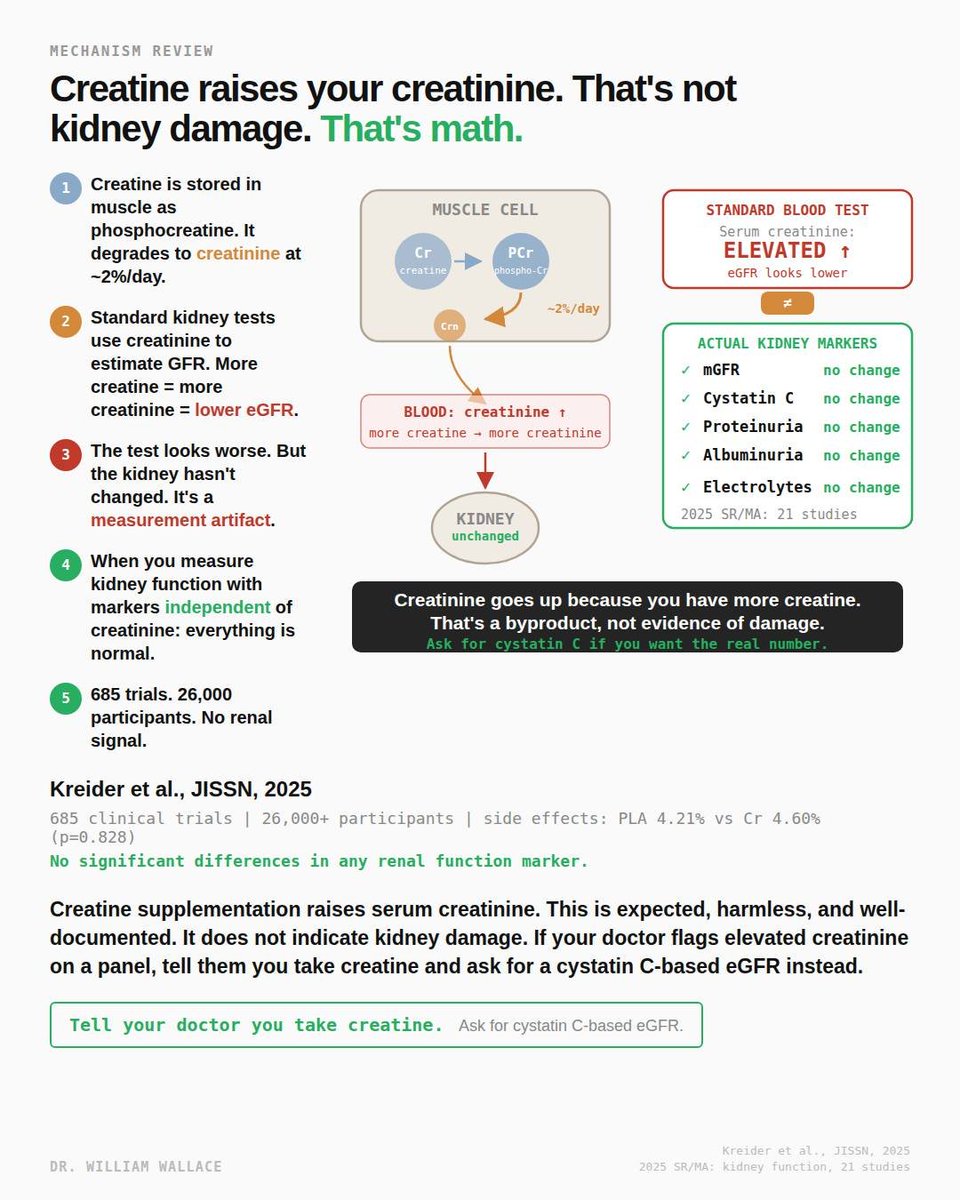
The most persistent myth about creatine is that it damages your kidneys. The concern comes from a real observation interpreted incorrectly: creatine supplementation raises serum creatinine. On a standard metabolic panel, elevated creatinine triggers a lower estimated glomerular filtration rate, which is the primary marker doctors use to assess kidney function. The number looks worse. The kidney is fine.
Here is why. Creatine is stored in skeletal muscle primarily as phosphocreatine. It degrades spontaneously and irreversibly into creatinine at a rate of approximately 2% per day. Creatinine is a waste product. It is filtered by the kidneys and excreted in urine. Standard kidney function tests measure serum creatinine and use it to calculate eGFR. The assumption built into the equation is that creatinine production is relatively constant. When you supplement creatine and increase total body creatine stores, you produce more creatinine. The equation interprets this as reduced kidney filtration. It is not. It is more substrate producing more waste at the same filtration rate.
A 2025 systematic review and meta-analysis of 21 studies examining the effect of creatine supplementation on kidney function confirmed this directly. Creatine was associated with a small but statistically significant increase in serum creatinine (mean difference: 0.07 micromol/L). However, there were no changes in measured GFR, cystatin C, proteinuria, or albuminuria. These are the markers that actually reflect kidney health independent of creatinine metabolism. The creatinine went up. Every other renal marker was unchanged.
Kreider et al. (2025, JISSN) conducted the largest safety analysis of creatine to date, reviewing 685 human clinical trials involving over 26,000 participants. Side effect prevalence was virtually identical between creatine and placebo groups: 4.60% vs 4.21% (p=0.828). No significant differences were observed in any of the 49 side effects evaluated, including all markers of renal function and health. Some of these trials ran for up to 14 years.
The case reports that occasionally surface involving creatine and kidney injury almost always involve individuals with pre-existing kidney conditions, concurrent use of other substances known to affect renal function, or extreme exercise leading to rhabdomyolysis. These are confounded cases, not evidence of a causal relationship between creatine and kidney damage in healthy individuals.
One practical issue worth noting: if you take creatine and get routine bloodwork, your doctor may flag the creatinine and eGFR numbers. This is not because your kidneys are failing. It is because the standard test was not designed with creatine supplementation in mind. The solution is straightforward. Tell your doctor you take creatine and ask for a cystatin C-based eGFR instead. Cystatin C is produced at a constant rate by all nucleated cells and is not affected by creatine intake. It gives you the real kidney function number without the artifact.
For individuals with pre-existing kidney disease, the data is more limited. Most creatine studies have been conducted in healthy populations. While pilot studies in hemodialysis patients have not shown adverse effects beyond the expected creatinine increase, caution is warranted for anyone with diagnosed renal impairment until more data is available.
pubmed.ncbi.nlm.nih.gov/31375416/
tandfonline.com/doi/full/10.10…
English
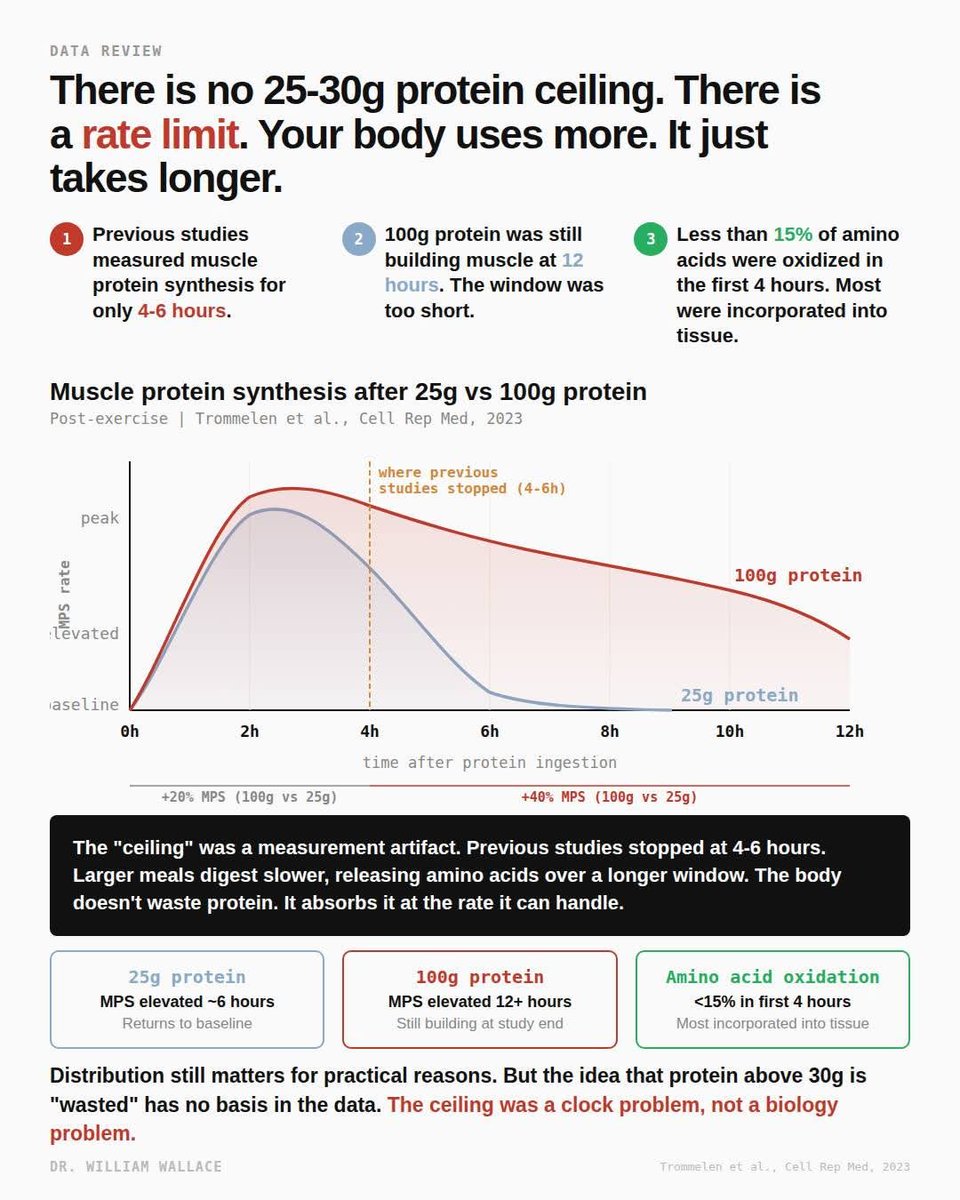
"Your body can only use 25-30g of protein per meal. Anything above that gets wasted."
This claim has been repeated in fitness nutrition for over a decade, and it was built on studies that measured the right thing over the wrong timescale.
Moore 2009 gave six young men 0, 5, 10, 20, or 40g of egg protein after leg-only resistance exercise and tracked muscle protein synthesis for four hours. MPS plateaued at 20g. Witard 2014 repeated a similar dose-response with whey protein after unilateral leg exercise in 48 resistance-trained men and found MPS rose 49% at 20g and 56% at 40g over four hours, with the authors concluding 20g was sufficient for maximal stimulation. Case closed, or so it seemed. The problem wasn't the dose. It was that a 4-hour window captures the peak response to 20g but only the opening chapter of what 40g is doing.
Think of digestion as a funnel with a fixed flow rate. Pour a cup of water through it and it drains in minutes. Pour a gallon and it doesn't overflow. The funnel just drains at the same rate over a longer period. Protein behaves the same way. A smaller dose gets absorbed and used quickly. A larger dose digests over a longer window because the stomach slows gastric emptying and the intestine releases amino acids gradually. Muscle tissue keeps incorporating them wave after wave. The "ceiling" in those early studies wasn't a biological saturation point. It was what you see when you stop watching before the larger dose finishes working.
Trommelen et al. (2023, Cell Reports Medicine) tested this directly. They randomized 36 recreationally active young men to 0g, 25g, or 100g of milk protein after a 60-minute whole-body resistance session and tracked muscle protein synthesis for twelve hours using a quadruple isotope tracer. In the first four hours, myofibrillar protein synthesis was only about 20% higher after 100g than after 25g. In the four-to-twelve-hour window, that gap widened to roughly 40%. That later window is where the bigger dose actually separates from the smaller one, and it's exactly where every prior dose-response study stopped measuring. The authors also reanalyzed the oxidation data from Moore and Witard and concluded that postprandial amino acid oxidation represents less than 15% of the increment in ingested protein. The paper states it plainly: "Protein ingestion has a negligible impact on whole-body protein breakdown rates or amino acid oxidation rates."
Caveats belong in the read. This was young recreationally active men following a single bout of resistance exercise. Not trained athletes, not women, not older adults, not a longitudinal hypertrophy trial. A 2024 Witard commentary in the International Journal of Sport Nutrition and Exercise Metabolism flagged that the finding may not translate to resistance-trained young women with different anabolic kinetics.
Practically: you don't need to portion exactly 25-30g of protein every three hours to avoid "wasting" it. Larger meals extend the anabolic window rather than capping it. Distribution across the day still matters for satiety, blood sugar, and hitting your daily target. But the rigid per-meal rule has weaker biology behind it than previously believed.
Sources:
pubmed.ncbi.nlm.nih.gov/19056590/
pubmed.ncbi.nlm.nih.gov/24257722/
pubmed.ncbi.nlm.nih.gov/27511985/
pubmed.ncbi.nlm.nih.gov/38118410/
pubmed.ncbi.nlm.nih.gov/38991545/
English
Most people who take CoQ10 think of it as an antioxidant. It is one. But that is not the most important thing it does.
CoQ10 is the only lipid-soluble mobile electron carrier in the inner mitochondrial membrane. The electron transport chain has four protein complexes fixed in the membrane. Complex I accepts electrons from NADH. Complex II accepts them from FADH2. But neither can pass those electrons directly to Complex III. They hand them to CoQ10, which physically shuttles across the lipid bilayer to deliver them. Complex III passes them to cytochrome c, the second mobile carrier, which delivers them to Complex IV. Complex IV reduces oxygen to water. The proton gradient pumped by Complexes I, III, and IV powers ATP synthase to produce ATP.
Without CoQ10, the chain breaks between Complex I/II and Complex III. Electrons have nowhere to go. Proton pumping stops. ATP production stalls. This is not an antioxidant function. This is the core mechanism of aerobic energy production.
CoQ10 is predominantly synthesized endogenously through the mevalonate pathway, the same pathway that produces cholesterol. HMG-CoA reductase is the rate-limiting enzyme of the pathway. Statins inhibit HMG-CoA reductase. That is how they lower cholesterol. It is also how they lower CoQ10.
An updated meta-analysis by Qu et al. (2018) pooled 12 RCTs with 1,776 participants and found statins significantly reduced circulating CoQ10. The reduction was present across statin types, intensities, and durations. Both lipophilic and hydrophilic statins showed the effect, with no significant difference between them. This is consistent with what the biochemistry predicts: the pathway is shared.
On top of statin-induced depletion, CoQ10 in human heart tissue declines naturally with age. Kalén et al. (1989) measured CoQ10 concentrations in myocardial tissue and found levels peak around age 20, decline by more than 30% by age 40, and drop approximately 50% by age 80. The organ with the highest energy demand loses half its electron carrier over a lifetime.
A 2025 meta-analysis by Kovacic et al. (Journal of Nutritional Science, 7 RCTs, 389 patients) found CoQ10 supplementation significantly reduced statin-associated muscle symptoms measured by pain intensity. This is the most current pooled data on clinical outcomes.
One important nuance: while plasma CoQ10 depletion from statins is well established, whether intramuscular CoQ10 drops proportionally is inconsistent. Some studies found no change or even increases in muscle tissue CoQ10 during statin treatment.
The plasma reduction may partly reflect reduced LDL particles, which are the primary carriers of CoQ10 in blood. The clinical significance of depletion beyond muscle symptoms remains debated.
Roughly 200 million people worldwide take statins. The mevalonate pathway that produces their target also produces the electron carrier their mitochondria depend on. The mechanism is not controversial. The clinical implications are still being debated
Sources:
pubmed.ncbi.nlm.nih.gov/2779364/
pubmed.ncbi.nlm.nih.gov/30414615/
pubmed.ncbi.nlm.nih.gov/41158831/

English
Some polyphenols don’t need to be absorbed to affect the brain.
Astringent flavanols activate gut sensory pathways that signal the locus coeruleus, increasing noradrenergic tone, arousal, and short-term memory (within minutes).

English
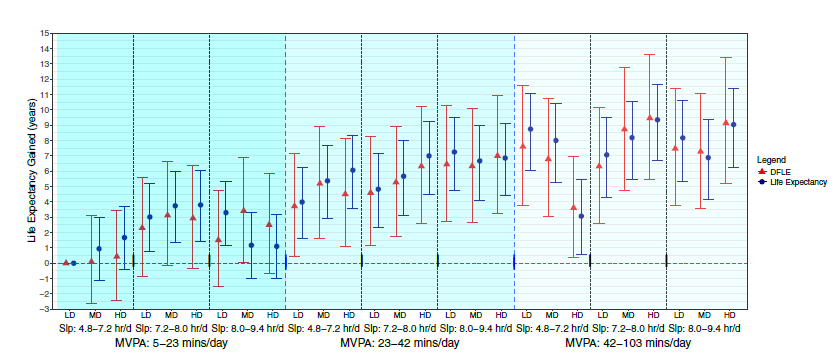
5 extra minutes of sleep per night and 2 extra minutes of daily exercise (+a modest improvement in diet) adds ~1 additional year of healthy life
For a great many people, the bar to entry for better health is low
English
"Take vitamin C with your iron." You have heard it a thousand times.
The mechanism behind it is real. The clinical benefit for supplements is not what you think.
Non-heme iron from food arrives at the gut wall as Fe3+ (ferric iron). It cannot cross the enterocyte membrane in that form. An enzyme called DCYTB sits on the brush border and uses vitamin C as an electron donor to reduce Fe3+ to Fe2+ (ferrous iron). Only Fe2+ can be transported through DMT1 into the cell. Vitamin C is one of the primary enhancers of this reduction step, particularly in meals high in phytates and polyphenols, which chelate ferric iron and further reduce availability.
This is where the advice originated, and for food iron, it is well supported.
But common oral iron supplements (ferrous sulfate, ferrous bisglycinate, ferrous fumarate) are already in the ferrous form at the point of ingestion. The reduction step that vitamin C facilitates was not required to begin with.
A 2024 meta-analysis by Deng et al. tested exactly this question in clinical practice. They pooled 11 studies with 1,930 patients diagnosed with iron deficiency anemia. Iron plus vitamin C versus iron alone. The hemoglobin difference was 0.14 g/dL. Statistically significant, but in the authors' words, "small and likely clinically insignificant." Ferritin increased by 3.23 mcg/L. Also marginal.
A separate 2023 meta-analysis by Loganathan et al. reached a similar conclusion from a smaller pool of studies: no statistically significant benefit of adding vitamin C to iron for hemoglobin or ferritin outcomes. The authors noted the evidence quality across their included studies was very low, which is part of why the Deng analysis was warranted.
One caveat: the Deng analysis had significant heterogeneity across studies, reflecting differences in formulations, dosages, and populations. The pooled estimate should be interpreted with that in mind.
The practical distinction: vitamin C matters for iron absorption from food, particularly plant-heavy meals where non-heme iron predominates and inhibitors are present. It does not appear to meaningfully improve outcomes when added to a ferrous iron supplement. The mechanism is not wrong. The context it gets applied to usually is.

English
Most people take their full magnesium dose in one sitting. The absorption data says that strategy may not “maximize efficiency.”
Fine et al. gave healthy subjects a standard meal supplemented with increasing amounts of magnesium. At the lowest dose (36 mg), 65% was absorbed. At the highest dose (1,009 mg), only 11%. The curve was not linear. It dropped steeply at first, then flattened. Their model explained it as two simultaneous processes: an active transport channel that saturates, plus a passive route that absorbs a fixed ~7% of whatever is present.
The active channel is TRPM6. It sits in the intestinal epithelium and actively pulls magnesium ions across the membrane. It works well at low concentrations but has a ceiling. Once it is saturated, additional magnesium can only cross passively between cells (paracellular transport), driven by the concentration gradient. That passive route never saturates, but it only captures about 7% of the dose regardless of how much is present.
This is why splitting a 400 mg dose into two 200 mg doses absorbs more total magnesium. Each dose stays closer to the steep part of the curve where TRPM6 is still contributing. One large dose overwhelms the active channel, and most of the magnesium passes through unabsorbed. The unabsorbed fraction is osmotically active, pulls water into the colon, and causes the loose stools people commonly experience.
A question that comes up: does the form of magnesium change this? The absorption curve from Fine et al. used magnesium acetate, which is highly soluble. The form determines how completely and quickly the magnesium salt dissolves and releases free Mg2+ ions in the gut. Oxide dissolves poorly at intestinal pH, so much of it never becomes available. Citrate, glycinate, and acetate dissolve more readily. But once the ion is free, it faces the same TRPM6 and paracellular bottleneck regardless of what delivered it. Form determines how much Mg2+ reaches the membrane. The curve determines how much of that gets through. A poorly soluble form at a high dose is the worst combination. A highly soluble form split across meals is the best.
The RDA for magnesium is 310-420 mg per day. NHANES data consistently shows about half of US adults fall short. Splitting the dose is free, requires no product change, and the physiology is clear.
pubmed.ncbi.nlm.nih.gov/1864954/
pubmed.ncbi.nlm.nih.gov/29123461/

English