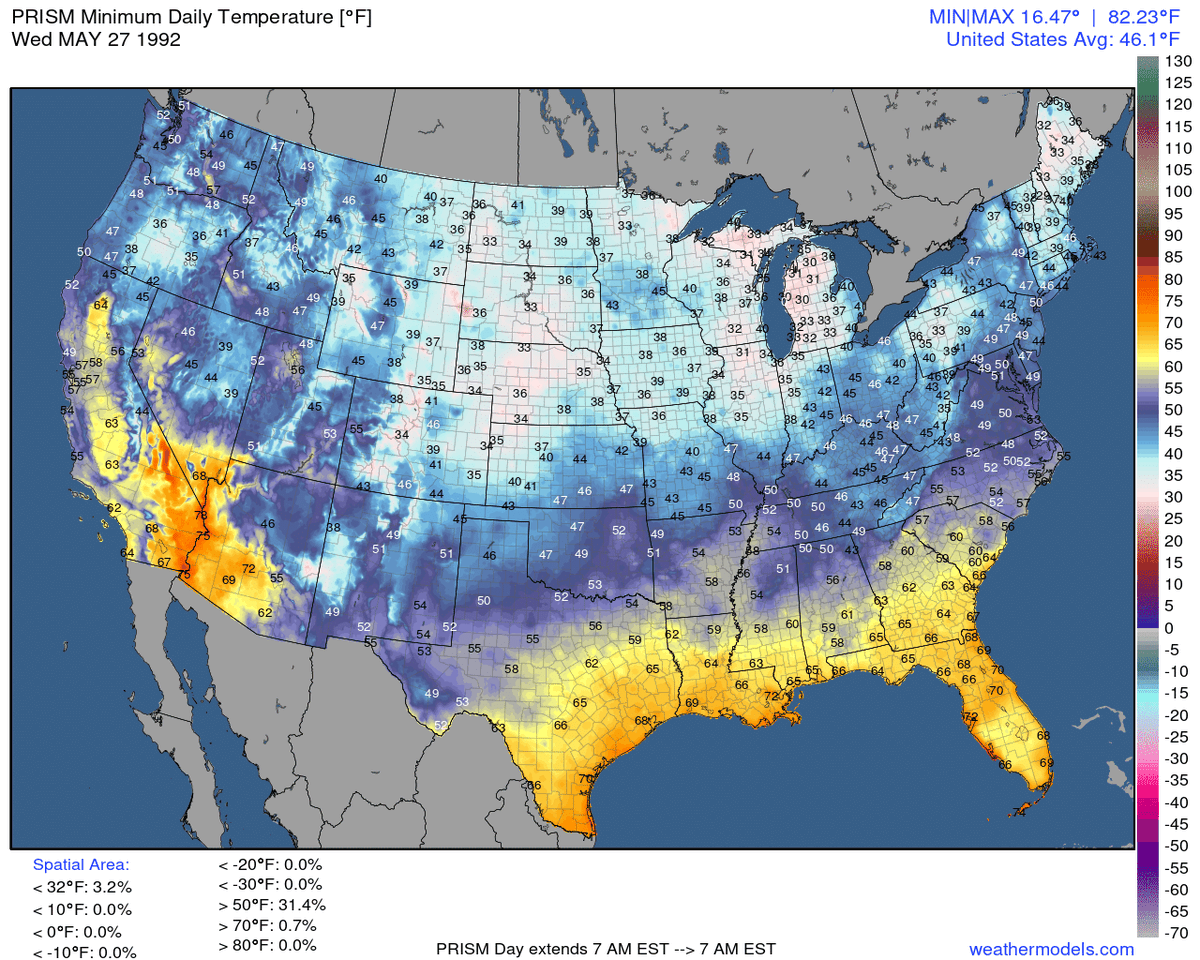
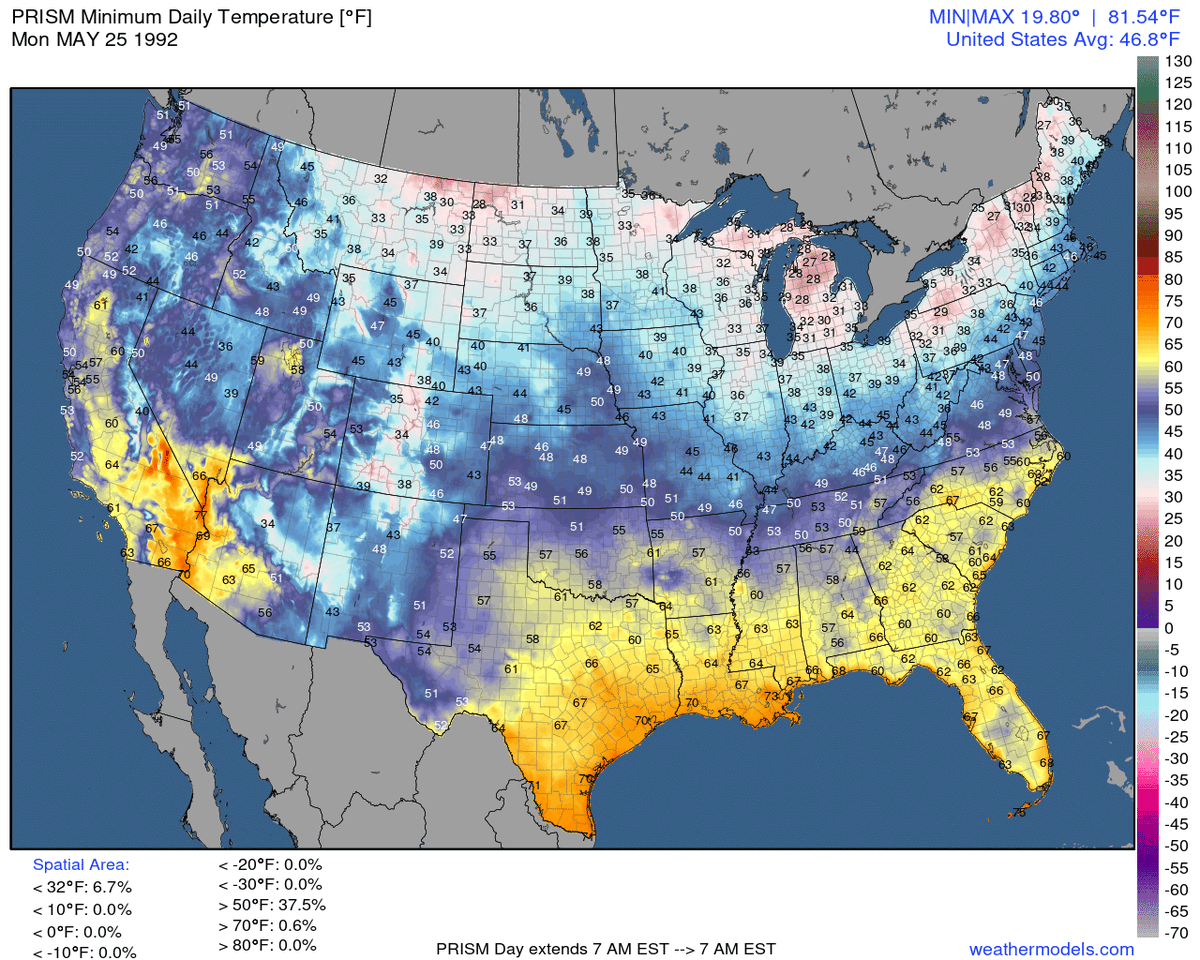
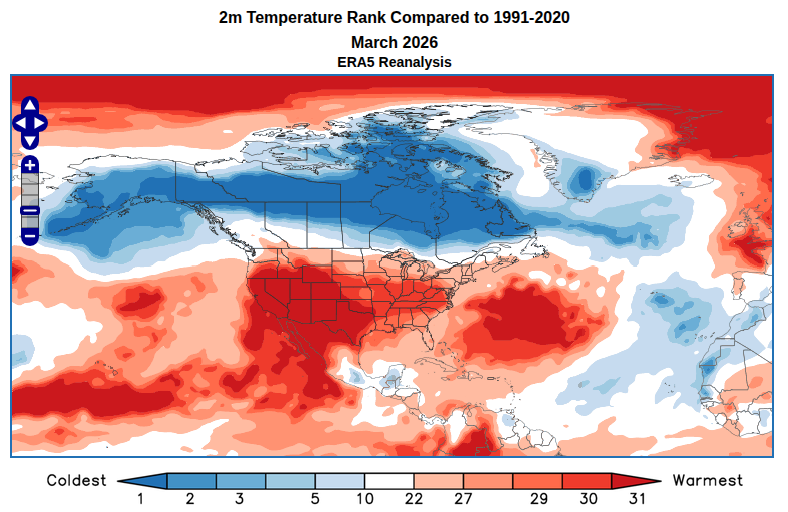
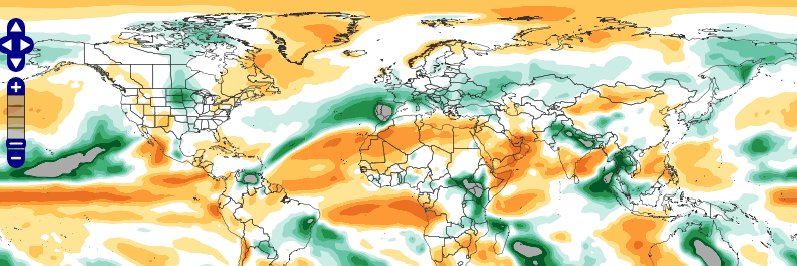
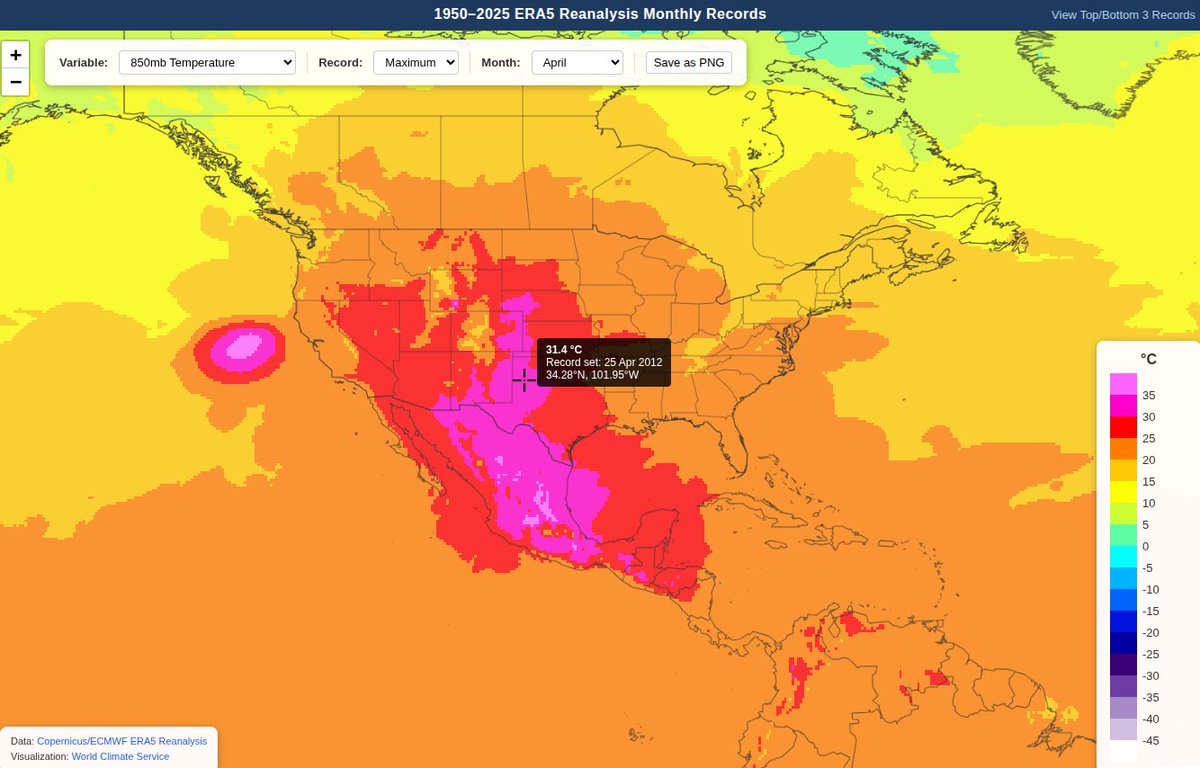
World Climate Service

2.4K posts

World Climate Service banner
World Climate Service

World Climate Service

@WorldClimateSvc

Insight and tools for long-range forecasting: objective seasonal and subseasonal prediction. Tweets by Prescient Weather cofounder Richard James, PhD

State College, PA Katılım Ocak 2018
1K Takip Edilen9.7K Takipçiler
World Climate Service
World Climate Service@WorldClimateSvc·
Daily Niño3.4 SST anomaly: 0.00 The transition is under way. However, the relative index (rNiño3.4) still has some distance to go before reaching neutral.
World Climate Service tweet mediaWorld Climate Service tweet media
English
5
18
66
3.3K
Daan van den Broek
Daan van den Broek@Daaanvdb·
🇳🇱📉 Normvervaging 📉 De afgelopen winter werd door velen als 'koud' en 'sneeuwrijk' ervaren. Maar kijk je naar de cijfers, dan was de winter allesbehalve uitzonderlijk. Op één aspect na: de sneeuw. ❄️❄️ Of… was ook dat minder uitzonderlijk dan het leek? 🧵(1/9)
Nederlands
5
3
16
6.7K
World Climate Service
World Climate Service@WorldClimateSvc·
Unlike everywhere else in the sub-Arctic oceans, late winter sea ice is well above normal in the Bering Sea near Alaska. The ice extent near Alaska is comparable to 2012 - the year of the Arctic-wide record ice minimum in September.
World Climate Service tweet mediaWorld Climate Service tweet mediaWorld Climate Service tweet mediaWorld Climate Service tweet media
English
1
9
45
4.9K
World Climate Service
World Climate Service@WorldClimateSvc·
It is rather remarkable that we've seen a major reversal of the 10mb 60°N westerly wind (U10/60) in March five years in a row. From 1958-2021, this only happened in 28% of years Two previous clusters were 1974-76 and 1984-86: both triple-dip cool ENSO phases after a big El Niño
World Climate Service tweet media
English
2
17
80
7.5K
World Climate Service
World Climate Service@WorldClimateSvc·
In terms of magnitude, the upcoming historic western U.S. heat wave is reminiscent of March 2012. That episode certainly set the stage for the Midwest heat and drought of summer 2012. Is the U.S. West in for a torrid summer? Answers in our preliminary summer forecast next week
World Climate Service tweet mediaWorld Climate Service tweet mediaWorld Climate Service tweet media
English
1
12
102
55.6K
Meteomodel ☀️🌿🌿
Meteomodel ☀️🌿🌿@PogodaMeteo·
@WorldClimateSvc I was wondering – I don’t think these maps are available on your website, right? One probably has to pay for them, correct? 😀
English
1
0
0
19
World Climate Service
World Climate Service@WorldClimateSvc·
Google's WeatherNext2 model is well ahead of not only ECMWF IFS but also AIFS-ENS. Extremely impressive medium-range performance in 2025 realtime forecasts. Available for experimental inter-model comparison on our platform now.
World Climate Service tweet mediaWorld Climate Service tweet mediaWorld Climate Service tweet mediaWorld Climate Service tweet media
English
5
21
118
11.9K
World Climate Service
World Climate Service@WorldClimateSvc·
Comparing today's ECMWF SEAS5 forecast to the forecast from 3 years ago, the El Niño signature for summer is certainly stronger, as many have noted. But the real contrast can be seen in 200mb VP, which shows a dramatically more intense El Niño circulation than in 2023.
World Climate Service tweet mediaWorld Climate Service tweet mediaWorld Climate Service tweet mediaWorld Climate Service tweet media
English
13
77
318
59K
Brian Bledsoe 🐊
Brian Bledsoe 🐊@BrianBledsoe·
@WorldClimateSvc Richard, what is your current PDO value? I know NCEI is at -1, but knows that your's runs less negative...
English
2
0
1
2.4K
Simon Kuestenmacher
Simon Kuestenmacher@simongerman600·
I am always on the lookout for data showing the real impact of AI on the world around us. This chart shows that since ChatGPT launched the monthly count of Stack Overflow questions declined dramatically. Please point me to more chart showing the real impact of AI (anything from energy use to job losses or quirky stuff). Source: reddit.com/r/dataisbeauti…
Simon Kuestenmacher tweet media
English
6
7
34
7.1K
World Climate Service retweetledi
Andy Hazelton
Andy Hazelton@AndyHazelton·
I threw together a quick plot from the data here (cpc.ncep.noaa.gov/products/analy…). The February upper ocean heat values across the Pacific were higher than all of the recent Niños at this point. The only comparable one was the Super Niño of 1997. Obviously there's still some uncertainty as to just how strong this Niño will get, but the subsurface gives us reason to think it may be a pretty strong event.
Andy Hazelton tweet media
Paul Roundy@PaulRoundy1

cpc.ncep.noaa.gov/products/analy… This may be the strongest east Pacific subsurface warm anomaly ever observed by March 1.

English
8
17
61
10.4K
Vincent Ledvina
Vincent Ledvina@Vincent_Ledvina·
@wxmann We’ve had one of the coldest and snowiest winters on record so far.
English
1
0
7
643
World Climate Service
World Climate Service@WorldClimateSvc·
Winter returns to Alaska - with a vengeance. -48°F in Fairbanks is the coldest this late in the winter since 1956. Aurora watchers are shivering
World Climate Service tweet media
English
2
5
20
2.5K
World Climate Service
World Climate Service@WorldClimateSvc·
@WeatherProf Thanks! I chose the AIFS for comparison because it's essentially the same model (ERA5-trained) and same grid. Higher resolution models or analyses tend to have lower central pressure.
English
0
0
0
132
World Climate Service
World Climate Service@WorldClimateSvc·
We'll see where ERA5 comes in, but it does look like the Blizzard of '26 was setting new monthly low MSLP records well to the south of New England this morning 969 vs ~972 mb (1950-2025 comparison)
World Climate Service tweet mediaWorld Climate Service tweet media
English
2
1
28
4.3K