ZoomCharts

1.2K posts

ZoomCharts banner
ZoomCharts

ZoomCharts

@ZoomCharts

Drill Down Visuals for #PowerBI and JavaScript Charts Library for #DataExploration

Europe Katılım Şubat 2014
2.5K Takip Edilen1.4K Takipçiler
ZoomCharts
ZoomCharts@ZoomCharts·
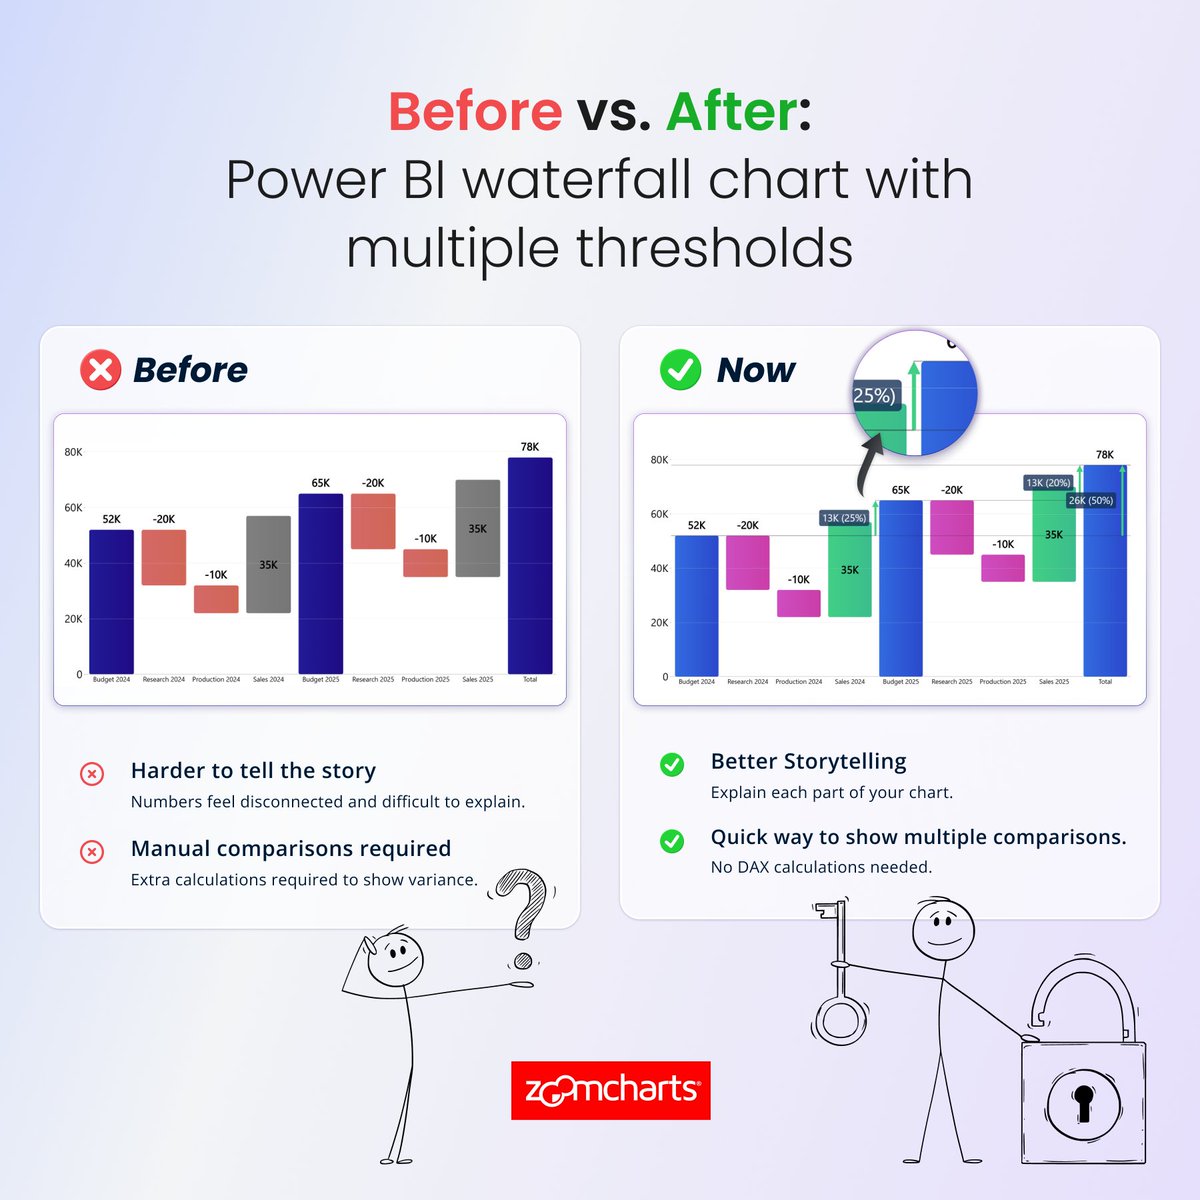
Can you build an Executive KPI report that a board actually uses? Read the guide, download the dataset, and try to build Executive KPI analysis report for board members. 📖 Build guide: zoomcharts.com/en/microsoft-p…
ZoomCharts tweet media
English
0
2
3
3.5K
ZoomCharts
ZoomCharts@ZoomCharts·
ZoomCharts turns 13! 🎂 From a JS charts library in 2013 to 24 Power BI visuals, 25K+ companies, 100+ countries, and 1,000+ report builders in our community. Grateful for everyone who has been part of this. Not slowing down. 🚀 #ZoomCharts #PowerBI #DataVisualization
ZoomCharts tweet media
English
0
0
4
64
ZoomCharts
ZoomCharts@ZoomCharts·
Only 25-30% of employees regularly use BI tools. Not because the data isn't there. Because the experience of getting to that data drives people away. Go deeper 👇 zoomcharts.com/en/microsoft-p…
English
0
0
1
32
ZoomCharts
ZoomCharts@ZoomCharts·
Thank you for the feedback on the new breadcrumbs feature, which is available in Drill Down Donut, Pie, Combo, Combo Bar, Line, and Waterfall visuals for Power BI!
ZoomCharts tweet media
ninaikpe@ninafrancez1

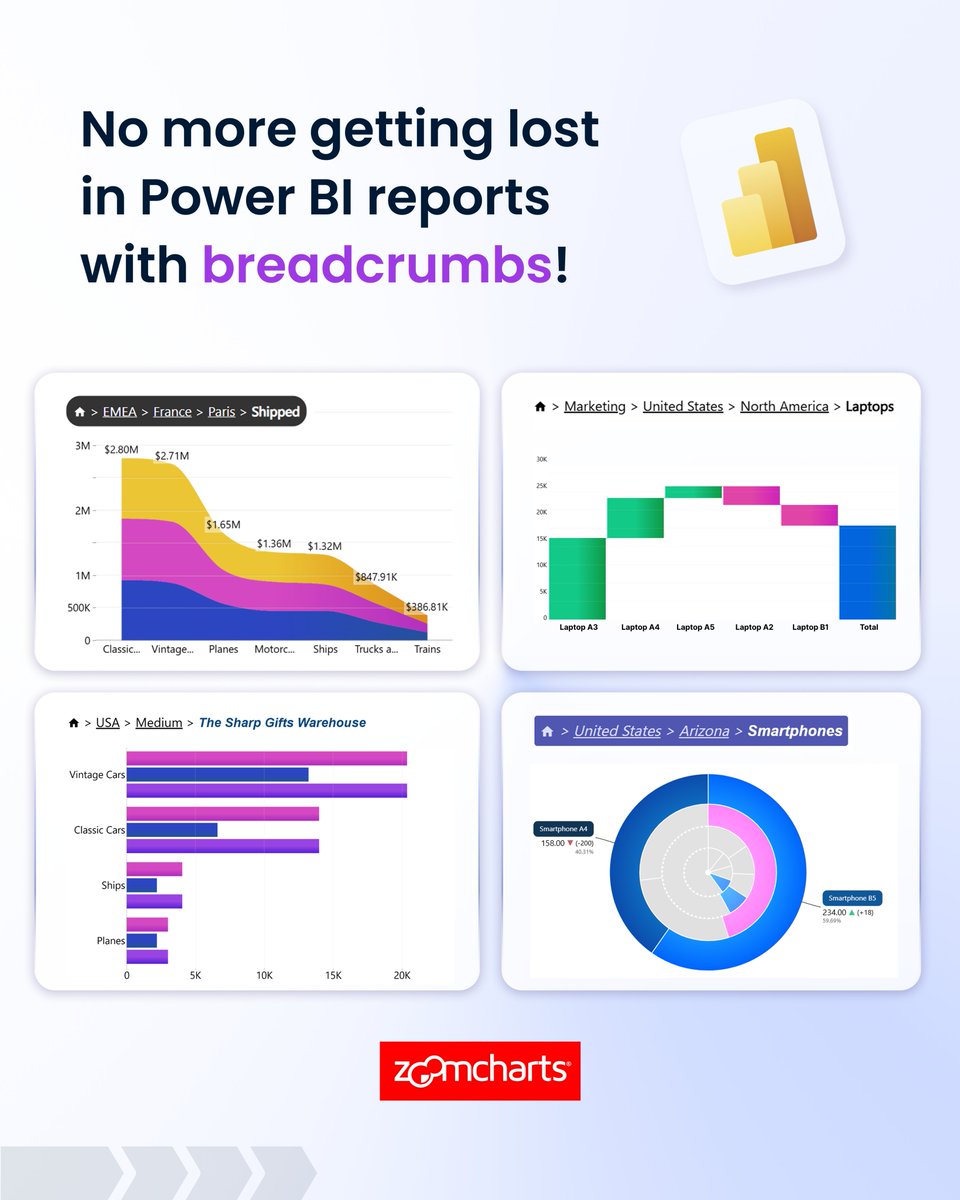
Just trying out the new @ZoomCharts breadcrumb feature. What I can say is; that was very thoughtful...Thank you. Zoomcharts - always looking for ways to improve data visualization and user experience.

English
1
0
2
115
ZoomCharts
ZoomCharts@ZoomCharts·
New Power BI Reporting Challenge⚡ Improve your Power BI data visualization skills and demonstrate strong professional credibility. Register to 4U Report Challenge and get Executive KPI Dataset: zoomcharts.com/en/microsoft-p…
ZoomCharts tweet media
English
0
1
2
179
ZoomCharts
ZoomCharts@ZoomCharts·
Push your limits! 💥 A brand new Power BI Report Challenge by ZoomCharts is coming your way, and pre-registration is now open. 👉 Pre-register here: zoomcharts.com/en/microsoft-p…
GIF
English
0
0
2
51
ZoomCharts
ZoomCharts@ZoomCharts·
No more getting lost in Power BI drill-down levels with breadcrumbs! Fully understand the hierarchy of your data, and simply click a breadcrumb to navigate across levels. #PowerBIVisuals
ZoomCharts tweet media
English
0
0
3
132
Inemesit Archibong
Inemesit Archibong@Inem_arch·
Hi #DataFam Been a little quiet lately. Sometimes you feel lazy. Sometimes progress slows down. But the important thing is getting back up and moving again. I finally completed my Pharmacy Sales & Profitability Dashboard Slow progress is still progress. #DataAnalytics #PowerBi
Inemesit Archibong tweet mediaInemesit Archibong tweet mediaInemesit Archibong tweet media
English
11
8
84
1.7K
ZoomCharts
ZoomCharts@ZoomCharts·
40 Power BI Sales Pipeline Reports 👏 The submissions are in for the FP20 Analytics Challenges Group & ZoomCharts Data Challenge 35, Now it’s time to explore all 40 submissions and support your favorite designs. 🔍 Explore all submissions here: zoomcharts.com/en/microsoft-p…
ZoomCharts tweet media
English
0
1
5
97
ZoomCharts
ZoomCharts@ZoomCharts·
Incredible dark report design collection! 🌟 These reports were created by some of the strongest Power BI developers in the community and are packed with interactive ZoomCharts Drill Down PRO visuals. Check out these great designs: linkedin.com/pulse/14-power…
English
0
0
3
68
ZoomCharts retweetledi
ninaikpe
ninaikpe@ninafrancez1·
Hi #datafam The FP20 Analytics x @ZoomCharts Challenge 35 is ongoing - Submission deadline: Mar 10th And I'm excited to be joining this round as a Guest Judge. Looking forward to seeing insights brought to life through data Join Challenge 👉 shorturl.at/Zrora #PowerBI
ninaikpe tweet media
English
2
7
12
689
ZoomCharts
ZoomCharts@ZoomCharts·
Power BI Tooltip Style Customization ✨ Match tooltips to your report and branding. ⚙️ Enable Customize Tooltip Style in Tooltip Settings 🎚️ Style headers, colors, rows, shadows & rounded corners Available in Timeline, TimeSeries, Combo, Combo Bar, Waterfall & Line visuals.
ZoomCharts tweet mediaZoomCharts tweet mediaZoomCharts tweet mediaZoomCharts tweet media
English
0
1
4
88
ZoomCharts
ZoomCharts@ZoomCharts·
Show multiple comparisons in a Power BI waterfall chart, no complex DAX required. 📊 Display value and percentage changes using arrows directly in the visual and keep everything in one clean waterfall, without calculations! #PowerBIVisuals #ZoomCharts
ZoomCharts tweet media
English
0
1
3
110
ZoomCharts
ZoomCharts@ZoomCharts·
⏳ 13 days left! The FP20 Analytics x @ZoomCharts February Challenge is still open 👇 🎯 Sales Pipeline Analytics dataset 🏆 Amazing prizes 💡 Need help or resources? DM me! Join here 👉 zoomcharts.com/en/microsoft-p…
ZoomCharts tweet media
English
0
1
2
89