Peller_DA📊

1.5K posts

Peller_DA📊 banner
Peller_DA📊

Peller_DA📊

@peller02

Data Analyst • Geospatial Analyst ( Remote Sensing and GIS, FUTA )

Osun, Nigeria Katılım Ağustos 2020
1.5K Takip Edilen962 Takipçiler
Sabitlenmiş Tweet
Peller_DA📊
Peller_DA📊@peller02·
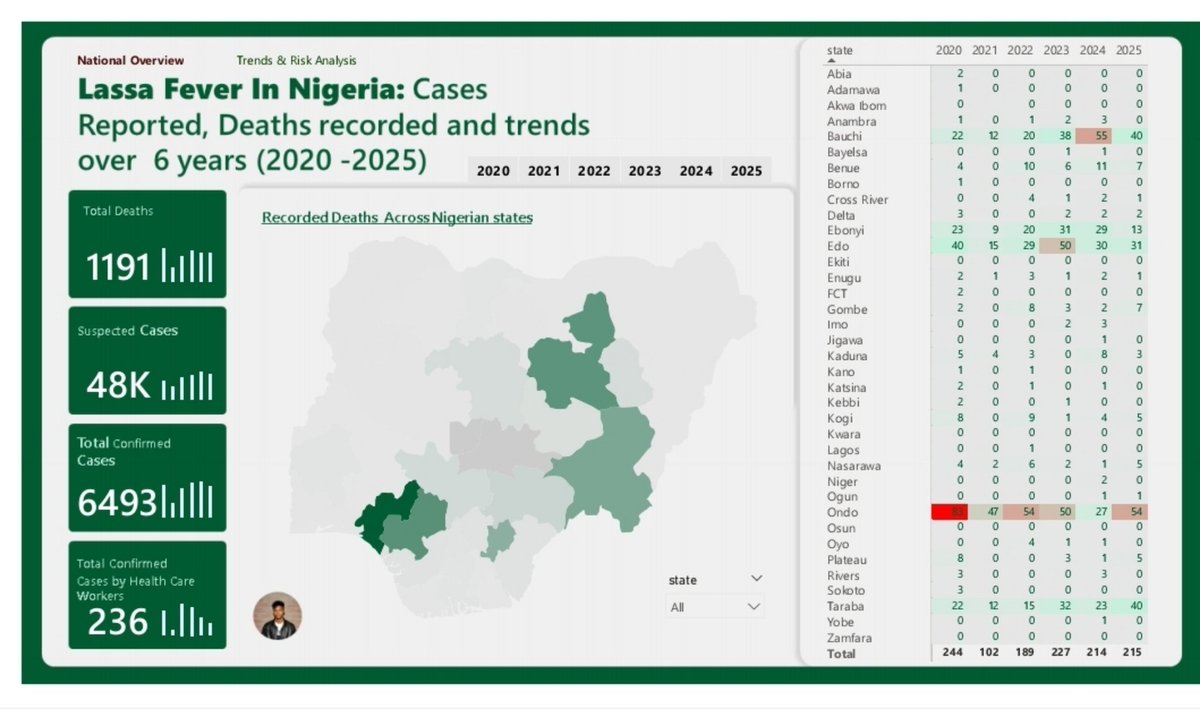
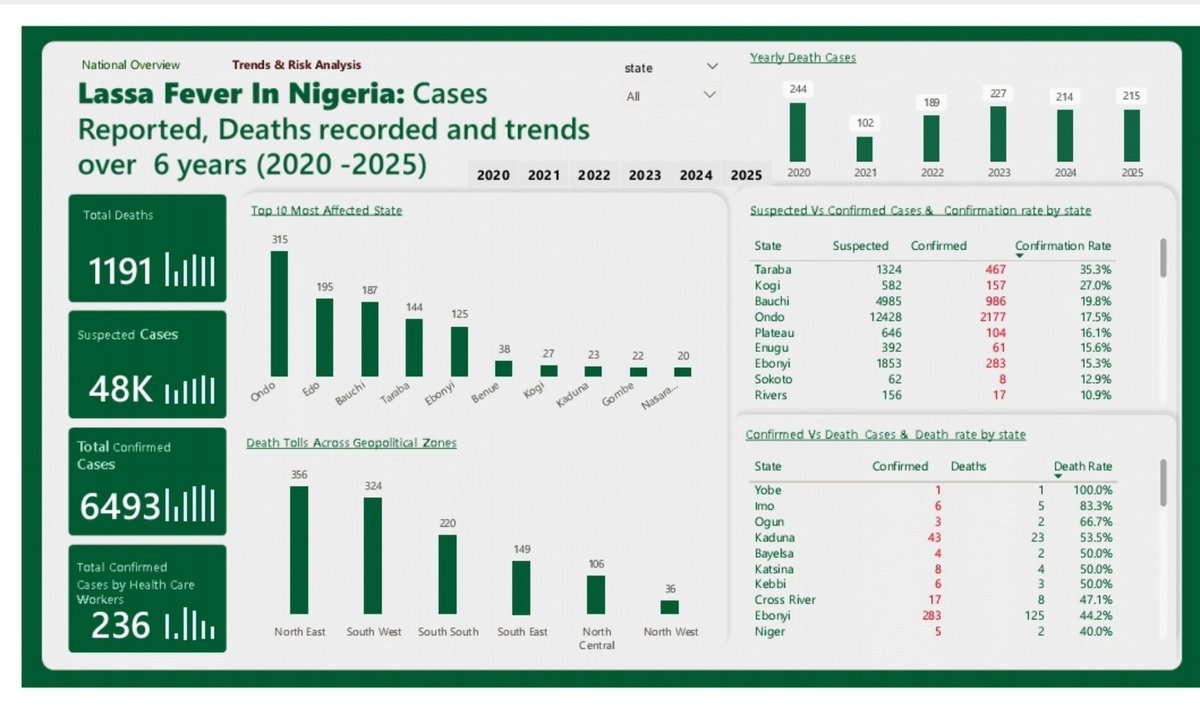
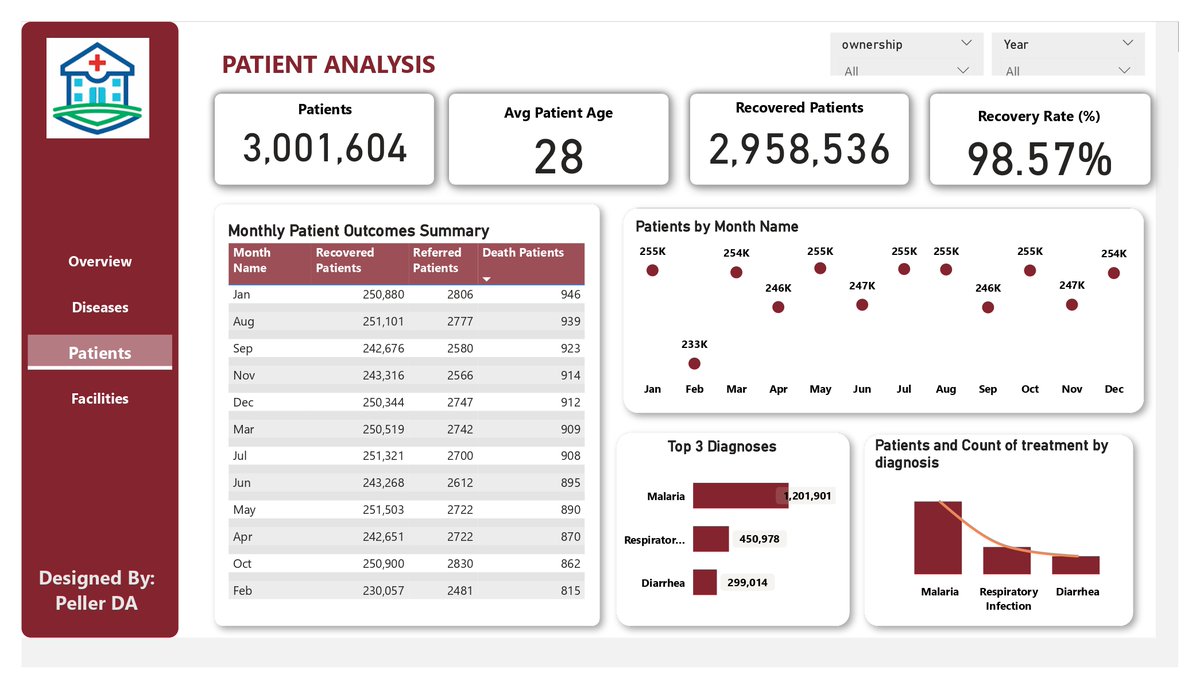
I built a multi-page Primary Health Centre (2023 & 2024) analytics dashboard to shift the conversation from how much to how fair. 🔸Executive Overview 🔸Disease Analysis 🔸Patient Analysis 🔸Facility Analysis Thanks to @shadesofsid for sharing the datasets
Peller_DA📊 tweet mediaPeller_DA📊 tweet mediaPeller_DA📊 tweet mediaPeller_DA📊 tweet media
English
33
41
255
7.6K
vivian
vivian@vheeorji22·
How to screenshot on a laptop???😭 This is really frustrating 😭
English
41
4
64
8.5K
Peller_DA📊
Peller_DA📊@peller02·
I shall be the head and not the tail 😂 In pandas, we all know: df.head() will shows the first 5 rows But what if you want the bottom view? Meet the quiet one: df.tail() that will give you the last 5 rows 📊 Don’t ignore the tail 😉
English
0
0
1
36
GEAPSEAN | Data Guy
GEAPSEAN | Data Guy@geapsean·
@vheeorji22 I'm yet to start learning SQL Seeing people saying EXCEL is hard, I think SQL should be easy, cos I don't think Excel is hard. Maybe technical, but not hard.
English
1
0
3
901
vivian
vivian@vheeorji22·
What's harder to learn? A. Excel B. SQL C. Python D. All of the above 😭
English
70
12
168
21.7K
Peller_DA📊
Peller_DA📊@peller02·
@AL_MEEZANYY That's the best approach man. After that you will now sort the month in Ascending order 🤞
English
0
0
1
16
Faruoq
Faruoq@AL_MEEZANYY·
I encountered this challenge in Power BI, whereby months are sorted alphabetically instead of following the normal month order. The solution to this is to create a month number column in the calendar table, and use the "Sort by Column" tab to fix this. learning while building ✌️
Faruoq tweet media
English
8
2
11
453
J.A Olaoye
J.A Olaoye@JA_Olaoye·
I want to know my active Followers and I want to follow all my active followers I have not been following. The clean up is necessary. TODAY IS THE DAY.
English
14
5
26
468
Peller_DA📊
Peller_DA📊@peller02·
I've always been the data guy. Raw data, real insights, no fluff. But there's a side of me my timeline hasn't fully seen yet: geospatial. I developed this thematic map to visualize how U.S. travel policies are distributed across African countries, categorizing each nation.
Peller_DA📊 tweet media
English
2
0
10
133
Manohar Reddy
Manohar Reddy@Manohargc2650·
@peller02 Is it necessary to put all the dashboards in a single page? It makes me confused rather than clarity
English
1
0
0
2
Peller_DA📊
Peller_DA📊@peller02·
I'm Peller_DA 📊 A Data Analyst who transforms data into actionable insights. I reveal the trends and patterns hidden inside your rows and columns (databases). When data solves your problem, everyone wins. Productive week #Datafam
Peller_DA📊 tweet mediaPeller_DA📊 tweet mediaPeller_DA📊 tweet media
English
22
28
204
5K
Nikhil | Data Analytics
@peller02 That makes sense 💯 KPI + business goal alignment is something I’m trying to understand better. I’ll also start using data dictionary more. Appreciate this insight!
English
1
0
1
6
Inemesit Archibong
Inemesit Archibong@Inem_arch·
Hi #DataFam Been a little quiet lately. Sometimes you feel lazy. Sometimes progress slows down. But the important thing is getting back up and moving again. I finally completed my Pharmacy Sales & Profitability Dashboard Slow progress is still progress. #DataAnalytics #PowerBi
Inemesit Archibong tweet mediaInemesit Archibong tweet mediaInemesit Archibong tweet media
English
11
9
89
1.6K
Peller_DA📊
Peller_DA📊@peller02·
@nikku762 Thank you very much. Mainly Your KPIS should goal alignment. Also, having general understanding of the datasets will help a lot. Most of my KPIS Inspo do come while reading the Data dictionary. Finally, AI can also help you with that and also in alignment with business goal.
English
1
0
1
15
Nikhil | Data Analytics
@peller02 Really clean dashboards 🔥 I like how the insights are clearly presented. I’m learning Power BI — how do you choose the right KPIs for a project?
English
1
0
0
20
Peller_DA📊 retweetledi
Chidi Ebere
Chidi Ebere@chidirolex·
Most data analysis projects don’t fail because of tools; they fail because of poor structure. That’s where the CRISP-DM framework comes in. The CRISP-DM (Cross-Industry Standard Process for Data Mining) framework provides a structured approach to solving data problems, from understanding the business to delivering actionable insights. It consists of six key stages: 1. Business Understanding Define the problem, objectives, and what success looks like. 2. Data Understanding Explore the data, identify patterns, and assess data quality. 3. Data Preparation Clean, transform, and structure the data for analysis. 4. Modelling Apply analytical or machine learning techniques to solve the problem. 5. Evaluation Validate results against business objectives. Does this actually solve the problem? 6. Deployment Present insights, build dashboards, or integrate models into business processes. The real value of CRISP-DM is not just the steps, it’s the iteration. You move back and forth between stages until the solution is truly aligned with the business need. If you’re working on dashboards, predictive models, or business analysis, this framework keeps your work focused and impactful. Are you using a structured approach like CRISP-DM in your projects? #DataAnalytics #CRISPDM
Chidi Ebere tweet media
English
2
7
19
544
Olúwabùkúnmí
Olúwabùkúnmí@FunshoRey·
@JA_Olaoye good morning sirr I wrote an article on Database optimization. kindly give it a read and would appreciate your insight @oluwabukunmi_/why-your-bi-dashboard-is-slow-and-what-professionals-do-about-it-bf9fb8995e0d" target="_blank" rel="nofollow noopener">medium.com/@oluwabukunmi_
English
1
2
6
874
J.A Olaoye
J.A Olaoye@JA_Olaoye·
Some of the reasons Most Data Analysts struggle to get opportunities. Not because they lack skills. Because they don’t know how to sell them. The hard truths: 1. Stop listing tools. Start solving problems. 2. Projects don’t impress. Outcomes do. (You must own the project and explain it in detail) 3. Pick a niche early. Generalists get ignored.*** 4. If a manager can’t understand you, you’re not useful yet. 5. Sell small first. One dataset. One insight. One win. Data is not the product. Clarity is. What’s your take on point 3?
English
8
9
46
1.4K
Femi The Analyst .
Femi The Analyst .@Femiforge·
I wanted to see the full picture. So I built a dashboard,so I tracked confirmed cases, deaths, and outbreak patterns across all 36 states and the FCT from 2020 to 2025. 1,191 dead. 48,000+ infected. 6 years. And the numbers aren't spiking anymore.The disease has settled in.
Femi The Analyst . tweet mediaFemi The Analyst . tweet mediaFemi The Analyst . tweet media
Femi The Analyst .@Femiforge

Do you know Something lives in your house. It doesn't pay rent. You've probably seen it , but you don't really care about it, But it has killed 1,191 Nigerians in six years. And tonight, it'll probably be in someone's kitchen.

English
14
13
65
2.1K