HOOPZ

508 posts

HOOPZ banner
HOOPZ

HOOPZ

@_H00PZ_

Focused on finding value the market is overlooking. Obsessed with project financials and Elliott Wave. Tweets are my opinions, not financial advice.

Melbourne Katılım Ekim 2020
194 Takip Edilen2.2K Takipçiler
Sabitlenmiş Tweet
HOOPZ
HOOPZ@_H00PZ_·
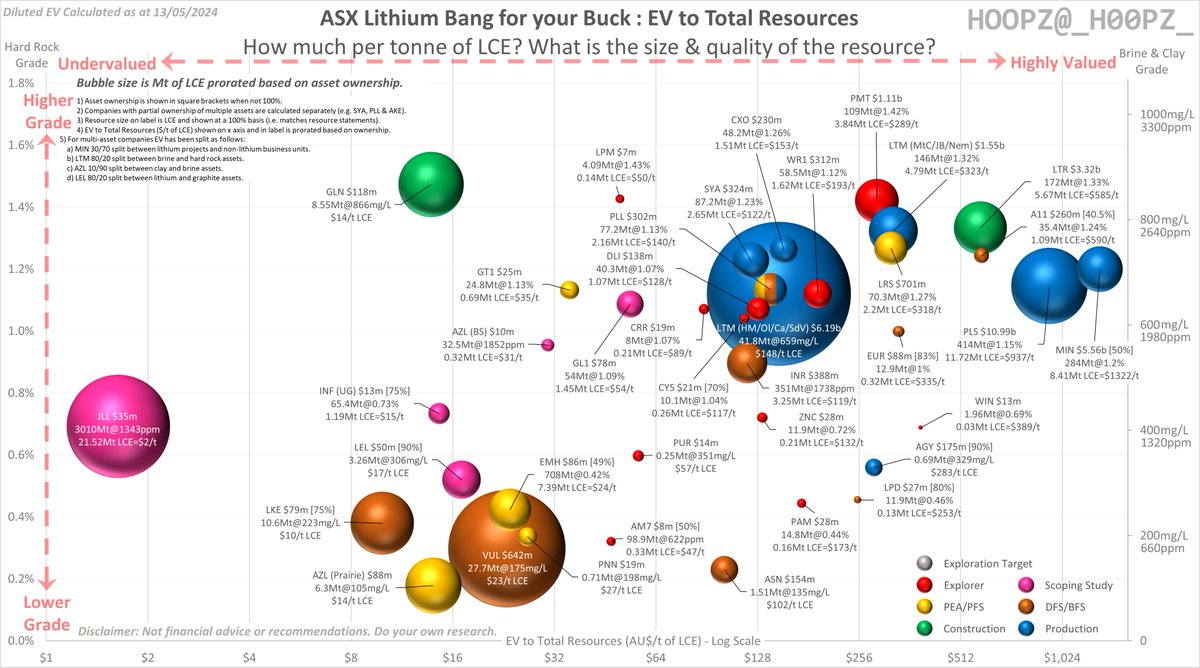
#Lithium Total Resources - ASX Bang for your Buck chart update: 1) $INR - Updated MRE for Rhyolite Ridge (30/4). 2) $CXO - Updated MRE for Finniss (11/4). 3) $GLN - Updated MRE for Hombre Muerto West (27/3). 4) $PLL - Updated for sale of ~12% SYA (22/2) 5) $MIN - Updated MRE for Mt Marion (21/2). 6) Removed $AVZ $AZS $LLL and $LPI. Updated M&I and Reserve charts included in the thread below 🧵👇. Note: This chart only includes ASX listed companies. ASX: #A11 $AGY #AM7 $ASN $AZL $CRR #CY5 $DLI $EMH $ENC $EUR #GL1 #GT1 $INF $JLL $LEL $LKE $LPD $LPM $LRS $LTM $LTR $PAM $PLS $PMT $PNN $PUR $VUL $WIN #WR1 $ZNC
HOOPZ tweet media
English
8
7
50
7.5K
HOOPZ
HOOPZ@_H00PZ_·
@mondyinvest @agroasx A buy with 5 years of losses ahead of it assuming we have 40-60% oversupply over that period like they are forecasting? That doesn't make sense to me.
English
1
0
2
199
mondy
mondy@mondyinvest·
@_H00PZ_ @agroasx It depends on how individual stocks perform relative to their PT’s, which factor in their bearish outlook. - In July they revised their $LTR 12mo PT down to ‘neutral’ $1.15 w/ stock trading at $0.95 - Given it’s recently been in the low $0.60’s, they could now call it a buy?
English
1
0
0
286
AGRO
AGRO@agroasx·
Funny how Citi and GS whom were both fairly bearish on lithium outlook now come out with buy ratings across a number of companies #asx
English
8
7
68
5.8K
HOOPZ
HOOPZ@_H00PZ_·
@mondyinvest @agroasx Well... given GS say we will be oversupplied by 40-60% until after 2028 you would expect them to be bearish for some time yet wouldn't you? Maybe 2027 at least???
English
1
0
1
192
mondy
mondy@mondyinvest·
@agroasx Just a wild stab in the dark, but it might be something to do with said #lithium stocks all being down 30-70% over the past year… Citi & GS ain’t gonna stay bearish forever?
English
2
0
9
903
HOOPZ
HOOPZ@_H00PZ_·
@drauwsy @CarlCapolingua For some reason you are ignoring the big red arrow on the chart which is predicting continued reduced growth. If that's not what it was implying why is it there? It's designed to provoke an emotive response in the reader. Only GS could make the 37% growth rate in 2023 sound bad.
English
0
0
0
37
Daniel Rau
Daniel Rau@drauwsy·
@_H00PZ_ @CarlCapolingua Nowhere in the graph does GS claim sales would grow less than 400K y/y in Q4 2023. They simply reported through Q3 2023 and show no forward demand forecast. I do not understand how or why you are drawing these conclusions.
English
1
0
0
47
Carl Capolingua
Carl Capolingua@CarlCapolingua·
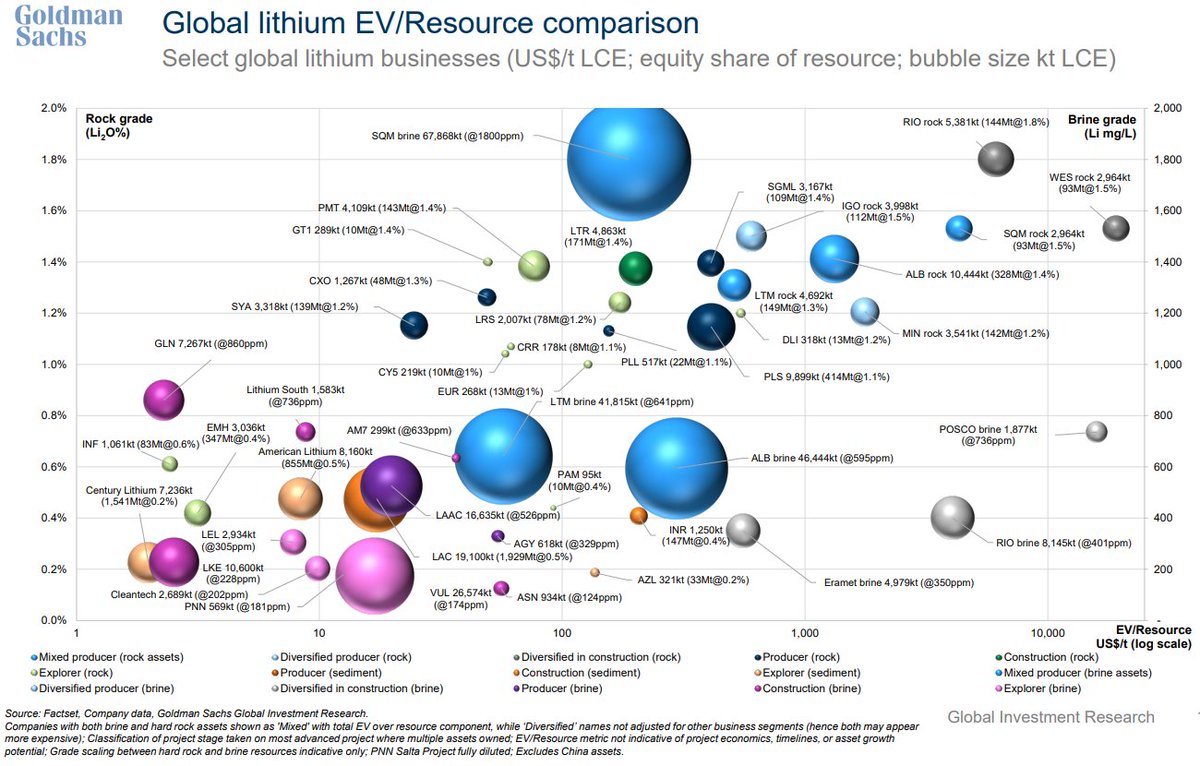
🚨 Goldman Sachs #Lithium Resource Comparison 🧐 #ASX Li Coverage 🔎: ✅ BUY = $IGO (PT $6.35) ⚖️ NEUTRAL = $LTM (PT $5.60); $LTR (PT $1.15); $CXO (PT $0.08); $MIN (PT $43) $ALB $SQM $LAC $PLS $PMT $INR $PLL #GT1 $VUL
Carl Capolingua tweet media
English
6
14
68
14.5K
HOOPZ
HOOPZ@_H00PZ_·
@drauwsy @CarlCapolingua There is a huge difference between being lucky and being right. Especially when you have the size/platform to move markets. In this situation you get to make your own luck. 1st work out how you want to be positioned. 2nd work out how you want to justify it. And it shows.
English
0
0
0
117
HOOPZ
HOOPZ@_H00PZ_·
@drauwsy @CarlCapolingua In the chart they said that sales would GROW less than 400k units in Q423 (and beyond), whereas they grew by almost 800k. This means their forecasted demand from the largest auto market in the world, was out by almost 100%! Wrong by 100% just 4 weeks after they published.
English
2
0
0
125
HOOPZ
HOOPZ@_H00PZ_·
@drauwsy @CarlCapolingua Except the grade scaling between hard rock and brine is not really "indicative" of anything. Other than their poor understanding of the sector. It reminds me of when they tried to suggest that China EV demand was falling off a cliff. Left is their chart, right is what happened:
HOOPZ tweet media
English
1
1
8
408
Daniel Rau
Daniel Rau@drauwsy·
@_H00PZ_ @CarlCapolingua Yes, And because GS anticipated people might incorrectly draw conclusions they were kind enough to include these quotes at the bottom of the chart: “EV/Resource metric not indicative of project economics” “Grade scaling between hard rock and brine resources indicative only”.
English
1
0
0
139
HOOPZ
HOOPZ@_H00PZ_·
@drauwsy @CarlCapolingua So the reader of the chart is responsible for understanding that while it is a "comparison" chart which compares size, grade and EV/Resource, that half the data on the chart can't be compared to the other half? It is the fault of the reader if it is misunderstood?
English
1
0
3
112
HOOPZ
HOOPZ@_H00PZ_·
@drauwsy @CarlCapolingua Why does that matter? It doesn't change the fact that 1% Lithium Oxide in Hard Rock is not comparable at all to 1,000mg/L Li in Brine. It's a chalk and cheese comparison.
English
1
0
1
275
HOOPZ
HOOPZ@_H00PZ_·
@CarlCapolingua LOL... They are still equating 1% Lithium Oxide (Li₂O) in Hard Rock with 1,000mg/L Lithium (Li) in Brine. Why do they do this? Because 1% seems to match 1,000mg/L i.e. 1 = 1? It makes absolutely no sense to present the data like this. They have no idea about Lithium.
English
6
2
34
2.3K
HOOPZ
HOOPZ@_H00PZ_·
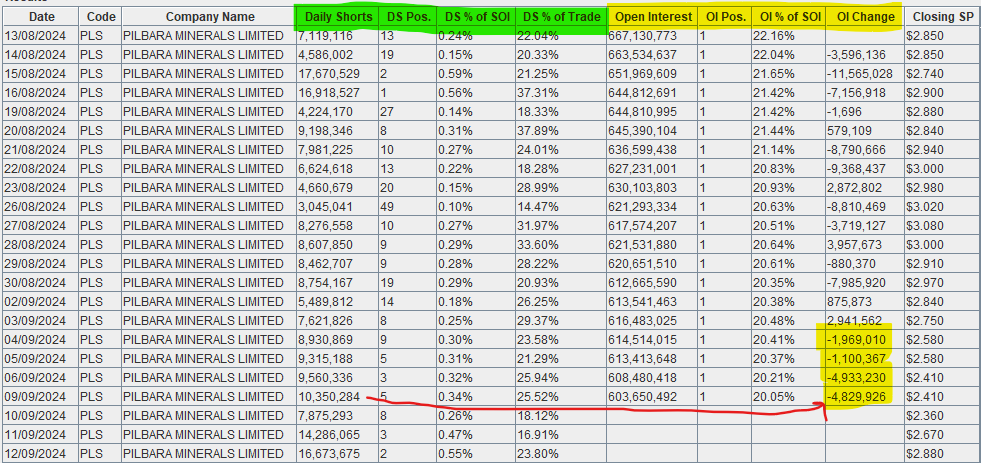
@yarra44 @ArmCEconomist @BjWeeks79 The above data shows that for the past 4 trading days (for which we have data) the short open interest reduced by ~13m shares. We only have open interest data up until the 9th of September. This is the same data you see on ShortMan.
English
1
0
3
270
HOOPZ
HOOPZ@_H00PZ_·
@yarra44 @ArmCEconomist @BjWeeks79 These numbers are not being added to the short position. The daily shorts report is just showing the volume traded short on that day. Most of that volume is actually covered on the same day which means the net change in short position is usually much less.
HOOPZ tweet media
English
1
0
3
263
HOOPZ
HOOPZ@_H00PZ_·
The numbers provided are fully diluted enterprise value (EV). It includes shares on issue (SOI), options (listed and unlisted), performance rights and also proposed issues that have not occurred yet (e.g. sometimes proposed issues are subject to shareholder approval which can delay the issue by a few months). EV also includes any cash and debt the company may have and capital raised but yet to hit the accounts. If you are not calculating MC or EV yourself from scratch (i.e. using notification of securities notices, proposed issue notices and statement of CDIs on issue (where appropriate)) then you probably have the wrong information. Basically I have not come across a single website that reports MC both accurately and timely. Most of the time it doesn't make much of a difference but sometimes it makes a huge difference (i.e. some stocks will be diluted 50%, 100% or even 200% once the options and proposed issues are complete). Let me know if you find any errors where you have calculated this figure yourself from scratch (i.e. not from a website). The reason why PMT's MC is reported so low on ASX focused websites is because they are only including the CDIs (Chess Depositary Interests) listed on the ASX and exclude the FPOs listed on the TSX (not to mention all options, warrants, and restricted units on the TSX which are included in the fully diluted MC or EV).
English
0
0
1
149
Ben Lamprecht
Ben Lamprecht@LamprechtBen·
@_H00PZ_ The Market Capitalisations of some of the Lithium companies seems to be way off, e.g. Patriot Battery Minerals & WR1. PMT's Canadian MCap is Cdn$1.56 billion being AU$1,7 billion. The calculation of their MCap reported by the ASX is a mystery. WR1's is AU232 mil, not AU$ 312 mil
English
1
0
0
214
HOOPZ
HOOPZ@_H00PZ_·
#Lithium Total Resources - ASX Bang for your Buck chart update: 1) $INR - Updated MRE for Rhyolite Ridge (30/4). 2) $CXO - Updated MRE for Finniss (11/4). 3) $GLN - Updated MRE for Hombre Muerto West (27/3). 4) $PLL - Updated for sale of ~12% SYA (22/2) 5) $MIN - Updated MRE for Mt Marion (21/2). 6) Removed $AVZ $AZS $LLL and $LPI. Updated M&I and Reserve charts included in the thread below 🧵👇. Note: This chart only includes ASX listed companies. ASX: #A11 $AGY #AM7 $ASN $AZL $CRR #CY5 $DLI $EMH $ENC $EUR #GL1 #GT1 $INF $JLL $LEL $LKE $LPD $LPM $LRS $LTM $LTR $PAM $PLS $PMT $PNN $PUR $VUL $WIN #WR1 $ZNC
HOOPZ tweet media
English
8
7
50
7.5K
HOOPZ
HOOPZ@_H00PZ_·
#Lithium Reserves - ASX Bang for your Buck chart update: 1) $SYA - Added ORE for Moblan (20/2). 2) Removed $AVZ $LLL and $LPI.
HOOPZ tweet media
English
1
4
18
2.2K
HOOPZ
HOOPZ@_H00PZ_·
#Lithium Measured & Indicated Resources - ASX Bang for your Buck chart update: 1) $INR - Updated MRE for Rhyolite Ridge (30/4). 2) $CXO - Updated MRE for Finniss (11/4). 3) $GLN - Updated MRE for Hombre Muerto West (27/3). 4) $PLL - Updated for sale of ~12% SYA (22/2) 5) $MIN - Updated MRE for Mt Marion (21/2). 6) Removed $AVZ $LLL and $LPI.
HOOPZ tweet media
English
3
1
20
2.2K
HOOPZ
HOOPZ@_H00PZ_·
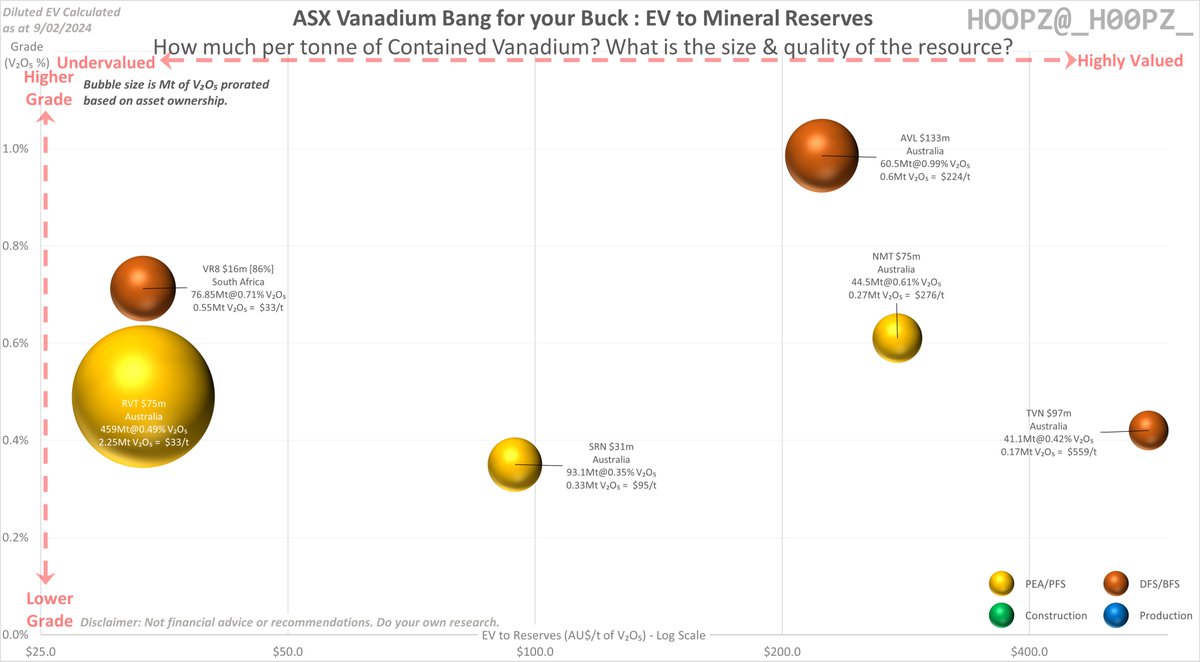
*NEW* #Vanadium Reserves - ASX Bang for your Buck Chart.
HOOPZ tweet media
English
1
0
4
1.3K
HOOPZ
HOOPZ@_H00PZ_·
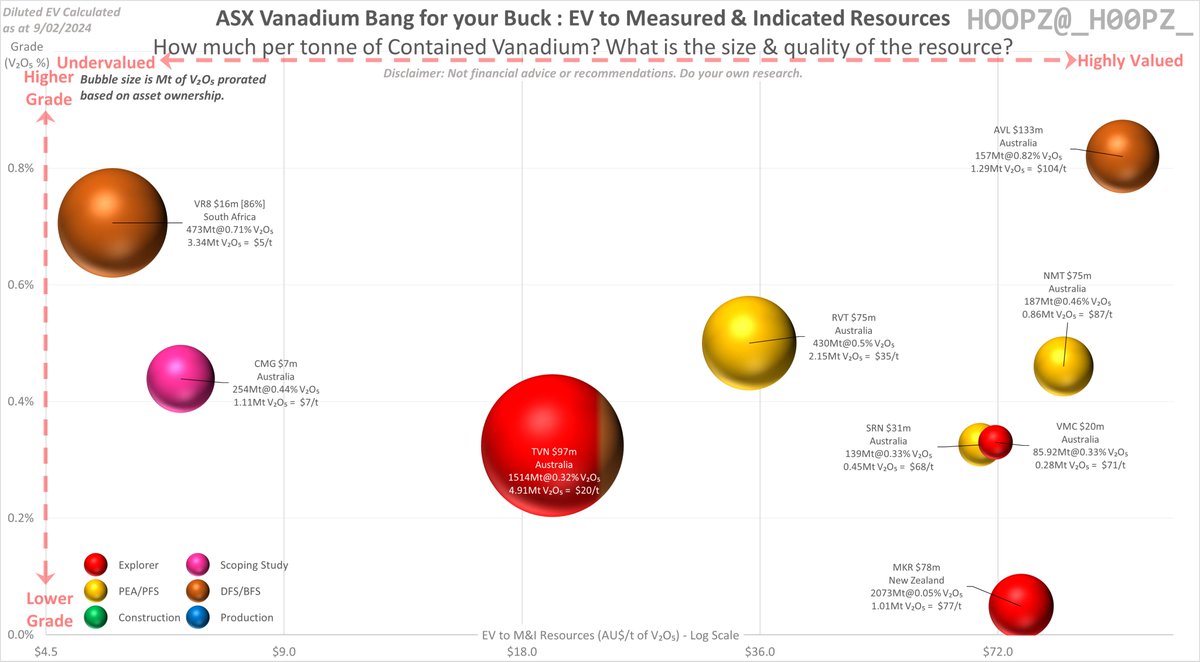
*NEW* #Vanadium Measured & Indicated Resources - ASX Bang for your Buck Chart.
HOOPZ tweet media
English
1
0
5
1.4K
HOOPZ
HOOPZ@_H00PZ_·
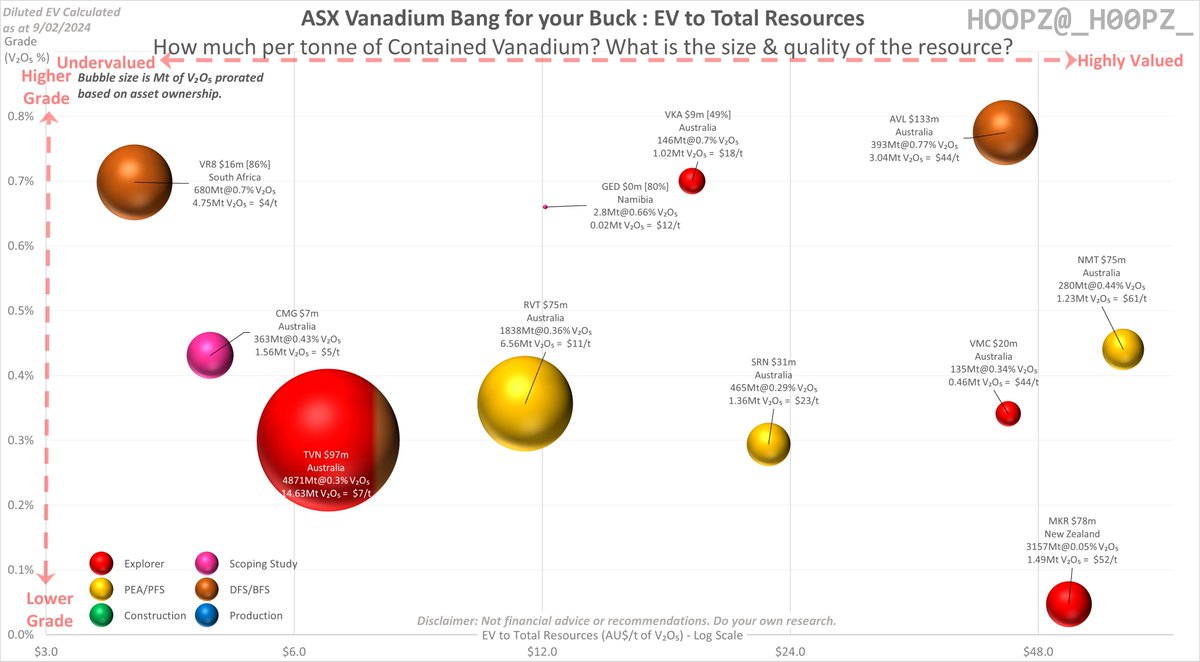
*NEW* #Vanadium Total Resources - ASX Bang for your Buck Chart. Bubble size reflects the size and ownership of the resource. Position on X axis shows fully diluted EV per tonne of contained vanadium. M&I and Reserve charts included in the thread below 🧵👇. Note: This chart only includes ASX listed companies. ASX: $AVL $CMG $GED $MKR $NMT $RVT $SRN $TOE $TVN $VKA $VMC #VR8
HOOPZ tweet media
English
3
6
30
4.6K
HOOPZ
HOOPZ@_H00PZ_·
@LarsHan12518223 Yes - everything else being equal. Higher grades usually translate to lower capex and opex.
English
1
0
1
103
Lars Hansen
Lars Hansen@LarsHan12518223·
@_H00PZ_ Just to be sure. Its best to be in the top, left corner. Highest grades and most undervalued - or am I missing something?
English
1
0
0
127
HOOPZ
HOOPZ@_H00PZ_·
#Lithium Reserves - ASX Bang for your Buck chart update: 1) $LTM - Merged Allkem and Livent resources.
HOOPZ tweet media
English
4
3
10
2.3K