Olórin 🧙‍♂️

1K posts

Olórin 🧙‍♂️ banner
Olórin 🧙‍♂️

Olórin 🧙‍♂️

@__Galathilion

Middle Earth📍| Enjoy Outdoors | Investment Guy | Tweets are not investment advice | “All we have to decide is what to do with the time that is given us”

Katılım Haziran 2021
809 Takip Edilen44 Takipçiler
Mason Home Builder
Mason Home Builder@bankertobuilder·
Cars are part of our families It’s time we started acting like it Introducing the living room garage Now available in select communities in the Houston suburbs
Mason Home Builder tweet media
English
33
23
587
38.5K
Olórin 🧙‍♂️
Olórin 🧙‍♂️@__Galathilion·
@MorePerfectUS cc: @joerogan you adamantly platformed MAHA and stood by this during the campaign. Speak out. People listen to you. Stand up, dude. This is horrible for Americans.
English
0
0
0
5
More Perfect Union
More Perfect Union@MorePerfectUS·
Today the EPA proposed repealing limits on multiple types of “forever chemicals” in drinking water. If finalized, the Trump administration proposal would end drinking water limits for four toxic PFAS.
English
86
1.6K
4.5K
863.7K
Olórin 🧙‍♂️ retweetledi
Judd Legum
Judd Legum@JuddLegum·
1. What I found in Trump's new 113-page financial disclosure report. It doesn't look good.
Judd Legum tweet media
English
160
2.8K
6.8K
363.1K
Olórin 🧙‍♂️
Olórin 🧙‍♂️@__Galathilion·
The amount of people who don’t know Jack Kimble is satire at this point is astonishing. It’s the usual suspects telling on themselves because they think a Democrat said this. It was actually Mike Johnson’s real statement about why Congress should be able to insider trade.
Rep. Jack Kimble@RepJackKimble

Just a friendly warning. We don’t even make $200k per year in Congress despite working nearly 140 days. If we aren’t properly compensated, a lot of us will go to the private sector and you will be left with some real idiots in Congress.

English
0
0
1
27
Olórin 🧙‍♂️ retweetledi
The Tennessee Holler
The Tennessee Holler@TheTNHoller·
“Your hat says ‘Trump was wrong about everything’ — it should say YOU are wrong about everything.” “That’s adorable. Burn! Pam Bondi wrote that for you?”
English
307
3.9K
30.7K
1.2M
Olórin 🧙‍♂️ retweetledi
Eric Hosmer
Eric Hosmer@TheRealHoz35·
Americas shortstop is on a heater
English
13
80
2.3K
74.6K
Olórin 🧙‍♂️
Olórin 🧙‍♂️@__Galathilion·
I love seeing the bull/bear arguments about DRAM and NAND taking place. I think both are wrong. I’m long $MU since 2023 to be transparent.
English
0
0
0
56
dandelion georgism 🔰🏗
dandelion georgism 🔰🏗@DolphinMossad·
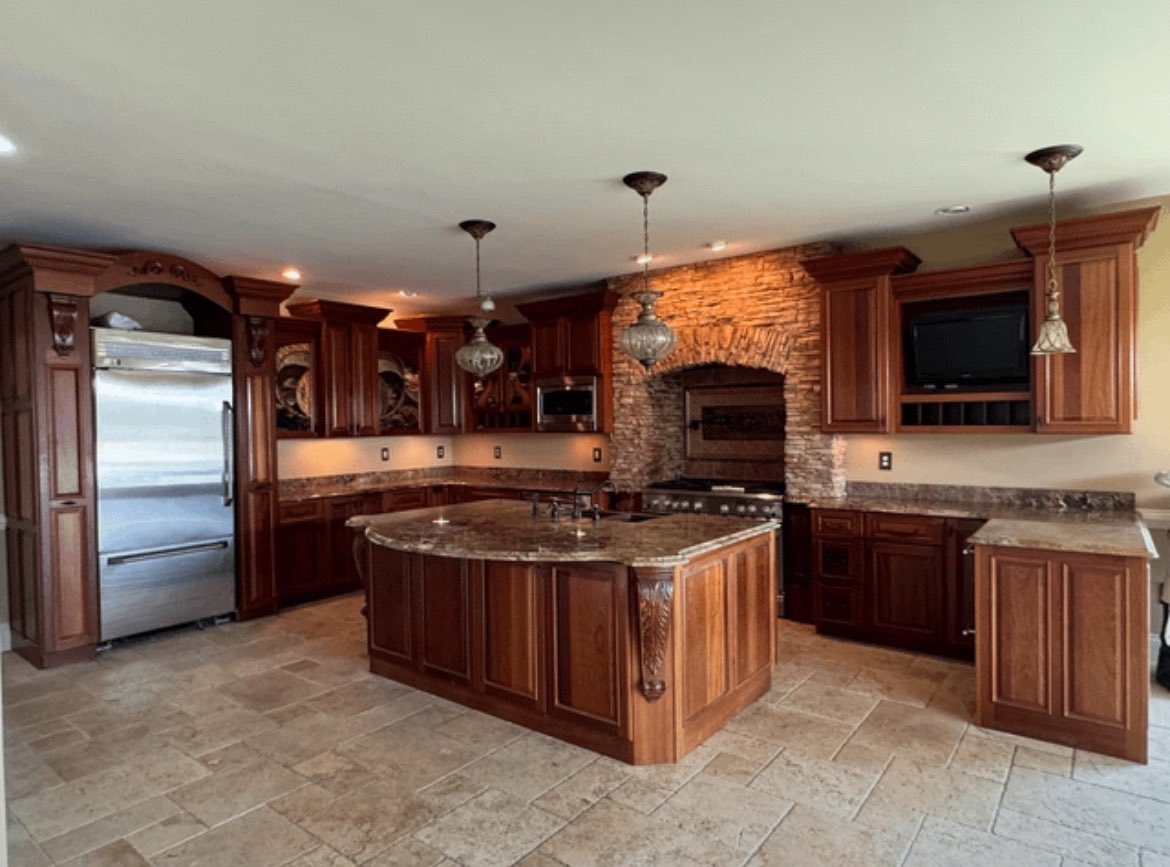
Incredible. The same kitchen leapfrogged from 2003 Bushcore McTuscan to 2020s millennial greige without at any point passing through good taste in between.
dandelion georgism 🔰🏗 tweet mediadandelion georgism 🔰🏗 tweet media
English
61
46
1.2K
121.7K
🅿️
🅿️@the_P_God·
Past a certain age moving to another Tier 3 city in the south to start over is a bad thing
🅿️ tweet media
English
33
75
6.6K
575K
Olórin 🧙‍♂️
Olórin 🧙‍♂️@__Galathilion·
@buccocapital I lay in the recliner in my daughter’s room every night I put her to bed, holding her while humming songs after we finish books. These toddler years will be gone too soon. Until then, that’s my place in the universe
English
0
0
0
13
BuccoCapital Bloke
BuccoCapital Bloke@buccocapital·
Sometimes my son gets scared at night. I lay down on his floor using a stuffed animals as a pillow, and he puts his hand out so I can hold it in mine. Every time now I know it might be the last time I get to do this so I hold on just a little bit tighter, not wanting to let go
English
63
21
2.1K
97.7K
Tuyo
Tuyo@itstuyo·
We created a card that sometimes doesn't charge you. Buy Now, Pay Maybe.
English
757
236
6.3K
15.9M
TheValueist
TheValueist@TheValueist·
$KLIC EXECUTIVE CALL SUMMARY: (Kulicke & Soffa Industries, Inc. 02/05/26) Kulicke & Soffa reported a material inflection in near-term demand conditions and delivered Q1 FY26 results above the company’s prior guidance, while issuing a notably higher Q2 FY26 outlook that implies accelerating sequential growth and expanding operating leverage. Management characterized demand as “faster and stronger” than previously expected, tied the current upcycle primarily to data center-driven capacity and technology requirements, and indicated improved visibility into FY26, including an explicit view that Q3 should be sequentially better than Q2 and that 2H FY26 should be 15% to 20% above 1H FY26. The call’s key incremental information for investment underwriting was the combination of (1) strong core assembly recovery signals (high utilization across regions and end markets), (2) a margin profile guided to remain near 49% to 50% gross margin through FY26 despite rapid growth, and (3) advanced packaging traction becoming more quantifiable (TCB expected to exceed $100M in FY26 revenue, installed base of 120 TCB tools with roughly 50% fluxless, and capacity expansion plans for Fluxless Thermo-Compression production). QUARTER PERFORMANCE AND QUALITY OF BEAT Q1 FY26 revenue was $199.6M, up 12.4% Q/Q and up 20.2% Y/Y. Gross margin was 49.6%, improving 390 bps Q/Q but down 280 bps Y/Y, with Y/Y comparisons mechanically distorted by prior-period items and mix differences. GAAP EPS was $0.32 and non-GAAP EPS was $0.44, up from $0.12 GAAP and $0.28 non-GAAP in Q4 FY25, and versus $1.51 GAAP and $0.37 non-GAAP in Q1 FY25. The $1.51 GAAP EPS in Q1 FY25 was heavily influenced by a gain relating to cessation of business, making GAAP Y/Y comparability low quality; non-GAAP metrics provide a more stable view of operational progression. The beat versus the company’s own prior outlook was meaningful. In the Q4 FY25 release, the company guided Q1 FY26 revenue to approximately $190M ± $10M with GAAP diluted EPS of $0.18 ± 10% and non-GAAP diluted EPS of $0.33 ± 10%. Actual Q1 FY26 revenue of $199.6M exceeded the $190M midpoint by $9.6M (+5.1%); GAAP EPS of $0.32 exceeded the $0.18 midpoint by $0.14 (+77.8%); non-GAAP EPS of $0.44 exceeded the $0.33 midpoint by $0.11 (+33.3%). This profile suggests that the upside was not limited to top-line overdelivery but also included favorable flow-through and/or below-modeled costs and taxes. (Kulicke & Soffa Industries, Inc.) Management attributed the sequential gross margin improvement to a er and product mix and a benefit from “revenue recognized from systems, which were previously expensed,” linked to “prior impairment charges as well as previously expensed R&D systems.” The explicit identification of previously expensed systems as a tailwind raises a key quality question: how much of Q1’s margin step-up was structurally repeatable versus episodic. Management’s subsequent guide for Q2 gross margin at 49% and commentary that gross margin should remain around 49% to 50% through the rest of FY26 indicated confidence that mix and absorption can largely sustain the margin profile even without repeating that specific benefit. END-MARKET MIX AND DEMAND SIGNALS Revenue composition in Q1 FY26 wneral Semiconductor at $125M, with Aftermarket Products & Services (APS) at $45M, Memory at $16M, and Auto & Industrial at $14M. This mix implies that the quarter’s outperformance and guidance strength were driven primarily by a rebound in the high-volume general semiconductor equipment cycle, supported by elevated utilization and capacity additions, while APS provided a meaningful recurring component leveraged to installed-base productivity. General Semiconductor was characterized as the primary engine of th stated that General Semiconductor revenue increased 27% sequentially and “over 90%” Y/Y, and estimated utilization levels remained “over 80%” for the end market. The combination of strong sequential growth and high utilization typically indicates that demand is not merely a short-duration restocking event, but increasingly reflects capacity constraint relief and/or technology-driven tool migration, especially when paired with management’s on-the-ground customer commentary from Taiwan and China. However, the reliance on utilization as a leading indicator should be treated as probabilistic rather than deterministic, particularly given the historical sensitivity of back-end equipment orders to macro swings, customer financing conditions, and regional policy constraints. Memory demand was described as robust on a utilization basis but vaasis due to customer and product mix. Management noted that after a 60% increase in the prior quarter, memory demand declined sequentially in Q1 FY26, while ball bonding utilization for memory exceeded 85%, up from the mid-70% range last year. This combination suggests (1) a healthy underlying capacity environment and (2) near-term revenue volatility driven by customer concentration and mix, rather than a broad demand downturn. The stated linkage between AI-related workloads and capacity tightness supports the view that memory assembly demand is structurally supported, but timing and mix can still drive quarter-to-quarter variability for KLIC. Auto & Industrial improved 15% sequentially, but management reiteraresidual headwinds to persist through FY26. The qualitative framing remained consistent: near-term cyclicality and potential softness, offset by long-term secular content growth (ADAS-driven semiconductor content per vehicle expected to double over 10 years) and longer-cycle opportunities in power semiconductors. This suggests that Auto & Industrial should not be underwritten as a primary FY26 growth driver but remains a medium-term optionality vector, particularly if power semiconductor transitions accelerate. APS increased 14% Y/Y, consistent with a utilization-led recovery t consumable pull-through on the installed base. APS is strategically relevant because it tends to dampen cyclicality and can improve margin stability as production activity rises. In Q1 FY26, APS at $45M represented a sizable portion of revenue, reinforcing that a meaningful part of the revenue base is less volatile than new tool shipments. REGIONAL UTILIZATION AND CYCLE INTERPRETATIONawas unusually specific and functioned as a key leading indicator supporting the upcycle narrative. China was described as “over 90%” utilization, the rest of Asia around 80%, Southeast Asia in the 70% range but improving, and North America/Europe around 80%. This distribution implies that the current demand improvement is broad-based across regions rather than isolated, while also indicating that China remains the tightest and most persistent utilization environment. High China utilization can be supportive for near-term orders, but it also concentrates incremental demand exposure to region-specific macro, policy, and customer behavior, which historically can increase downside convexity if conditions reverse. The call explicitly framed data center demand as the central driver: “data center is basically the central driver for this cycle.” The explanation connected data center growth to both advanced packaging (chiplet and heterogeneous logic applications) and traditional high-volume assembly needs (networking, communication, power, storage). This matters because it broadens the demand funnel beyond handset/PC unit dynamics and supports a higher-quality recovery thesis if the spending driver is infrastructure build-out rather than consumer refresh. TECHNOLOGY TRANSITIONS AND MULTI-YEAR OPTIONALITY The quarter’s nanning multiple technology transitions in parallel: Advanced Packaging (including Fluxless Thermo-Compression and Vertical Wire), Advanced Dispense, and Power Semiconductor. The near-term implication is execution risk (ramping production while transitioning technologies), while the medium-term implication is expanded served addressable market and improved durability of growth beyond the core ball bonder cycle. Advanced Packaging (TCB/FTC and Vertical Wire ith improving quantifiability. Management stated that demand for Fluxless Thermo-Compression remained robust, that the company shipped its 1st HBM system to a large memory customer during the quarter, and that FTC is expected to remain “a strong alternative to hybrid bonding for the next-generation HBM needs.” The near-term revenue implications are likely still weighted toward qualifications and selective tool placements, while the medium-term value creation is tied to conversion from qualification to volume tool orders and service pull-through. Several specific technical and commercializats underwriting assumptions: HBM: A 1st system shipment has occurred and qualification is underway; “volume production will be fiscal ’27,” with potential POs in FY26 but production weighted to FY27. This timeline suggests FY26 revenue contribution from HBM is likely limited to evaluation/qualification tools rather than full-volume capacity build. High-Bandwidth Flash (HBF): Management clarified “it is a TCB plaire,” described HBF as early stage with multiple packaging technologies potentially applicable, and indicated the commercialization timeframe “will probably be more of a CY27 play.” This places HBF as longer-dated optionality rather than a FY26 driver, while validating that KLIC expects TCB relevance if HBF progresses. Vertical Wire: Management indicated initial adoption could occur FY26, but “it will actually expand much more in FY27,” and noted active engagement with 8 customers across Korea, China, and the US. This implies the vertical wire opportunity is progressing but remains in pre-volume adoption and should be modeled with conservative conversion assumptions until clearer customer roadmaps and volume ramps are visible. Process differentiation claims were made but should be weighed agaiics. Management stated that formic acid FTC is already qualified and in high-volume production, while plasma qualification is in progress. Installed base was disclosed at 120 TCB tools with approximately 50% fluxless, and the FTC production footprint is being expanded: “expanding our facility here in Singapore to increase our Fluxless Thermo-Compression production capacity by 3x.” The explicit capacity expansion suggests management expects a sustained demand curve for fluxless FTC, but it also introduces execution and capital intensity considerations and raises the threshold for demand durability to prevent underutilized capacity. Advanced Dispense was described as progressing with initial customeCELON system introduced at Productronica. This remains early-cycle and should be treated as a pipeline indicator rather than a near-term earnings driver, with the key watch item being conversion of “multiple customers engaged” into repeatable volume orders and service attachment. Power Semiconductor positioning was reinforceioss auto, mobility, and data centers, with emphasis on more complex materials and assembly. This is directionally supportive, but near-term contribution is likely bounded by the company’s own expectation of lingering auto headwinds through FY26, and by the typical length of qualification cycles in power packaging equipment. GUIDANCE, VISIBILITY, AND CHANGE IN MANAGEMENT TONE Q2 FY26 guidanfully relative to the company’s prior run-rate and indicated accelerating growth. Management guided Q2 FY26 revenue to $230M ± $10M, gross margin to 49.0% ± 100 bps, non-GAAP operating expenses to $73.0M ± 2%, GAAP EPS to $0.53 ± 10%, and non-GAAP EPS to $0.67 ± 10%. The midpoint implies 15% sequential revenue growth and a step-function increase in EPS, signaling material operating leverage from incremental volume and an improved mix profile. (Kulicke & Soffa Industries, Inc.) The most important medium-twal range but the explicit FY26 directional framework provided in Q&A. Management stated improved visibility into FY26, with Q3 expected to be sequentially better than Q2 and 2H FY26 expected to be 15% to 20% above 1H FY26. This effectively functions as a partial full-year guide and reduces uncertainty around the persistence of the recovery, while still leaving room for macro-driven variance. The tone also acknowledged potential upside beyond the 15% to 20% view, but did not commit to it, implying a conservative bias in framing. Gross margin expectations were explicitly anchored for the remainder of FY26. Management stated: “for the rest of FY26, gross margin should be around 49% to1) higher demand for higher-performance ball bonders versus lower-margin categories, (2) absorption benefits from rising volumes, and (3) ongoing cost control discipline even during a ramp. This anchoring is material because it suggests that incremental profitability is expected to come more from operating leverage and mix rather than from meaningful further gross margin expansion beyond the high-40% range. Relative to external consensus expectations, the company’s Q2 guide was reported as substantially above market estimates. External reporting cited consensus90.5M and consensus adjusted EPS around $0.35, compared with KLIC’s guide midpoint of $230M and non-GAAP EPS of $0.67. If these consensus figures were directionally accurate, the guide implies a large reset in near-term expectations and likely forces rapid upward revisions to forward earnings power and cycle duration assumptions. FINANCIAL STRUCTURE, CASH FLOW, AND CAPITAL ALLOCATION Non-GAAP profitability improved sequentially, but cash generation lagged earnings in Q1 FY26 due to working capital. GAAP operating cash flow was $(8.9)M and adjusted free cash flow was $(11.6)M in Q1 FY26, versus positive adjusted free cash flow of $4.4M in Q4 FY25. Balance sheet metrics showed accounts receivable rising to $215.8M and inventory rising to $176.5M, consistent with a ramp and/or timing of shipments and collections. Net cash (defined as total cash and investments less current liabilities) declined to $284.3M from $322.5M sequentially. Working capital days improved to 323 from 362, but remained elevated in absolute terms, indicating ongoing sensitivity of cash conversion to the pace of demand and production ramps. (Kulicke & Soffa Industries, Inc.) Capital return cadence moderated in Q1 FY26. Share repurchases were $6.7M in Q1 FY26, down from $16.7M in Q4 FY25, while dividends remained approximately $10.7M. The reduced buyback pace, alongside net cash decline and negative free cash flow, suggests a more ca the ramp, potentially prioritizing working capital needs, capacity investments, and operational flexibility. Tax and operating expense dynamics have near-term modeling importance. Management stated tax expense was $5.7M and indicated an effective tax rate expected to remain above 20% over the near-term. GAAP operating expenses were $81.1M and non-GAAP operating expenses were $74.2M in Q1 FY26; non-GAAP operating expense guidance for Q2 FY26 of $73.0M implies discipline desp key driver of anticipated operating leverage. RISK ASSESSMENT AND KEY ITEMS TO MONITOR The call provided strong pro-cyclical indicators, but several risks remain central to underwriting: Cycle sustainability and concentration: The strongest utilization was reported in China (>90%). While broad-based utilization was also cited (~80% in multiple regions), incremental demand may still be dlembly ecosystem and policy environment. A reversal in China utilization or purchasing behavior would likely transmit quickly into equipment order rates. Memory volatility: Management explicitly flagged memory customer concentration and resulting quarter-to-quarter variability. Even with utilization >85%, memory tool demand can shift with mix, qualification timing, and customer-specific capex decisions. Margin quality and repeatability: Q1 gross margin benefited from revenue recognized from pensed. While management guided gross margin to remain ~49% in Q2 and ~49% to 50% in FY26, monitoring is required to confirm that repeatable drivers (mix, absorption, cost) offset any tapering of episodic benefits. Working capital aegative Q1 adjusted free cash flow indicates that the ramp may consume cash ahead of collections. Sustained inventory build or extended receivable cycles could constrain capital return and increase downside sensitivity if demand slows. Advanced packaging commercialization timing: HBM and HBF contributio FY27/CY27. The risk is that investors discount these opportunities into valuation too early, while near-term results remain primarily driven by the cyclical core. Execution progress should be measured by incremental qualification milestones, PO cadence, and evidence of volume n narrative strength. INVESTMENT IMPLICATIONS The quarter and call materially improve the near-term earnings power trajectory and reduce uncertainty around the persistence of the recovery through FY26. The most investable signal was the combination of (1) Q2 guidance implying 15% sequential revenue growth with stable gross margin, (2) explicit directional guidance for sequential improvemonger 2H FY26 versus 1H FY26, and (3) utilization data consistent with a capacity-driven cycle rather than a narrow restock. These factors support a higher probability that FY26 represents a meaningful cyclical recovery year from FY25 levels, with incremental upside if the data center-driven assembly demand persists longer than typical consumer-led cycles. (Kulicke & Soffa Industries, Inc.) The guidance profile implies substantial operating leverage. With gross margin guided around 49% and non-GAAP operating expense guided down sequentially despite higher revenue, incremental gross profit should convert at a higher rate to operating profit. This increases sensitivity to top-line deviations versus guidance: upside lS upside, while downside revenue variance could compress profitability more rapidly given fixed cost absorption dynamics. Management explicitly stated focus on cost control “even during a ramp,” which, if delivered, can mitigate the downside case but also increases operational execution requirements (supply chain, manufacturing throughput, and delivery performance). The call strengthens the strategic argument that KLIC has multiple engines: a cyclical core (ball bonding and related high-volume assembly) and multi-year transition opportunities (TCB/FTC, vertical wire, advanced dispense, power semiconductors). The advanced packaging disclosures were particularly relevant: TCB expected to exceed $100M in FY26, 120 TCB tools in the field, approximately 50% fluxless, and a 3x fluxless FTC capacity expansion. These data poility that advanced packaging is transitioning from “optionality” to a more durable revenue stream, though the highest-value DRAM-related ramps (HBM volume, vertical wire scale, HBF commercialization) remain primarily FY27/CY27 events based on management’s own timeline. From a risk-reward perspective, the near-term setup becomes more asymmetric around execution and cycle persistence rather than around near-term demand emergence. The market debate should shift toward (1) how long elevated utilization persists, (2) whether Q2 guidance is conservative or indicative of a sustained run-rate shift, and (3) whether cash conversion improves as the ramp matures. The company’s Q1 free cash flow deficit and net cash decline should oring item rather than a thesis breaker, but it directly affects capital return flexibility and can matter materially if the cycle stalls. Key call-derived indicators for ongoing monitoring: Regional utilization trajectory, particularly China remaining >90% and whether Southeast Asia and North America continue rising toward the ~80% band. General Semiconductor order strength and mix shift toward higher-performance bonders, given management’s margin thesis. Evidence that Q2 guidance quality is supported by backlog visibility and production ramly optimistic demand signals. Advanced packaging milestones: additional HBM/FTC qualification shipments, PO conversion signals, and progress on plasma qualification; monitoring capacon in Singapore. Working capital normalization: inventory and receivable trends versus revenue growitive free cash flow. COMPANY PARTICIPANTS Joseph Elgindy, Senior Director, Investor Relations & Strategic Planning Lester Wong, Interim Chief Executive Officer; Executive Vice President, Finance and IT; Chief Financial Officer RESEARCH ANALYSTS Charles Shi, Needham & Company rish Sankar, TD Cowen Craig Ellis, B. Riley Securities David Duley, Steelhead Se
English
1
2
9
6.2K
Olórin 🧙‍♂️ retweetledi
Nicky The Good
Nicky The Good@nickythegood·
When a non-parent says they’re tired at any point of their day/life
English
113
557
6K
2.2M
Olórin 🧙‍♂️
Olórin 🧙‍♂️@__Galathilion·
@DeepIceValue I understand conceptually where you are/what you are thinking here. It’s rational. I would argue that we’ve never seen demand like this for DRAM. It was historically a very cyclical part of the market. This is a second wave Industrial Revolution. What we knew is no longer what is
English
0
0
0
3
Deep Value Investing
Deep Value Investing@DeepIceValue·
How do you know if you are an idiot? Well you look at $MU 532% returns in 1 year and you think "thats normal, maybe I should buy now.."
Deep Value Investing tweet media
English
176
14
434
131K
Amy Nixon
Amy Nixon@texasrunnerDFW·
I am astounded by the number of millennial families who moved to Dallas, bought a home, then turned around and sold the home to move out of Dallas, in less than a 5 year time span Is Dallas just super transient or is this a post-pandemic phenomenon happening everywhere?
English
620
79
2.2K
3M
Olórin 🧙‍♂️
Olórin 🧙‍♂️@__Galathilion·
@zillowgonewild What are the operating costs annually on something like this? Lawn maintenance, utilities, pool, etc. have to be astronomical
English
2
0
0
16.3K
Zillow Gone Wild 🏡
Zillow Gone Wild 🏡@zillowgonewild·
🚨🚨🚨$115,000,000!! For only $115 million you can get the most “significant private estate ever built in the US and Florida”. This 87 (!!) acre lakefront home on Lake Thonotosassa has helicopter and seaplane arrival options. The French Normandy home, has a 36 acre stone-wall with 51 acres of greenbelt reserve. The mansion has almost 43k sq ft of space and basically every amenity you could imagine including a 24 car auto museum, bowling alley, billiards, theater, wellness center, indoor saltwater pool, outdoor 72’ pool, go-kart cirtcuit, boathouse, 1 mile jogging path, horse stuff and more. Who wants to split it with me?? Ps It’s also the most expensive listing ever in Tampa.
Zillow Gone Wild 🏡 tweet mediaZillow Gone Wild 🏡 tweet mediaZillow Gone Wild 🏡 tweet mediaZillow Gone Wild 🏡 tweet media
English
110
93
1.9K
1.3M
Olórin 🧙‍♂️
Olórin 🧙‍♂️@__Galathilion·
@380kmh @upstatefederlst Proximity without a car. Sometimes it’s nice to save commute time by using your God given body to get to places. Aesthetically, modern suburbs are also boxes of repeat black and white design that suck the very soul of the human spirit out of existence. There are pros though, too
English
0
0
0
9
Olórin 🧙‍♂️
Olórin 🧙‍♂️@__Galathilion·
HR needs to be designated as a terrorist organization. Grown adults don’t need corporate babysitters.
English
0
0
0
2