Excited to announce the publication of two papers together in the April 2024 issue of @JPerinatology. Our Brief Communication paper builds upon our @NatureComms paper (rdcu.be/dEg05), demonstrating the persistence of the 3 growth phases in moderate preterm infants.
R cuadrado no mide la bondad de ajuste.
R cuadrado no mide el error predictivo.
R cuadrado no permite comparar modelos utilizando respuestas transformadas.
R cuadrado no mide cómo una variable explica otra.
buff.ly/4coVqVA#stats#analytics#datascience#dataviz#rstats
@a_cabreja It's a web framework for R inspired by express.js (the syntax is almost identical)
It lets you build web apps, Rest APIs, etc.
github.com/devOpifex/ambi…
💡“Los datos son números, pero no son 'sólo números'. Los datos son números con un contexto” David Moore.
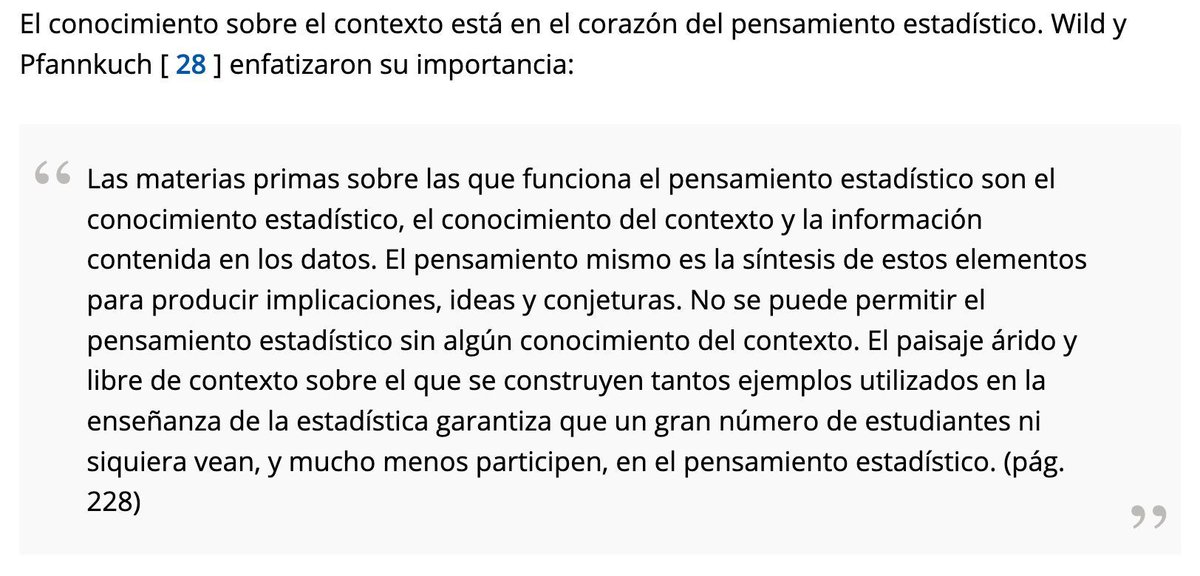
🧠El conocimiento sobre el contexto está en el corazón del pensamiento estadístico.
👉Este artículo recibió el premio C. Oswald George para 2023.
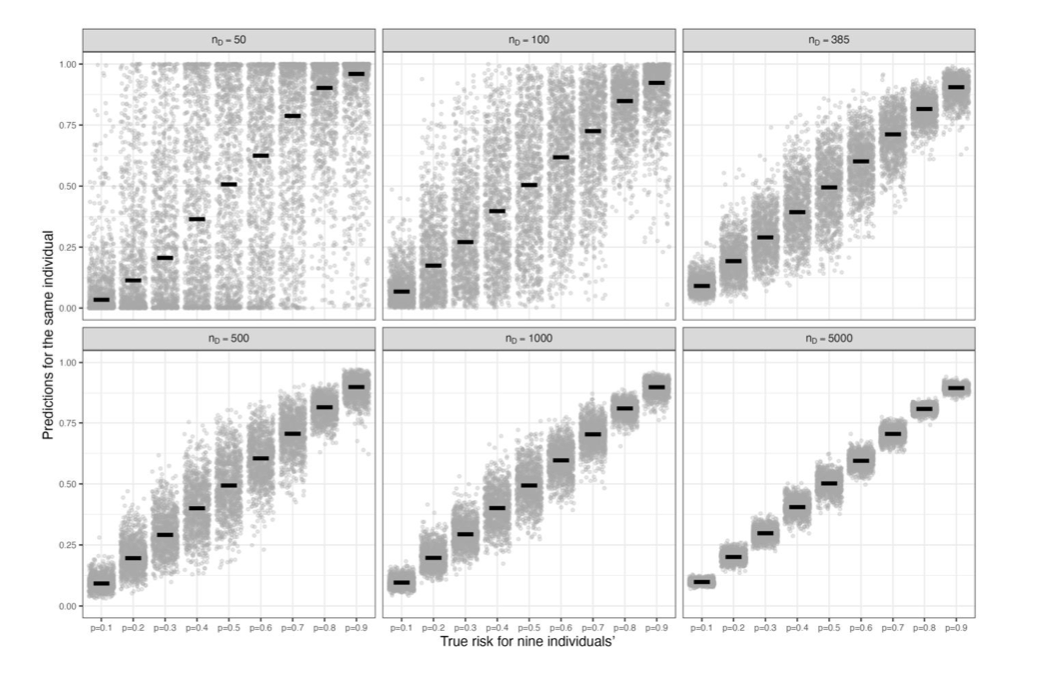
NEW preprint 'Stability of prediction models' @Richard_D_Rileyarxiv.org/abs/2211.01061
Influenced by @f2harrell 'example models', different samples from a population to train models (small/mod. N) will lead to wildly different predictions for the same individual. #statstwitter
I'm planning a Q&A session focused on #R, #Statistics, and #MachineLearning. Have any burning questions, need coding advice, or want to discuss a concept? Drop your questions below and let's dive deep into the conversation!
@RosanaFerrero Muchas gracias por toda la info que compartes. De verdad me es muy útil. De hecho, casi todos los días en la mañana lo primero que hago es revisar si has publicado algo nuevo. Eres como el New York Times de la ciencia de datos jajajaja
🤖📚 Descubre las mejores herramientas impulsadas por #AI para la investigación académica y ahorra tiempo para hacer lo que más te gusta
📚 Accede a más información en menos tiempo!
🚀 Dale un impulso a tu investigación académica!
#GPT#DataScience#science#chatGPT#research#ML
No necesitamos un valor en particular del R2 para obtener una interpretación válida de un modelo.
👉En su lugar, pregúntate: ¿El modelo es lógico? ¿Se ajusta a la teoría? ¿Los datos son confiables? ¿Cómo interpreto el modelo? ¿Se cumple con los supuestos del modelo?
#Statistics
ANUNCIO IMPORTANTE:
Estimados clientes, en la noche de hoy haremos el proceso de migración planificado para este mes.
Hora de comienzo: 8pm CET
Tiempo estimado: 30 minutos